. 2017 Sep;1861(9):2196-2205.
doi: 10.1016/j.bbagen.2017.06.014. Epub 2017 Jun 20.

Exploiting sequence and stability information for directing nanobody stability engineering

Affiliations

Exploiting sequence and stability information for directing nanobody stability engineering

Patrick Kunz et al. Biochim Biophys Acta Gen Subj. 2017 Sep.

Abstract

Background: Variable domains of camelid heavy-chain antibodies, commonly named nanobodies, have high biotechnological potential. In view of their broad range of applications in research, diagnostics and therapy, engineering their stability is of particular interest. One important aspect is the improvement of thermostability, because it can have immediate effects on conformational stability, protease resistance and aggregation propensity of the protein.

Methods: We analyzed the sequences and thermostabilities of 78 purified nanobody binders. From this data, potentially stabilizing amino acid variations were identified and studied experimentally.

Results: Some mutations improved the stability of nanobodies by up to 6.1°C, with an average of 2.3°C across eight modified nanobodies. The stabilizing mechanism involves an improvement of both conformational stability and aggregation behavior, explaining the variable degree of stabilization in individual molecules. In some instances, variations predicted to be stabilizing actually led to thermal destabilization of the proteins. The reasons for this contradiction between prediction and experiment were investigated.

Conclusions: The results reveal a mutational strategy to improve the biophysical behavior of nanobody binders and indicate a species-specificity of nanobody architecture.

General significance: This study illustrates the potential and limitations of engineering nanobody thermostability by merging sequence information with stability data, an aspect that is becoming increasingly important with the recent development of high-throughput biophysical methods.

Keywords: Protein aggregation; Protein design; Protein engineering; Protein stability; Single-domain antibody (sdAb, nanobody).


Figures

Fig. 1
Fig. 1
GSS analysis of nanobody stability and aliphatic indices. (A) Tm distribution of 78 nanobodies that bind to different antigens. (B) Plot of raw Tm values and aliphatic indices. (C) Plot of GSS scores for Tm and aliphatic indices. The GSS scores quantify the mutational signatures that are characteristic for stability, or the aliphatic index, respectively. Colors mark the nanobody origin as indicated in the legend; yellow data points indicate dromedary nanobodies chosen for N-terminal mutations. (D) K-means clustering of the data of panel C, yielding two clusters (blue and gray). The mean Tm values of both clusters are shown; the mean sequence identity is 0.68 and 0.77 for cluster 1 and 2, respectively. Circles around the cluster centers indicate one standard deviation. The correlation between GSS scores and respective Tm values and aliphatic indices is shown in Supplementary Fig. 4.
Fig. 2
Fig. 2
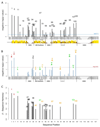
GSS stability signature. (A) Sequence differences between the nanobodies in clusters 1 and 2 of Fig. 1D, calculated by a contingency table chi-squared test. Plotted are respective negative log10(p) values, drawn above the nanobody MSA. The numbers represent the MSA-specific position. For CDR3, no signal is observed due to its high variability in both clusters. “CDR4” represents a fourth loop that is facing the antigen but commonly without making contacts. The bars below the nanobody MSA show the degree of conservation of physico-chemical properties for each column; the color and bar height encode the degree of conservation; yellow: high conservation, brown: low conservation. Nanobody hallmark positions are indicated by filled circles (HM-Positions). (B) Influence of sequence differences on nanobody thermostability. At each position, sequences bearing the most frequent residue were grouped within each cluster. The influence of two different residues in cluster 1 and 2 were evaluated by a t-test, considering the respective mean Tm values of the grouped sequences. The respective negative log10(p) values are plotted. Sequence numbering and labeling are identical to panel A. Position 36 indicates a cysteine that is attributed to the additional disulfide bond present in several dromedary nanobodies but not in llama. Red letters: vector-encoded N-terminal residues, specific for llama nanobodies; green letters: residues that do not make any contacts to CDRs according to the crystal structure 1F2X of a dromedary nanobody; orange letters: residues that make contacts to CDRs in structure 1F2X. (C) Subtype-specific sites from a comparison of dromedary- and llama-derived nanobodies using the sequence harmony server [62]. A value of 1 indicates a non-overlapping residue distribution while a value of 0 signifies an identical distribution between both groups. The black bar indicates position 36 which is occupied by a cysteine in some dromedary-derived nanobodies and is linked to enhanced stability, an aspect that cannot be revealed from this kind of analysis. The sequence numbering and the color code are as in Fig. 2B. Sequence Harmony analysis was performed with a cutoff value of 0.7. Afterwards, the sequence harmony score was inverted and values for the CDR3 region omitted.
Fig. 3
Fig. 3
Stabilization of dromedary nanobodies by N-terminal mutations Q1E and Q5V. (A) Crystal structure of nanobody NbD2 (PDB ID: 5M7Q, for data collection and refinement statistics see Supplementary Table 1). The locations of N-terminal (red) and framework mutations (green) are indicated. (B) Effect of N-terminal mutations tested in a diverse set of eight dromedary nanobodies (mean sequence identity = 0.67) using the Thermofluor assay. The statistical significance of stabilization was calculated by a paired t-test and a Wilcoxon signed-rank test; the respective p-values are shown. Also, the mean amplitude of stabilization is indicated. Protein concentration: 0.5 mg/ml; heating rate: 0.5 °C/min. (C) Effect of N-terminal mutations Q1E and Q5V in the same dromedary nanobodies as listed in panel B, measured by differential scanning fluorimetry (DSF; based on intrinsic tryptophan fluorescence). Statistical evaluation and heating rate were as in panel B. (D) Destabilization of dromedary nanobodies by framework mutations 11L, 47Q, 66A, 95R and 101V measured in a Thermofluor assay. This group of mutations does not form contacts with CDRs in the crystal structure 1F2X of a dromedary nanobody. Statistical evaluation and assay conditions were as in panel B. All measurements were done in triplicate.
Fig. 4
Fig. 4
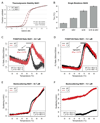
Mechanism of stabilization by N-terminal mutations Q1E and Q5V. (A) Thermodynamic stability of nanobody NbD1 and its N-terminally mutated variant in guanidinium chloride dependent equilibrium unfolding experiments. The fraction of unfolded protein was measured by intrinsic tryptophan fluorescence and fitted according to Santoro and Bolen [45]. Red lines represent fitted curves. (B) Additive effect of thermostabilization by single and double mutations in nanobody NbD4, measured by differential scanning fluorimetry in triplicate using conditions as in Fig. 3C. Improvements by mutations Q5V (0.9 °C) and Q1E (2.3 °C) match the stabilization in the double mutant (3.1 °C). (C, D) Tryptophan fluorescence ratio (350 nm/330 nm) for melting nanobody NbD1 and its N-terminally mutated variant; in panel C, the standard assay concentration of 32.7 μM was used; in panel D, the concentration was reduced to 13.1 μM. Aggregation is indicated by a reduced amplitude of the unfolding transitions in the fluorescence traces and can be quantified by comparing Tm values of both concentration sets. Heating rate: 0.5 °C/min. (E, F) Back-scattered light obtained from a parallel turbidity measurement indicates aggregation onset temperatures.
Fig. 5
Fig. 5
Species-dependent difference contact map of the nano-body fold. Connectivity networks of non-covalent contacts between amino acid residues were calculated on the basis of 10 llama and 4 dromedary monomeric crystal structures, respectively. The frequencies of a contact in each set of structures from a species provide a measure of the “conservation” of a residue contact in the respective species. Accordingly, subtracting species-specific frequencies allows the visualization of architectural differences between different species. The extent of contact differences between llama and dromedary nanobodies is indicated by spot intensity and color. For example, a red dot with frequency of 1.0 indicates a contact that occurs in every llama nanobody, and not in any dromedary nanobody. Green bars indicate contact differences for positions tested in mutational experiments (Fig. 3D). Sequence numbering is as in the MSA of Fig. 2.

Similar articles

Cited by

References

    1. Wesolowski J, Alzogaray V, Reyelt J, Unger M, et al. Single domain antibodies: promising experimental and therapeutic tools in infection and immunity. Med Microbiol Immunol. 2009;198:157–174. - PMC - PubMed
    1. Huang L, Muyldermans S, Saerens D. Nanobodies®: proficient tools in diagnostics. Expert Rev Mol Diagn. 2010;10:777–785. - PubMed
    1. Siontorou CG. Nanobodies as novel agents for disease diagnosis and therapy. Int J Nanomedicine. 2013;8:4215–4227. - PMC - PubMed
    1. Helma J, Cardoso MC, Muyldermans S, Leonhardt H. Nanobodies and recombinant binders in cell biology. J Cell Biol. 2015;209:633–644. - PMC - PubMed
    1. Muyldermans S. Nanobodies: natural single-domain antibodies. Annu Rev Biochem. 2013;82:775–797. - PubMed

Publication types

Substances