A TRPV1-to-secretagogin regulatory axis controls pancreatic β-cell survival by modulating protein turnover
- PMID: 28637794
- PMCID: PMC5510001
- DOI: 10.15252/embj.201695347
A TRPV1-to-secretagogin regulatory axis controls pancreatic β-cell survival by modulating protein turnover
Abstract
Ca2+-sensor proteins are generally implicated in insulin release through SNARE interactions. Here, secretagogin, whose expression in human pancreatic islets correlates with their insulin content and the incidence of type 2 diabetes, is shown to orchestrate an unexpectedly distinct mechanism. Single-cell RNA-seq reveals retained expression of the TRP family members in β-cells from diabetic donors. Amongst these, pharmacological probing identifies Ca2+-permeable transient receptor potential vanilloid type 1 channels (TRPV1) as potent inducers of secretagogin expression through recruitment of Sp1 transcription factors. Accordingly, agonist stimulation of TRPV1s fails to rescue insulin release from pancreatic islets of glucose intolerant secretagogin knock-out(-/-) mice. However, instead of merely impinging on the SNARE machinery, reduced insulin availability in secretagogin-/- mice is due to β-cell loss, which is underpinned by the collapse of protein folding and deregulation of secretagogin-dependent USP9X deubiquitinase activity. Therefore, and considering the desensitization of TRPV1s in diabetic pancreata, a TRPV1-to-secretagogin regulatory axis seems critical to maintain the structural integrity and signal competence of β-cells.
Keywords: Ca2+ signalling; diabetes; endocannabinoid; exocytosis; β‐cell.
© 2017 The Authors.
Figures
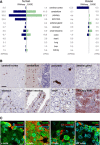
Secretagogin expression in 12 human and mouse tissue types based on correlated RNA‐seq and cap analysis of gene expression (CAGE) data. Data are expressed either as reads per kilobase of transcript per million mapped reads (RPKM) or tags per million (TPM). In human, secretagogin is mainly expressed in the CNS, endocrine glands (pancreas and pituitary) and the gastrointestinal tract. A similar expression pattern is observed in mouse with the exception of the cerebellum, which lacks secretagogin expression.
Immunohistochemistry reveals secretagogin expression in a subset of (inter)neuron‐like cells in the cerebral cortex and molecular layer of the cerebellum, endocrine pancreas, enteroendocrine cells of the stomach, small intestine and colon, as well as olfactory bulb of human subjects. Scale bars = 100 μm.
Secretagogin was detected in glucagon+ α‐cells, insulin+ β‐cells, somatostatin (SST)+ δ‐cells and some pancreatic polypeptide+ cells in adult mouse pancreas. Scale bars = 5 μm.
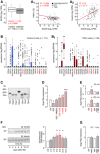
- A–A2
Transcriptome analysis (bulk) of human (n = 202) pancreatic islets reveals decreased secretagogin (SCGN) expression in patients with type 2 diabetes (T2D; A). A negative correlation between secretagogin expression and the level of glycated haemoglobin (HbA1c) is shown (A1). Conversely, secretagogin mRNA levels positively correlate with insulin expression (A2). Data were presented as log2 counts per million (CPM). IGT, impaired glucose tolerance. Boxes represent 25th percentiles ± 90th percentiles, horizontal lines represent median values.
- B, B1
Single‐cell RNA‐seq analysis of TRP family members in β‐cells from healthy (n = 6) and type 2 diabetic (n = 4) donors reveals retained TRP expression in β‐cells from diabetic subjects. Data were expressed as log2 reads per kilobase of transcript per million mapped reads (RPKM). Boxes represent 25th percentiles ± 90th percentiles, horizontal lines represent mean values.
- C
Reverse‐transcription PCR products of select TRP channels and Grin1 (encoding NMDA receptor subunit 1) in INS‐1E cells.
- D
Acute agonist stimulation (30 min) of TRPM3 (CIM 0126; 1 μM), TRPV3 (2‐APB; 25 μM) and TRPV1 (capsaicin; caps; 300 nM) promotes secretagogin expression in INS‐1E cells with the most pronounced effect evoked by capsaicin. INS‐1E cell depolarization with KCl (30 mM, 30 min) decreases secretagogin expression, which was reversed by NMDA.
- E
Capsazepine, a TRPV1 antagonist (10 μM), occluded capsaicin‐induced secretagogin expression at both 30 and 120 min.
- F
Long‐term (2–12 h) stimulation of INS‐1E cells with capsaicin increases secretagogin protein content. Quantitative data reflect fold changes in SCGN signal intensity normalized to tubulin.
- G
Capsaicin fails to increase secretagogin mRNA expression in Ca2+‐free media. Representative immunoblots are shown.

- A
Size exclusion chromatography confirming the purity of recombinant His6‐tagged secretagogin.
- B
Protein folding integrity confirmed by circular dichroism spectroscopy returned the spectrum of a typical all‐α fold as expected based on the known high‐resolution structure of the zebrafish homologue (Bitto et al, 2009).
- C
Coomassie blue staining of purified His6‐tagged secretagogin.
- D, E
Metal ion stabilization by secretagogin was investigated using the Thermofluor method (Ericsson et al, 2006). Typical thermal denaturation was observed in the presence of Ba2+, Ca2+, Mg2+, Sr2+ (all Ca2+‐analogues; D), while the presence of other metal ions (E) resulted in curves where temperature‐dependent unfolding could not be detected. All measurements were done in triplicate; representative results are shown.

- A, A1
In silico prediction of Sp1 transcription factor binding sites within the human and murine secretagogin promoters (up to −1,400 bps). (A1) Consensus recognition sequences exported from (A).
- B–B3
Capsaicin (caps; TRPV1 agonist; 300 nM for 30 min) induces Sp1 translocation to the nucleus (determined as increased Sp1 immunoreactivity) in INS‐1E cells. Representative images are shown. Hoechst 33342 was used as nuclear counterstain. Scale bar = 5 μm. (B2) This capsaicin effect is blocked by capsazepine (cpz; TRPV1 antagonist, 10 μM). Capsaicin is also ineffective in the absence of extracellular Ca2+ (B3). Representative images for quantitative data are shown in Fig EV3. Data were expressed as means ± s.d. from triplicate experiments with n ≥ 100 cells/group quantified for (B2, B3).
- C, C1
Deletion of predicted Sp1 binding sites in the Scgn promoter (C) abrogates basal and capsaicin‐induced (300 nM for 30 min) promoter activity defined as a ratio of firefly to Renilla luciferase chemiluminescence (3.5 h after stimulation; C1). Data were expressed as means ± s.d. from triplicate experiments.

- A–A3
Capsaicin (caps; TRPV1 agonist; 300 nM, 30 min) induces Sp1 translocation to the nuclei of INS‐1E cells (determined as an increased level of Sp1 immunoreactivity). This capsaicin effect is blocked by capsazepine (cpz; TRPV1 antagonist, 10 μM). Scale bar = 5 μm.
- B–B3
Capsaicin is ineffective in the absence of extracellular Ca2+. Scale bar = 5 μm.
- C–C6
CIM 0126 (TRPM3 agonist; 1 μM, 30 min), 2‐APB (TRPV3 agonist; 25 μM, 30 min) and capsaicin promote nuclear Sp1 import, whereas KCl (30 mM, 30 min) alone or in combination with NMDA (NMDA receptor agonist; 20 μM, 30 min) remains ineffective. Representative images are shown. Hoechst 33342 was used as a nuclear counterstain. Scale bar = 5 μm. Data are expressed as means ± s.d.; n ≥ 100 cells/group from triplicate experiments, **P < 0.01, *P < 0.05; pairwise comparisons/one‐way ANOVA.

- A–A3
Reduced immunoreactivity for total (A2) and nuclear (A3) Sp1 in pancreata of Trpv1 −/− mice as compared to wild‐type controls.
- B–B2
Reduced secretagogin (SCGN) immunoreactivity in pancreata from Trpv1 −/− mice. Representative images are shown. Open boxes reflect the general location of numbered insets. Hoechst 33342 was used as nuclear counterstain.
- C
Likewise, Scgn mRNA expression in pancreatic islets isolated from Trpv1 −/− mice is significantly decreased.

- A
Scgn silencing in INS1‐E cells does not affect TRPV1 phosphorylation (expressed as pTRPV1/TRPV1) despite significantly increasing total TRPV1. Total protein dye‐labelling was used as control. A representative immunoblot is shown. Quantitative data were expressed as fold changes in signal intensity vs. control and normalized to total protein. Data were expressed as means ± s.d. from triplicate experiments.
- B
Trpv1 mRNA expression in secretagogin knock‐out (Scgn −/−) mice. Data were expressed as means ± s.d. from triplicate experiments.
- C–C2
Histochemical detection of TRPV1s in pancreatic islets of Scgn −/− mice confirmed their increased amounts relative to wild‐type littermates (C2). Representative images are shown. Hoechst 33342 was used as nuclear counterstain. Scale bars = 15 μm and 2 μm (numbered inserts). Quantitative results were expressed as means ± s.d. from triplicate experiments; n > 10 islets (C–C2).
- D, D1
In dissociated islets from Scgn −/− and wild‐type mice, β‐cells were identified by their Ca2+ responses to 16 mM glucose (upper traces). Subsequent bath application of capsaicin (caps; 300 nM) barely mobilized intracellular Ca2+ in β‐cells from either genotype (bottom traces). (D1) Quantitative analysis of glucose‐ and capsaicin‐induced Ca2+ responses in wild‐type and Scgn −/− β‐cells are shown as dot density plots combined with box plots representing medians and 10th, 25th, 70th and 90th percentiles. Red lines within box plots represent mean and black median values. Peak values during the first 100 s (for capsaicin) or 300 s (for glucose) stimulation were plotted. Mann–Whitney rank‐sum test failed to reveal statistically significant differences between wild‐type and Scgn −/− samples for either stimulation.
- E
Capsaicin (300 nM) is ineffective in potentiating basal (low glucose) or glucose‐stimulated insulin secretion from pancreatic islets isolated from Scgn −/− mice. Data were expressed as means ± s.d. from n = 30 islets (E) from at least three mice/genotype.
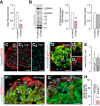
- A
Significantly decreased Scgn mRNA expression was observed 48 h after transfection of INS‐1E cells with a targeting Scgn siRNA. TATA‐binding protein (Tbp), a housekeeping gene, was used to normalize gene expression. Data were expressed as means ± s.d. from triplicate experiments; **P < 0.01 (Student's t‐test).
- B
Western blotting confirmed successful secretagogin silencing by siRNA. Cy5‐labelling of the total protein load was shown to normalize secretagogin data. Representative immunoblot is shown. Quantitative analysis of immunoblots depicts fold changes in signal intensity vs. control and is normalized to the total protein level. Data were expressed as means ± s.d. from triplicate experiments; **P < 0.01 (Student's t‐test).
- C–C2
Decreased level of secretagogin (SCGN) immunoreactivity in pancreatic islets of Scgn +/− mice and the complete lack of secretagogin in pancreatic islets from Scgn −/− mice confirm (i) an allelic dosage effect on protein content and (ii) the specificity of antibodies. Scale bars = 25 μm.
- D, D1
β‐galactosidase (β‐gal) immunosignal in a pancreatic islet of Scgn −/− mice confirm the successful insertion of the LacZ/Δgeo cassette used to disrupt the Scgn gene. Hoechst 33342 was used as a nuclear counterstain. Scale bars = 25 μm and 3 μm in inset.
- E
Quantitative analysis of the pancreas in Scgn −/− mice shows no change in islet number relative to wild‐type controls. Islet numbers were normalized to tissue area. Data were expressed as means ± s.d. from triplicate experiments.
- F, G
Lack of secretagogin immunosignals in insulin+ β‐cells (open and closed arrowheads) confirms successful tamoxifen‐induced secretagogin ablation. In contrast, secretagogin expression in α‐cells is retained (arrows) β‐Scgn CKO mice. Scale bars = 10 μm.
- H
Quantitative analysis of the ratio of secretagogin+ β‐cells amongst all insulin+ β‐cells in wild‐type and β‐Scgn CKO mice. Data were expressed as means ± s.d. (percentages) from > 3 mice/genotype; **P < 0.001 (Student's t‐test).
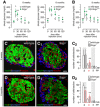
- A
Glucose intolerance in secretagogin−/− (Scgn −/−) mice at 6 weeks of age (left). Six‐month‐old Scgn −/− mice have a pre‐diabetic profile of glucose utilization (right), including significantly elevated fasting blood glucose levels. n = 6 animals/genotypes/age was used.
- B
Elevated fasting blood glucose levels and impaired glucose clearance in β‐Scgn CKO was observed at 6 weeks of age. n = 6 mice/genotype.
- C–C2
At the age of 6 weeks, pancreatic islets of Scgn −/− mice contain an increased number of α‐cells in conjunction with unchanged β‐cell numbers (C2).
- D–D2
At the age of 6 months, however, a significant decrease in β‐cells together with persistent α‐cell hyperplasia was seen in Scgn −/− mice relative to wild‐type littermates. Representative images are shown. Hoechst 33342 was used as nuclear counterstain (pseudo‐coloured in red).

- A
Pancreatic islets isolated from Scgn −/− mice fail to secrete insulin in response to high glucose (16.75 mM) or KCl (30 mM) stimulation.
- B–D
Pancreatic islets isolated from Scgn −/− animals show decreased expression of insulin (Ins2) mRNA (B), reduced intensity of insulin immunoreactivity per β‐cell both at 6 weeks and 6 months of age (C), and decreased insulin content (D).
- E–E3
Electron microscopy of pancreatic β‐cells in glucose challenged mice (30 min post‐injection) reveals a reduction in the total number of insulin granules (E2), including fewer docked vesicles (E3) in β‐cells of Scgn −/− mice (vs. wild‐type controls). Dashed red lines mark the plasmalemma. Green shading highlights insulin‐containing secretory granules. Semitransparent red shading marks docked vesicles (in direct contact with the plasmalemma). Representative ultramicrographs are shown. Scale bars = 1 μm (E, E1) and 150 nm (E′, E1′).
- A
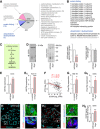
Proteins identified as molecular interactors when using purified His6‐tagged secretagogin as bait include (by GO function determination) those for protein folding, vesicle‐mediated transport, exocytosis as well as protein (de‐)ubiquitination. Bracketed numbers refer to the number of proteins per GO cluster. “Other processes” refer to those, which were not analysed in detail. Nevertheless, the identity, discovery rate and peptide fragmentation data for all interacting proteins from our LC‐MS/MS analyses are listed in Table EV3.
- B
List of interacting partners involved in protein folding and protein ubiquitination/deubiquitination.
- C
Schema of predicted steps triggering β‐cell death upon unfolded protein response when genetically ablating secretagogin. Decreased protein folding in β‐cells is posited to induce endoplasmic reticulum (ER) stress, expression of Atf4 transcription factor and the pro‐apoptotic protein CHOP, leading to the activation of caspase 3 and, ultimately, apoptotic cell death.
- D
The level of T‐complex protein 1 subunit 8 (CCT8) is significantly decreased in pancreatic islets isolated from Scgn −/− mice, as compared to wild‐type controls. Left: Representative immunoblot with adjacent Cy5‐labelled total protein control are shown. Right: Fold change in CCT8 and total protein in Scgn −/− pancreata vs. wild‐type littermates. Data are expressed as means ± s.d. from n = 3 mice/genotype.
- E, E1
Atf4 expression is significantly increased in pancreatic islets isolated from Scgn −/− mice, as compared to wild‐type controls (E) and upon silencing of secretagogin expression (si Scgn) in INS‐1E cells (E1). Data represent means ± s.d. from triplicate experiments.
- F
Secretagogin mRNA levels are negatively correlated with ATF4 expression in human pancreatic islets. Means ± s.d. log2 counts per million (CPM) are shown.
- G, G1
mRNA expression of the pro‐apoptotic protein Chop is significantly increased in INS‐1E cells upon secretagogin silencing (G) and in pancreatic islets isolated from Scgn −/− mice (G1). Data were normalized to those in control/wild type in triplicate experiments (G) or n = 3 mice/genotype (G1) and expressed as means ± s.d.
- H–H2
Increased CHOP immunoreactivity in pancreatic islets of Scgn −/− mice as compared to wild‐type controls. Representative images are shown. Hoechst 33342 was used as a nuclear counterstain. Scale bars = 15 μm, and 2 μm in numbered insets. (H2) Quantitative data are expressed as means ± s.d. n = 20 islets from 3 mice/genotype were analyzed.
- A, A1
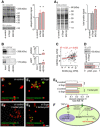
(A) Accumulation of ubiqitinated proteins in INS‐1E cells with siRNA‐mediated secretagogin knock‐down. MG132 (10 μM, 6 h), a proteasome inhibitor, was used as a positive control. (A1) In contrast to MG132, secretagogin silencing does not alter the total protein level.
- B
Ubiquitin carboxyl‐terminal hydrolases USP9X and USP7 remained in the eluted fraction upon pull‐down with His6‐tagged secretagogin, suggesting protein–protein interaction.
- C
USP9X mRNA expression positively correlates with the level of secretagogin mRNA in human pancreatic islets.
- D
Impaired activity of USP9X and USP7 upon secretagogin knock‐down is validated by the decreased level of USP target protein p53, one of their molecular targets (Li et al, 2002). Total protein level is shown in Fig EV6.
- E–E4
Proteasome inhibition by lactacystin (5 μM, 6 h) with concomitant siRNA‐mediated secretagogin knock‐down significantly reduces the number of cleaved caspase 3+ (apoptotic) INS‐1E cells. Representative images are shown. Hoechst 33342 was used as a nuclear counterstain (pseudo‐coloured in red). Scale bar = 5 μm.
- F
Proposed mechanism of the upstream regulation of secretagogin (SCGN) expression to determine β‐cell survival. TRPV1‐mediated increase in intracellular Ca2+ promotes the translocation of Sp1 to the nucleus to induce Scgn transcription. SCGN not only participates in insulin secretion but also controls protein folding and cell turnover by interacting with ubiquitin carboxyl‐terminal hydrolases.

- A, A1
Representative immunoblot showing Cy5‐labelled proteins (“total load”) complementing the analysis of p53 in Fig 7D and allowing quantitation by expression of fold changes vs. control.
- B–B2
siRNA‐mediated silencing of secretagogin expression results in the decreased number of proliferating (Ki67+) INS‐1E cells. Hoechst 33342 was used as a nuclear counterstain (pseudo‐coloured in red).
- C–C2
Simultaneously, secretagogin knock‐down increases the number of INS‐1E cells undergoing apoptosis (cleaved caspase 3+).
Similar articles
-
Secretagogin protects Pdx1 from proteasomal degradation to control a transcriptional program required for β cell specification.Mol Metab. 2018 Aug;14:108-120. doi: 10.1016/j.molmet.2018.05.019. Epub 2018 Jun 5. Mol Metab. 2018. PMID: 29910119 Free PMC article.
-
Secretagogin is increased in plasma from type 2 diabetes patients and potentially reflects stress and islet dysfunction.PLoS One. 2018 Apr 27;13(4):e0196601. doi: 10.1371/journal.pone.0196601. eCollection 2018. PLoS One. 2018. PMID: 29702679 Free PMC article.
-
Veiled Potential of Secretagogin in Diabetes: Correlation or Coincidence?Trends Endocrinol Metab. 2019 Apr;30(4):234-243. doi: 10.1016/j.tem.2019.01.007. Epub 2019 Feb 13. Trends Endocrinol Metab. 2019. PMID: 30772140 Review.
-
Secretagogin affects insulin secretion in pancreatic β-cells by regulating actin dynamics and focal adhesion.Biochem J. 2016 Jun 15;473(12):1791-803. doi: 10.1042/BCJ20160137. Epub 2016 Apr 19. Biochem J. 2016. PMID: 27095850 Free PMC article.
-
The renaissance of Ca2+-binding proteins in the nervous system: secretagogin takes center stage.Cell Signal. 2012 Feb;24(2):378-387. doi: 10.1016/j.cellsig.2011.09.028. Epub 2011 Oct 1. Cell Signal. 2012. PMID: 21982882 Free PMC article. Review.
Cited by
-
20 Years of Secretagogin: Exocytosis and Beyond.Front Mol Neurosci. 2019 Feb 12;12:29. doi: 10.3389/fnmol.2019.00029. eCollection 2019. Front Mol Neurosci. 2019. PMID: 30853888 Free PMC article.
-
Gene loci associated with insulin secretion in islets from non-diabetic mice.J Clin Invest. 2019 Jul 25;129(10):4419-4432. doi: 10.1172/JCI129143. J Clin Invest. 2019. PMID: 31343992 Free PMC article.
-
The core clock gene, Bmal1, and its downstream target, the SNARE regulatory protein secretagogin, are necessary for circadian secretion of glucagon-like peptide-1.Mol Metab. 2020 Jan;31:124-137. doi: 10.1016/j.molmet.2019.11.004. Epub 2019 Nov 21. Mol Metab. 2020. PMID: 31918914 Free PMC article.
-
A microRNA‑24‑to‑secretagogin regulatory pathway mediates cholesterol‑induced inhibition of insulin secretion.Int J Mol Med. 2019 Aug;44(2):608-616. doi: 10.3892/ijmm.2019.4224. Epub 2019 May 31. Int J Mol Med. 2019. PMID: 31173188 Free PMC article.
-
The downregulation of SCGN induced by lipotoxicity promotes NLRP3-mediated β-cell pyroptosis.Cell Death Discov. 2024 Jul 27;10(1):340. doi: 10.1038/s41420-024-02107-y. Cell Death Discov. 2024. PMID: 39068218 Free PMC article.
References
-
- Akiba Y, Kato S, Katsube K, Nakamura M, Takeuchi K, Ishii H, Hibi T (2004) Transient receptor potential vanilloid subfamily 1 expressed in pancreatic islet beta cells modulates insulin secretion in rats. Biochem Biophys Res Commun 321: 219–225 - PubMed
-
- Allen JR, Nguyen LX, Sargent KE, Lipson KL, Hackett A, Urano F (2004) High ER stress in beta‐cells stimulates intracellular degradation of misfolded insulin. Biochem Biophys Res Commun 324: 166–170 - PubMed
-
- Aradska J, Bulat T, Sialana FJ, Birner‐Gruenberger R, Erich B, Lubec G (2015) Gel‐free mass spectrometry analysis of Drosophila melanogaster heads. Proteomics 15: 3356–3360 - PubMed
-
- Araki E, Oyadomari S, Mori M (2003) Impact of endoplasmic reticulum stress pathway on pancreatic beta‐cells and diabetes mellitus. Exp Biol Med (Maywood) 228: 1213–1217 - PubMed
Publication types
MeSH terms
Substances
Grants and funding
LinkOut - more resources
Full Text Sources
Other Literature Sources
Molecular Biology Databases
Miscellaneous

