

Incidence and mortality due to snakebite in the Americas
- PMID: 28636631
- PMCID: PMC5495519
- DOI: 10.1371/journal.pntd.0005662
Incidence and mortality due to snakebite in the Americas
Abstract
Background: Better knowledge of the epidemiological characteristics of snakebites could help to take measures to improve their management. The incidence and mortality of snakebites in the Americas are most often estimated from medical and scientific literature, which generally lack precision and representativeness.
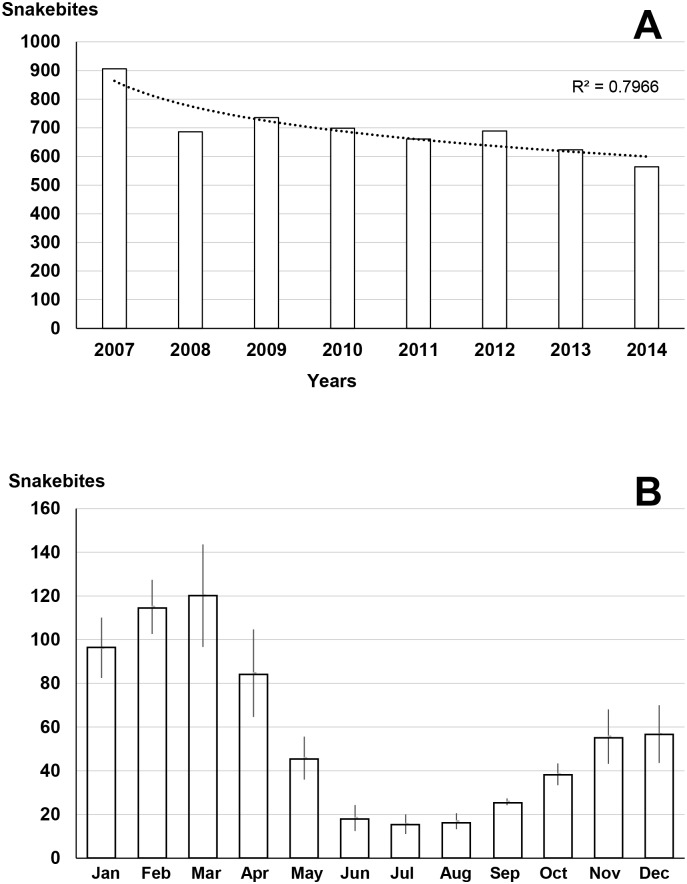
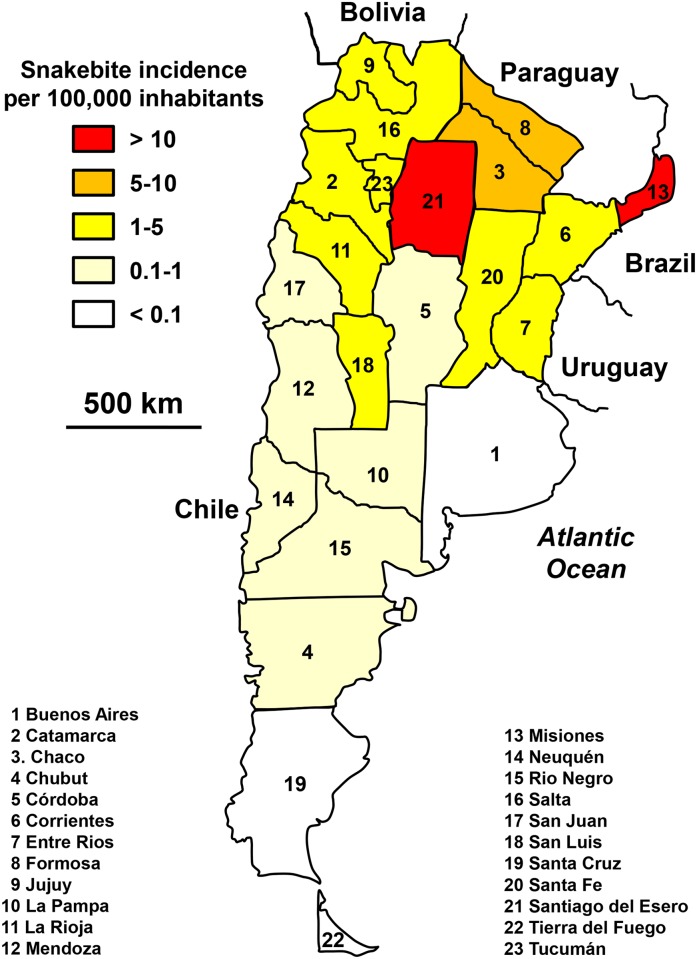
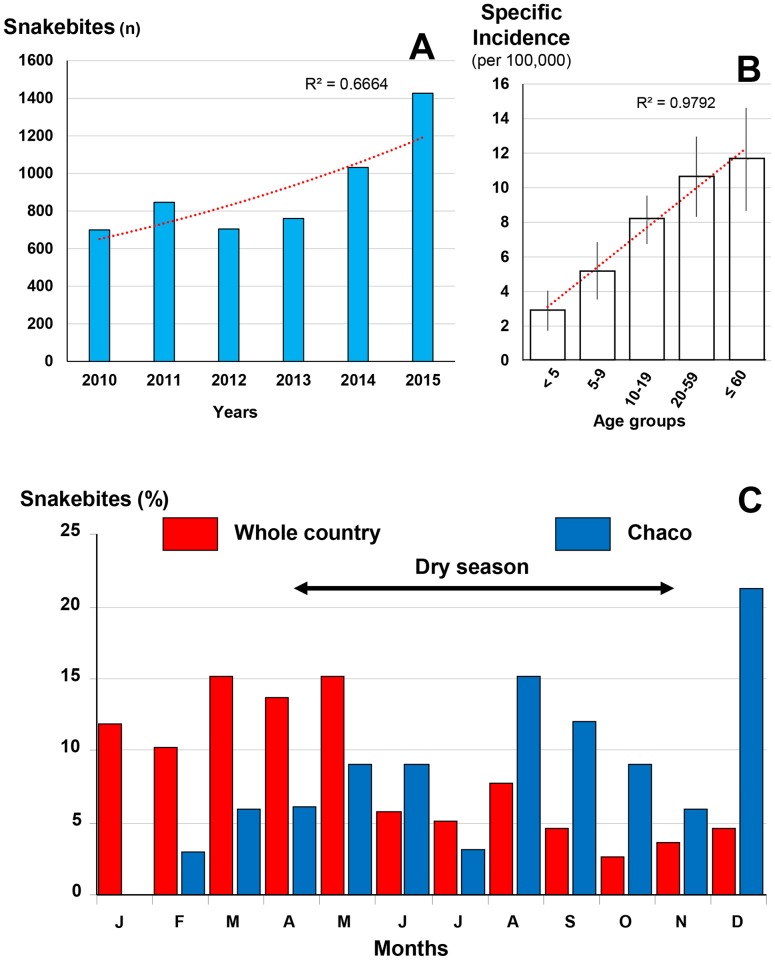
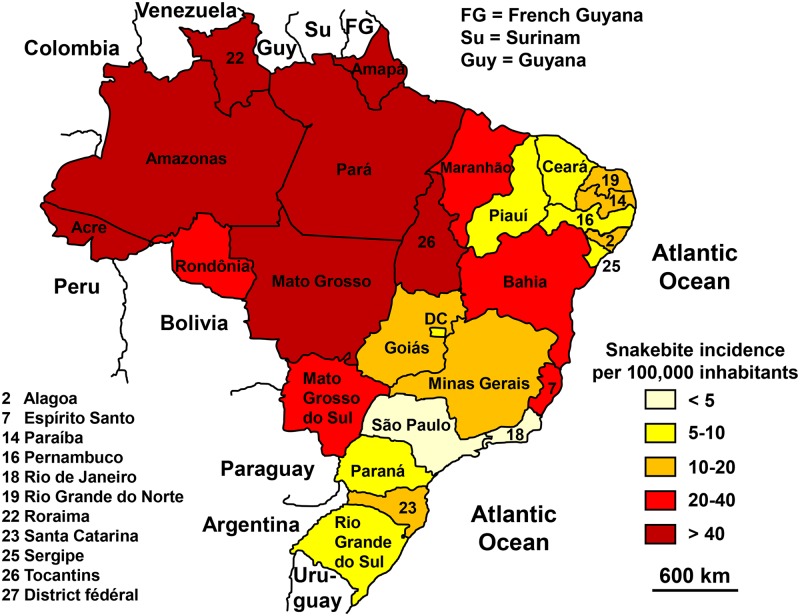
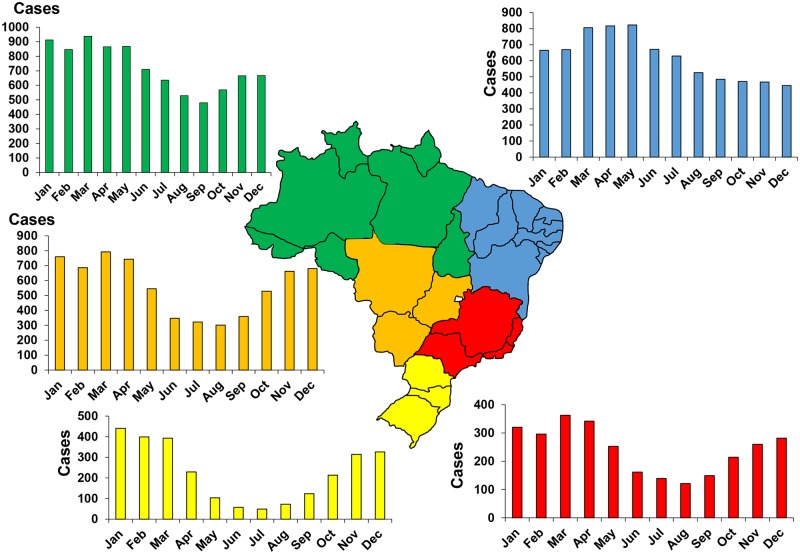
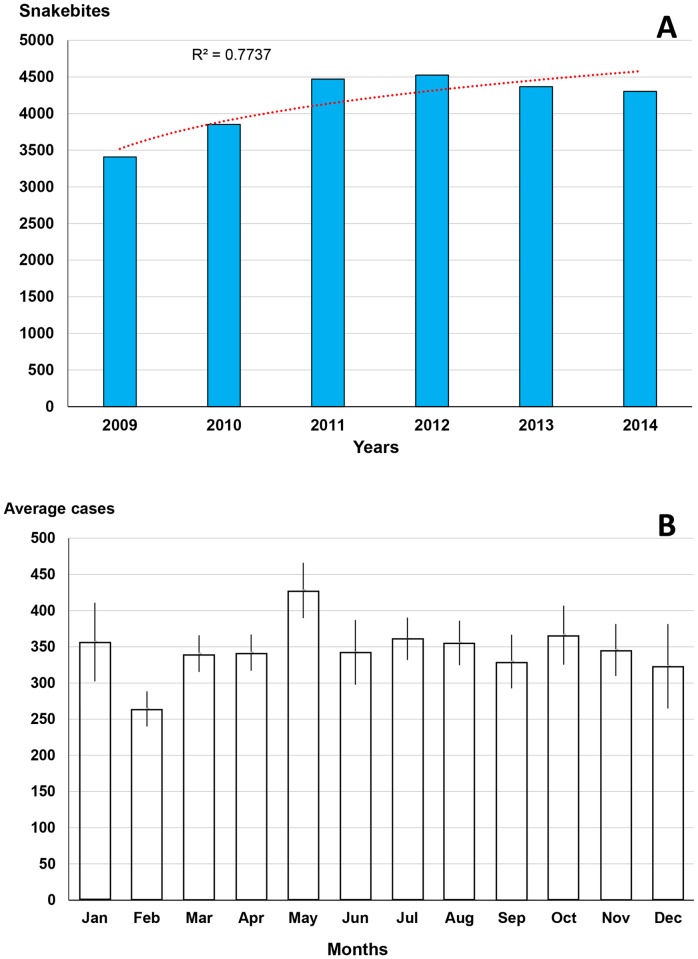
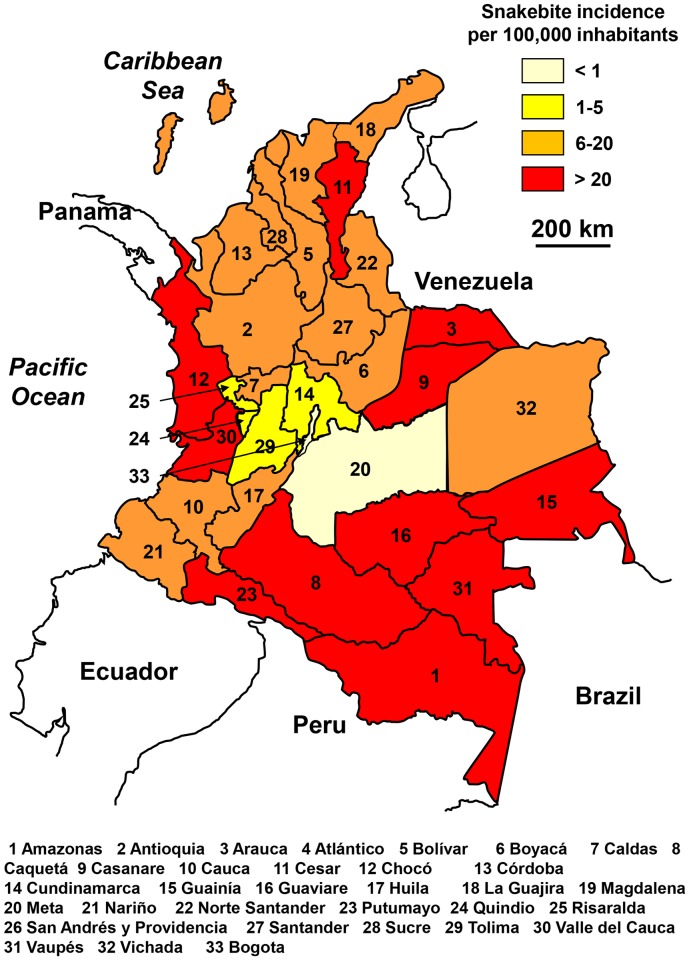
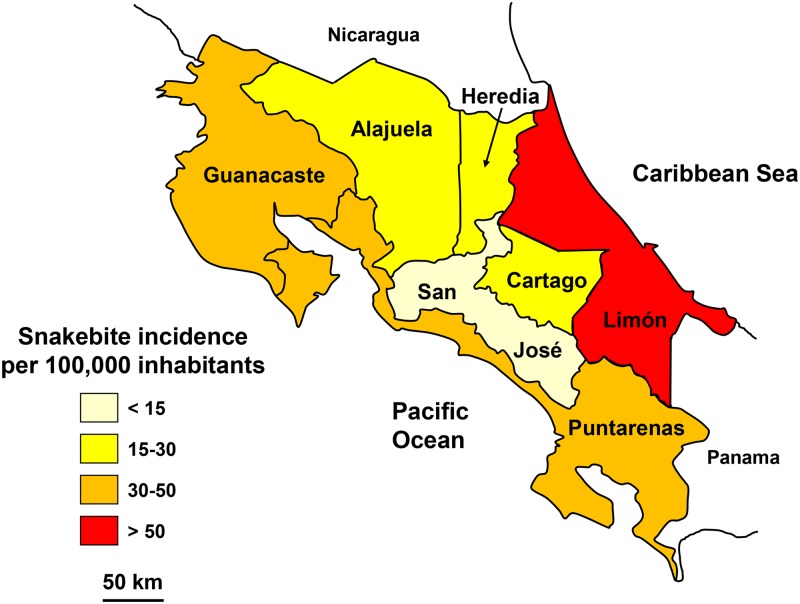
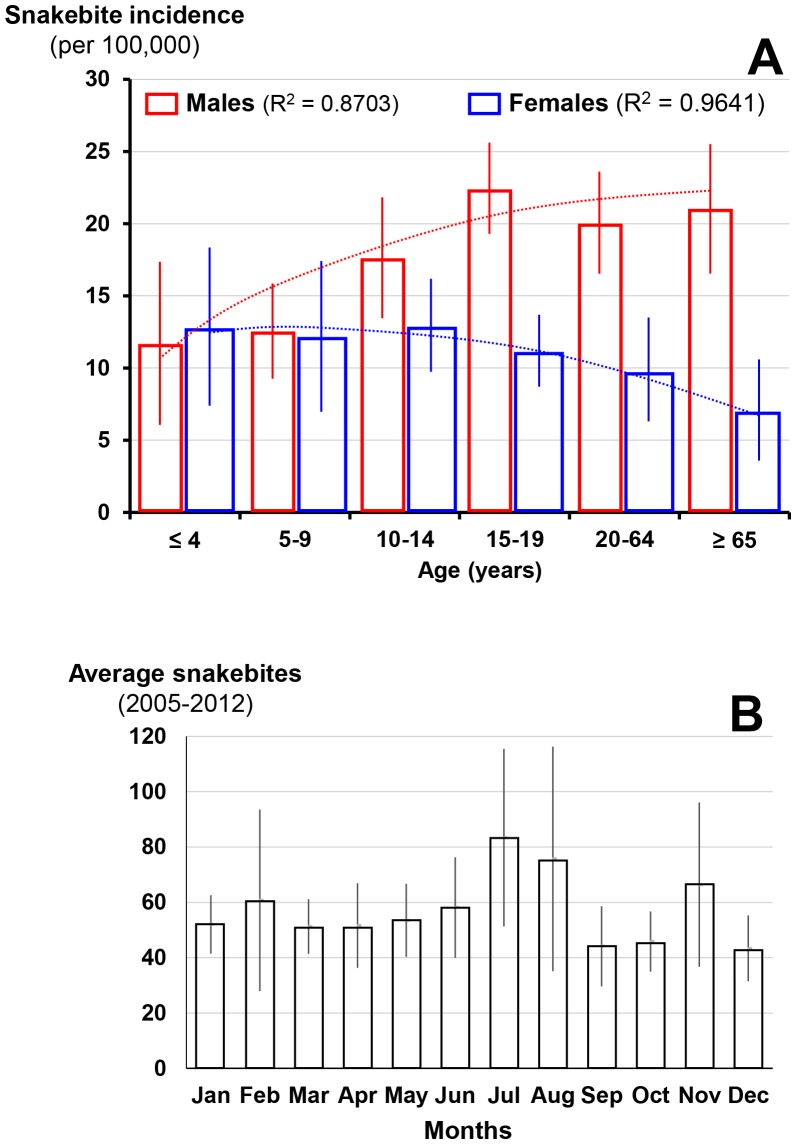
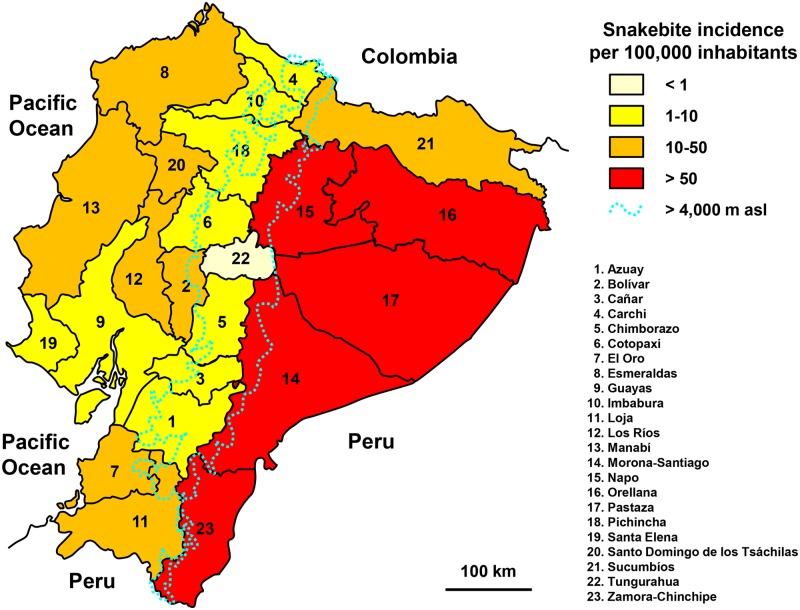
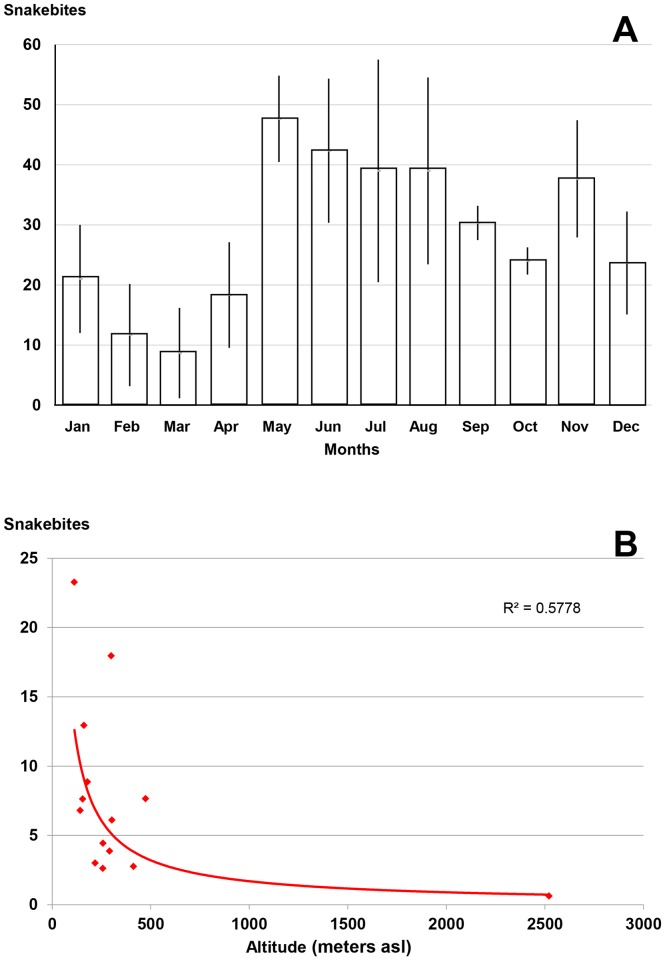
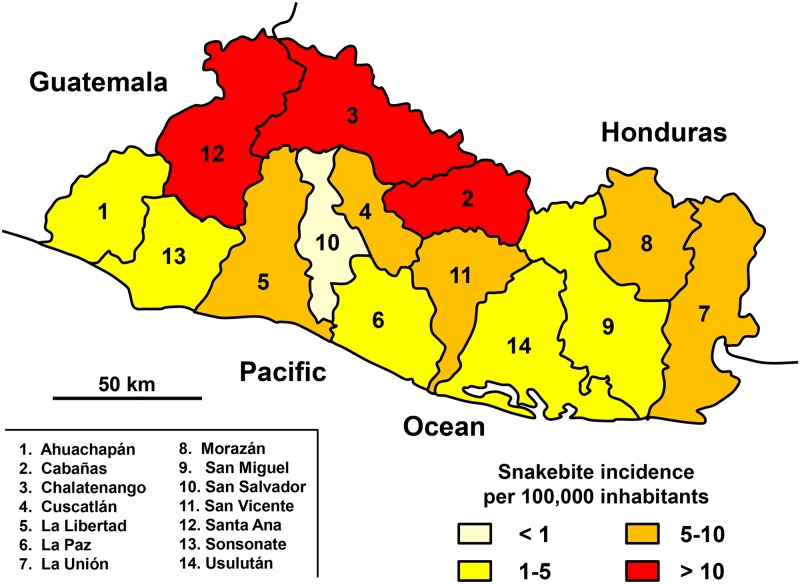
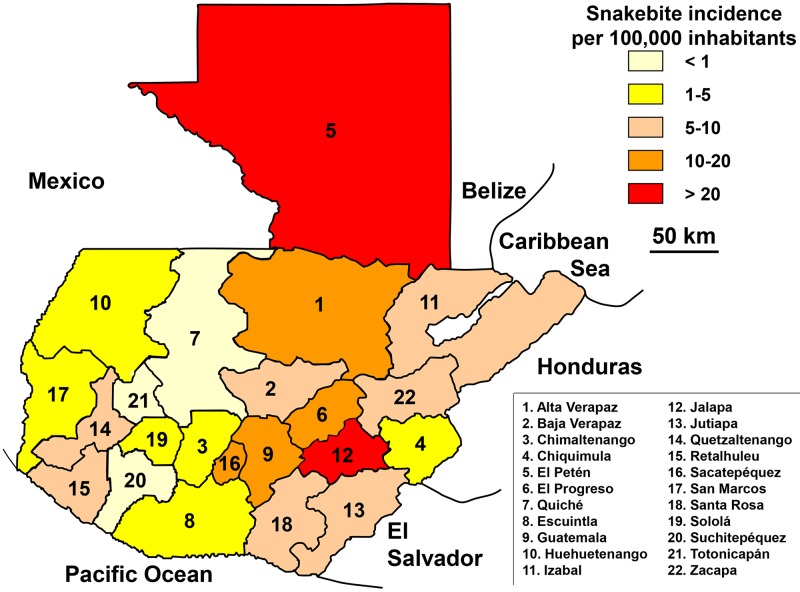
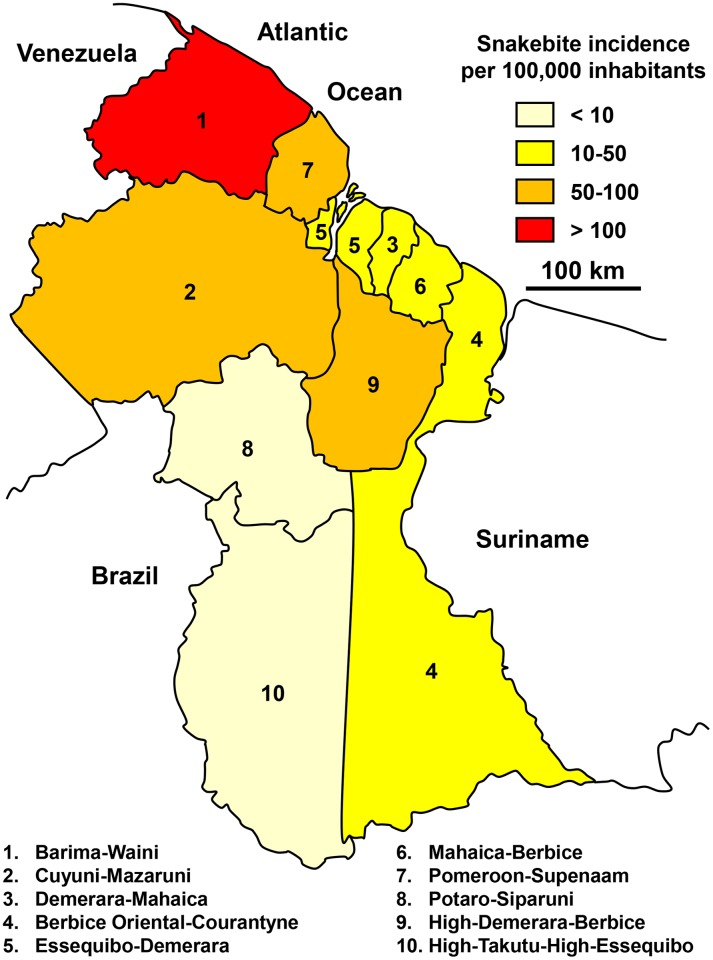
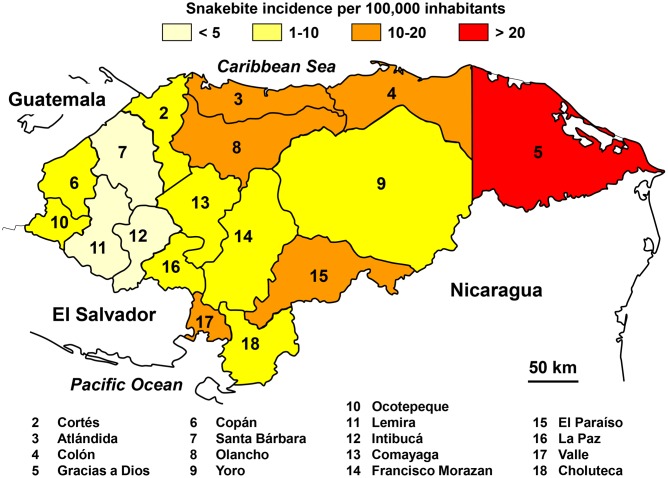
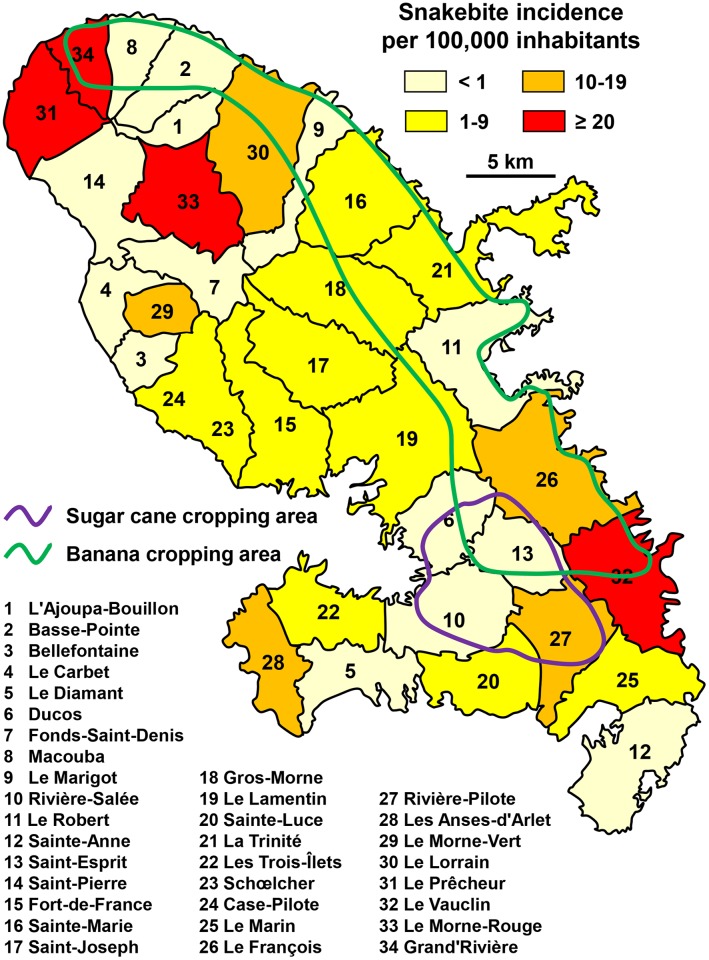
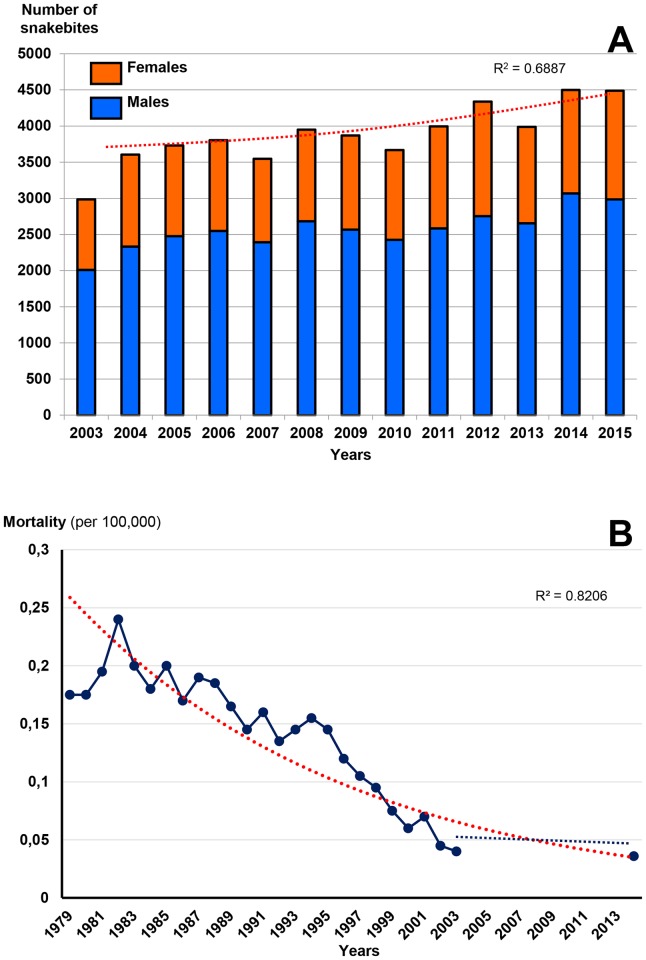
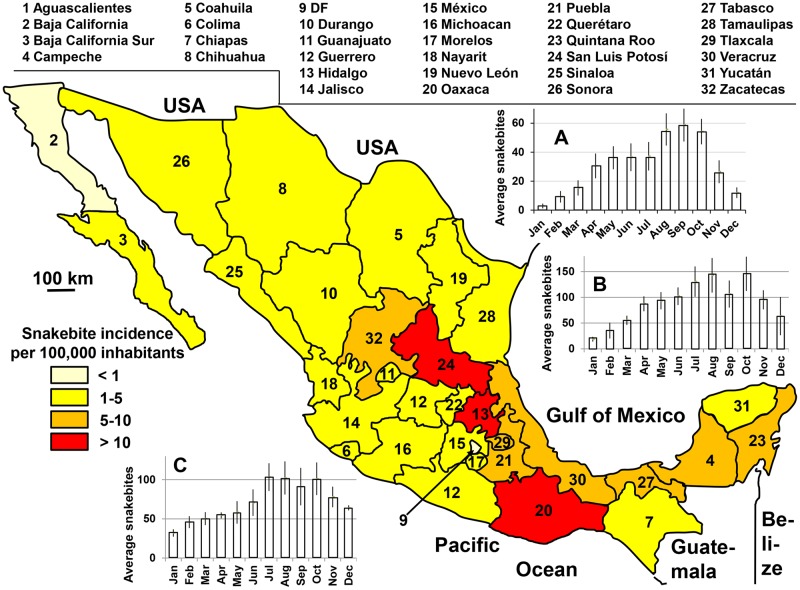
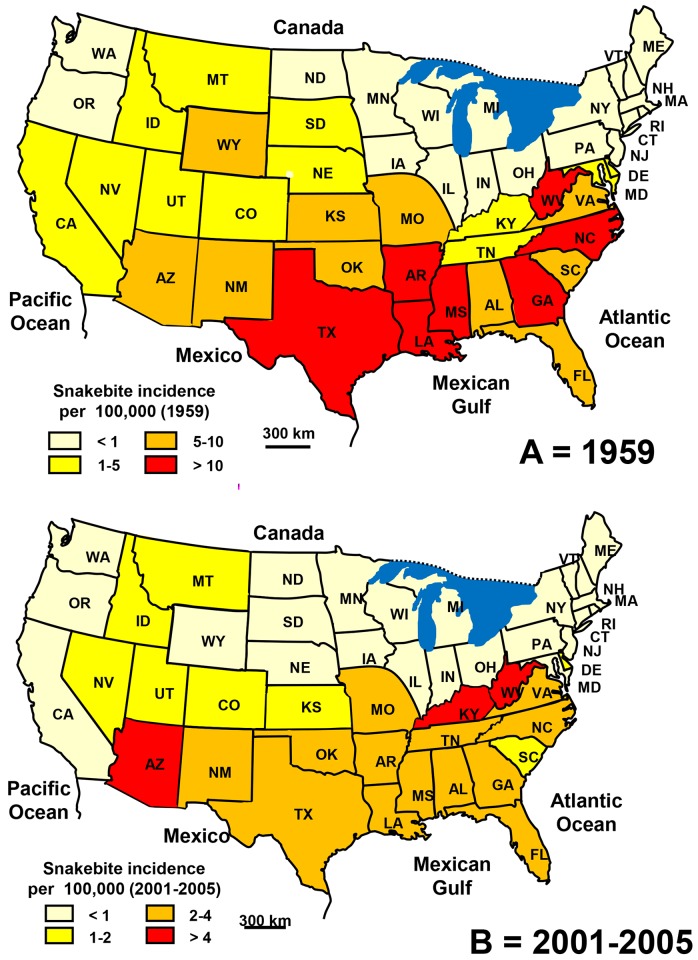
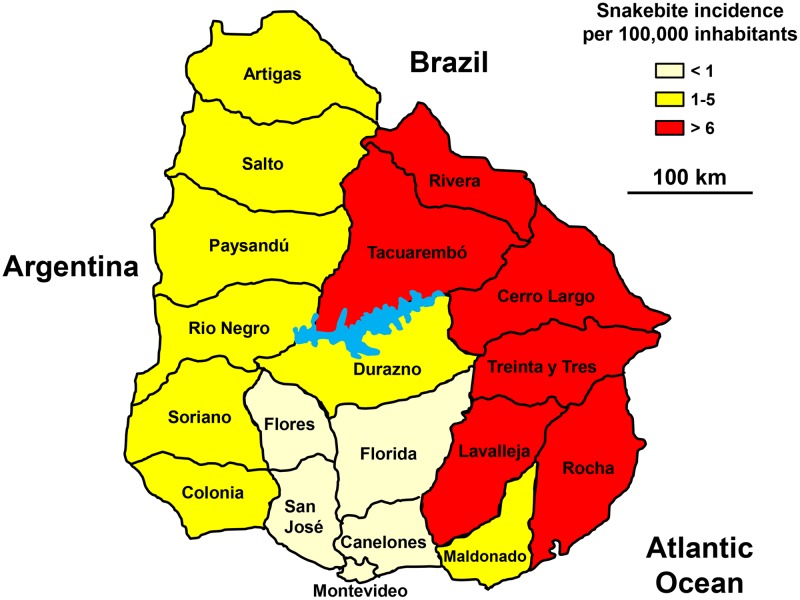
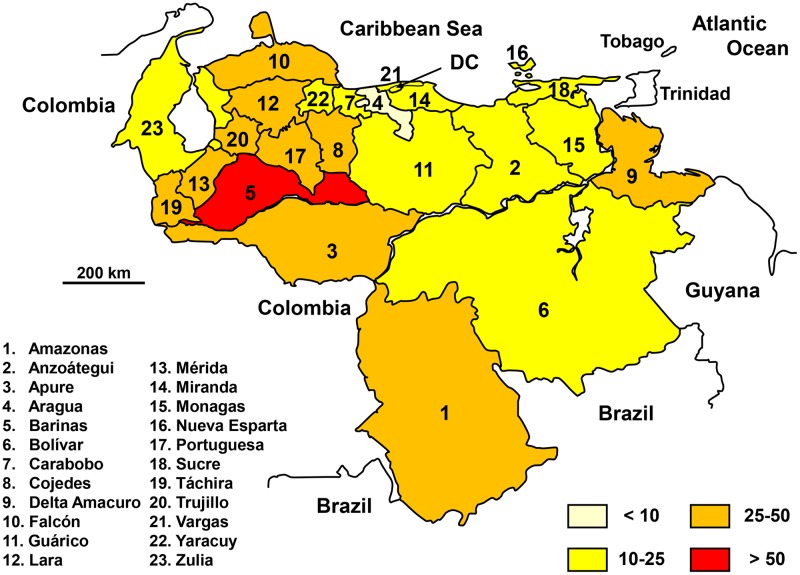
Methodology/principal findings: Authors used the notifications of snakebites treated in health centers collected by the Ministries of Health of the American countries to estimate their incidence and mortality. Data were obtained from official reports available on-line at government sites, including those of the Ministry of Health in each country and was sustained by recent literature obtained from PubMed. The average annual incidence is about 57,500 snake bites (6.2 per 100,000 population) and mortality is close to 370 deaths (0.04 per 100,000 population), that is, between one third and half of the previous estimates. The incidence of snakebites is influenced by the abundance of snakes, which is related to (i) climate and altitude, (ii) specific preferences of the snake for environments suitable for their development, and (iii) human population density. Recent literature allowed to notice that the severity of the bites depends mainly on (i) the snake responsible for the bite (species and size) and (ii) accessibility of health care, including availability of antivenoms.
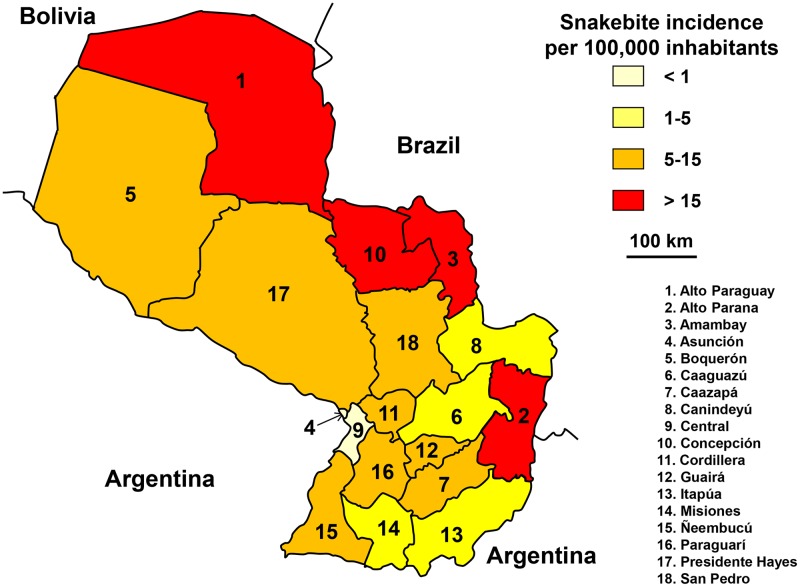
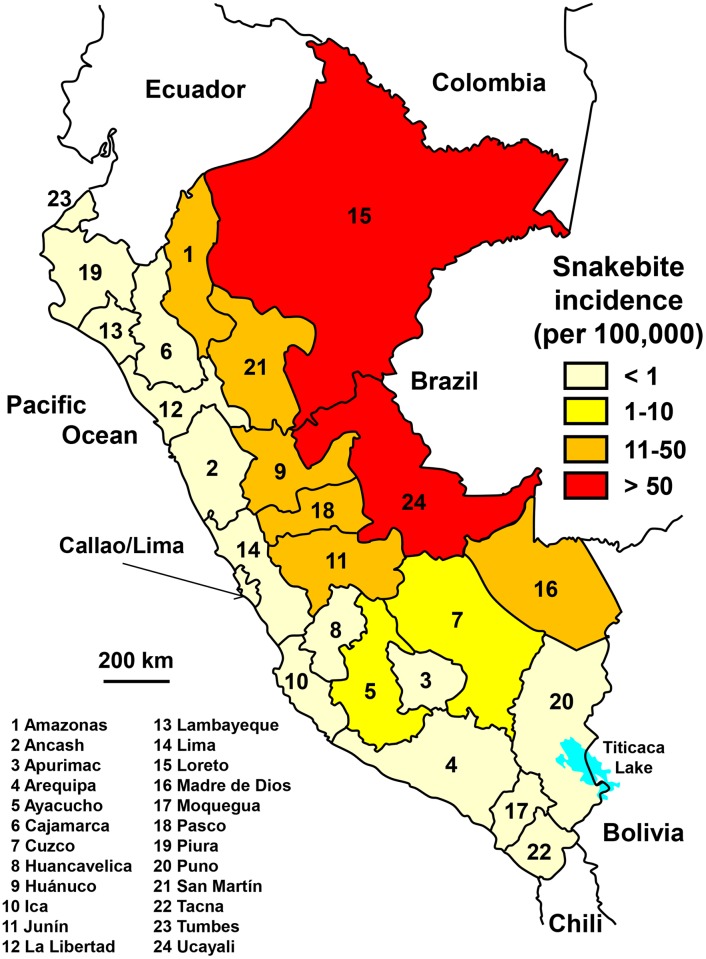
Conclusions/significances: The main limitation of this study could be the reliability and accuracy of the notifications by national health services. However, the data seemed consistent considering the similarity of the incidences on each side of national boundaries while the sources are distinct. However, snakebite incidence could be underestimated due to the use of traditional medicine by the patients who escaped the reporting of cases. However, gathered data corresponded to the actual use of the health facilities, and therefore to the actual demand for antivenoms, which should make it possible to improve their management.
Conflict of interest statement
I have no competing interest.
Figures
Similar articles
-
The global burden of snakebite: a literature analysis and modelling based on regional estimates of envenoming and deaths.PLoS Med. 2008 Nov 4;5(11):e218. doi: 10.1371/journal.pmed.0050218. PLoS Med. 2008. PMID: 18986210 Free PMC article.
-
Epidemiology of snakebite in Europe: comparison of data from the literature and case reporting.Toxicon. 2013 Dec 15;76:206-13. doi: 10.1016/j.toxicon.2013.10.004. Epub 2013 Oct 12. Toxicon. 2013. PMID: 24125660
-
Appraisal of snakebite incidence and mortality in Bolivia.Toxicon. 2014 Jun;84:28-35. doi: 10.1016/j.toxicon.2014.03.007. Epub 2014 Mar 27. Toxicon. 2014. PMID: 24680765
-
Epidemiology of snakebites in Europe: a systematic review of the literature.Toxicon. 2012 Jan;59(1):86-99. doi: 10.1016/j.toxicon.2011.10.008. Epub 2011 Oct 25. Toxicon. 2012. PMID: 22056768 Review.
-
Coral snake bites (Micrurus spp.) in Brazil: a review of literature reports.Clin Toxicol (Phila). 2016 Mar;54(3):222-34. doi: 10.3109/15563650.2015.1135337. Epub 2016 Jan 25. Clin Toxicol (Phila). 2016. PMID: 26808120 Review.
Cited by
-
Biochemical and immunochemical characterization of venoms from snakes of the genus Agkistrodon.Toxicon X. 2019 Aug 2;4:100013. doi: 10.1016/j.toxcx.2019.100013. eCollection 2019 Oct. Toxicon X. 2019. PMID: 32550570 Free PMC article.
-
Unveiling the Venom Composition of the Colombian Coral Snakes Micrurus helleri, M. medemi, and M. sangilensis.Toxins (Basel). 2023 Oct 24;15(11):622. doi: 10.3390/toxins15110622. Toxins (Basel). 2023. PMID: 37999485 Free PMC article.
-
Potential of Matrix Metalloproteinase Inhibitors for the Treatment of Local Tissue Damage Induced by a Type P-I Snake Venom Metalloproteinase.Toxins (Basel). 2019 Dec 20;12(1):8. doi: 10.3390/toxins12010008. Toxins (Basel). 2019. PMID: 31861940 Free PMC article.
-
Philodryas (Serpentes: Dipsadidae) Envenomation, a Neglected Issue in Chile.Toxins (Basel). 2019 Nov 29;11(12):697. doi: 10.3390/toxins11120697. Toxins (Basel). 2019. PMID: 31795440 Free PMC article. Review.
-
Mortality, hospital admission, and healthcare cost due to injury from venomous and non-venomous animal encounters in the USA: 5-year analysis of the National Emergency Department Sample.Trauma Surg Acute Care Open. 2018 Dec 11;3(1):e000250. doi: 10.1136/tsaco-2018-000250. eCollection 2018. Trauma Surg Acute Care Open. 2018. PMID: 30623028 Free PMC article.
References
-
- Kasturiratne A, Wickremasinghe AR, de Silva N, Gunawardena NK, Pathmeswaran A, Premaratna R, Savioli L, Lalloo DG, de Silva HJ. The global burden of snakebite: a literature analysis and modelling based on regional estimates of envenoming and deaths. PLoS Med. 2008;5(11):e218 doi: 10.1371/journal.pmed.0050218 - DOI - PMC - PubMed
-
- Chippaux JP. Estimating the global burden of snakebite can help to improve management. PLoS Med. 2008;5(11):e221 doi: 10.1371/journal.pmed.0050221 - DOI - PMC - PubMed
-
- Gutiérrez JM, Higashi HG, Wen FH, Burnouf T. Strengthening antivenom production in Central and South American public laboratories: report of a workshop. Toxicon. 2007;49(1):30–5. doi: 10.1016/j.toxicon.2006.09.005 - DOI - PubMed
-
- Gutiérrez JM, Fan HW, Silvera CL, Angulo Y. Stability, distribution and use of antivenoms for snakebite envenomation in Latin America: report of a workshop. Toxicon. 2009;53(6):625–30. doi: 10.1016/j.toxicon.2009.01.020 - DOI - PubMed
MeSH terms
Grants and funding
LinkOut - more resources
Full Text Sources
Other Literature Sources
