. 2017 Jun 29;546(7660):646-650.
doi: 10.1038/nature22975. Epub 2017 Jun 21.

Host and viral traits predict zoonotic spillover from mammals

Affiliations

Host and viral traits predict zoonotic spillover from mammals

Kevin J Olival et al. Nature. .

Erratum in

Abstract

The majority of human emerging infectious diseases are zoonotic, with viruses that originate in wild mammals of particular concern (for example, HIV, Ebola and SARS). Understanding patterns of viral diversity in wildlife and determinants of successful cross-species transmission, or spillover, are therefore key goals for pandemic surveillance programs. However, few analytical tools exist to identify which host species are likely to harbour the next human virus, or which viruses can cross species boundaries. Here we conduct a comprehensive analysis of mammalian host-virus relationships and show that both the total number of viruses that infect a given species and the proportion likely to be zoonotic are predictable. After controlling for research effort, the proportion of zoonotic viruses per species is predicted by phylogenetic relatedness to humans, host taxonomy and human population within a species range-which may reflect human-wildlife contact. We demonstrate that bats harbour a significantly higher proportion of zoonotic viruses than all other mammalian orders. We also identify the taxa and geographic regions with the largest estimated number of 'missing viruses' and 'missing zoonoses' and therefore of highest value for future surveillance. We then show that phylogenetic host breadth and other viral traits are significant predictors of zoonotic potential, providing a novel framework to assess if a newly discovered mammalian virus could infect people.


Conflict of interest statement

The authors declare no competing financial interests.

Figures

Figure 1
Figure 1. Observed viral richness in mammals.
a, b, Box plots of proportion of zoonotic viruses (a) and total viral richness per species (b), aggregated by order. Data points represent wild (light grey, n = 721) and domestic (dark red, n = 32) mammal species; lines represent median, boxes, interquartile range. Animal silhouettes from PhyloPic. Data based on 2,805 host–virus associations. See Methods for image credits and licensing. PowerPoint slide
Figure 2
Figure 2. Host traits that predict total viral richness (top row) and proportion of zoonotic viruses (bottom row) per wild mammal species.
Partial effect plots show the relative effect of each variable included in the best-fit GAM, given the effect of the other variables. Shaded circles represent partial residuals; shaded areas, 95% confidence intervals around mean partial effect. ae, Best model for total viral richness includes: a, number of disease-related citations per host species (research effort, log); b, phylogenetic eigenvector regression (PVR) of body mass (log); c, geographic range area of each species (log km2); d, number of sympatric mammal species overlapping with at least 20% area of target species range; and e, mammalian orders. fi, Best model for proportion of zoonoses includes: f, research effort (log); g, phylogenetic distance from humans (cytochrome b tree constrained to the topology of the mammal supertree); h, ratio of urban to rural human population within species range; and i, three mammalian orders. Bats are the only order with a significantly larger proportion of zoonotic viruses than would be predicted by the other variables in the all-data model. Three additional mammalian orders, and whether or not a species is hunted, improved the overall predictive power of the best zoonotic virus model but were non-significant and are not shown (see Extended Data Table 1). PowerPoint slide
Figure 3
Figure 3. Global distribution of the predicted number of ‘missing zoonoses’ by order.
Warmer colours highlight areas predicted to be of greatest value for discovering novel zoonotic viruses. a, All wild mammals (n = 584 spp. included in the best-fit model). b, Carnivores (order Carnivora, n = 55). c, Even-toed ungulates (order Cetartiodactyla, n = 70). d, Bats (order Chiroptera, n = 157). e, Primates (order Primates, n = 73). f, Rodents (order Rodentia, n = 183). Hatched regions represent areas where model predictions deviate systematically for the assemblage of species in that grid cell (approximately 18 km × 18 km, see Methods). Animal silhouettes from PhyloPic. PowerPoint slide
Figure 4
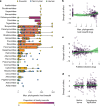
Figure 4. Traits that predict zoonotic potential of a virus.
a, Box plot of maximum phylogenetic host breadth per virus (PHB, see methods) for each of 586 mammalian viruses, aggregated by 28 viral families. Individual points represent viral species, colour-coded by zoonotic status. Box plots coloured and sorted by the proportion of zoonoses in each viral family. bd, Partial effect plots for the best-fit GAM to predict the zoonotic potential of a virus. b, Maximum PHB. Viruses that infect a phylogenetically broader range of hosts are more likely to be zoonotic. c, Research effort (log, number of PubMed citations per viral species). d, Whether or not a virus replicates in the cytoplasm or is vector-borne. Viral genome length and whether or not a virus is enveloped improved the overall predictive power but were non-significant and are not shown (see Extended Data Table 1). PowerPoint slide
Extended Data Figure 1
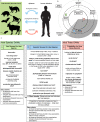
Extended Data Figure 1. Conceptual model of zoonotic spillover, viral richness, and summary of models.
a, Conceptual model of zoonotic spillover showing primary risk factors examined, colour-coded according to generalized additive models used. b, Conceptual model of observed, predicted, and actual viral richness in mammals. c, GAMs used in our study to address specific components of a and b, colour-coded by model. Variables listed with ‘or’ under each GAM covaried and were provided as competing terms in model selection, and those in bold were included in the best-fit model using all host–virus associations. Significant variables from each best-fit GAM are noted with an asterisk. Zoonotic viral spillover first depends on the underlying total viral richness in mammal populations and the ecological, taxonomic, and life-history traits that govern this diversity (GAM 1). Second, host- and virus-specific factors may facilitate viral spillover. We examine the relative importance of host phylogenetic distance to humans, ecological opportunity for contact, or other species-specific life-history and taxonomic traits (GAM 2), and identify viral traits associated with a higher likelihood of an observed virus being zoonotic (GAM 3). We estimate the total and zoonotic viral richness per host species using GAMs 1 and 2, and calculate the missing viruses and missing zoonoses under a scenario of increased research effort (b, Methods). Owing to imperfect surveillance in both humans and wildlife and biases in viral detection, there may be uncertainty in the exact proportion of viruses that are zoonotic (b, light grey), and also between the actual, or true, viral richness (dotted lines) and the predicted maximum viral richness per host (dashed line).
Extended Data Figure 2
Extended Data Figure 2. Heat map of observed total viral richness by mammalian order and viral family.
Dataset includes 754 mammalian species and 586 unique ICTV recognized viral species. Heat map aggregated by rows and columns to group taxa with similar levels of observed viral richness.
Extended Data Figure 3
Extended Data Figure 3. Global distribution of viral and host species richness for all wild mammals.
a, Observed total viral richness (for n = 576 host spp.); b, predicted total viral richness given maximum research effort; c, missing viruses or predicted minus observed total viral richness; d, observed zoonotic viral richness (n = 584); e, predicted zoonotic viral richness given maximum research effort; f, missing zoonoses or predicted minus observed zoonotic viral richness (same as included in Fig. 3a); g, global mammal species richness (n = 5,290); h, mammal richness for species in our database (n = 753); i, mammal species with no described viruses in the literature. Warmer colours (larger values) in panels c and f highlight areas predicted to be of greatest value for discovering novel viruses or novel viral zoonoses, respectively, in mammals. Red/pink colours in panel i highlight areas with poor viral surveillance in mammal species to date. Hatched regions represent areas where model predictions deviate systematically for the collection of species in that grid cell (see Methods).
Extended Data Figure 4
Extended Data Figure 4. Global distribution of viral and host species richness for wild carnivores (order Carnivora).
a, Observed total viral richness (for n = 55 host spp.); b, predicted total viral richness given maximum research effort; c, missing viruses or predicted minus observed total viral richness; d, observed zoonotic viral richness (n = 55); e, predicted zoonotic viral richness given maximum research effort; f, missing zoonoses or predicted minus observed zoonotic viral richness (same as included in Fig. 3b); g, global host species richness for Carnivora (n = 276); h, host species richness for Carnivora in our database (n = 79); i, species of the order Carnivora with no described viruses in the literature. Warmer colours (larger values) in c and f highlight areas predicted to be of greatest value for discovering novel viruses or novel viral zoonoses, respectively, in carnivores. Red/pink colours in panel i highlight areas with poor viral surveillance in carnivore species to date. Hatched regions represent areas where model predictions deviate systematically for the collection of species in that grid cell (see Methods).
Extended Data Figure 5
Extended Data Figure 5. Global distribution of viral and host species richness for wild even-toed ungulates (order Cetartiodactyla).
a, Observed total viral richness (for n = 70 host spp.); b, predicted total viral richness given maximum research effort; c, missing viruses or predicted minus observed total viral richness; d, observed zoonotic viral richness (n = 70); e, predicted zoonotic viral richness given maximum research effort; f, missing zoonoses or predicted minus observed zoonotic viral richness (same as included in Fig. 3c); g, global host species richness for Cetartiodactyla (n = 229); h, host species richness for Cetartiodactyla in our database (n = 105); i, species of the order Cetartiodactyla with no described viruses in the literature. Warmer colours (larger values) in c and f highlight areas predicted to be of greatest value for discovering novel viruses or novel viral zoonoses, respectively, in even-toed ungulates. Red/pink colours in panel i highlight areas with poor viral surveillance in even-toed ungulates species to date. Hatched regions represent areas where model predictions deviate systematically for the collection of species in that grid cell (see Methods).
Extended Data Figure 6
Extended Data Figure 6. Global distribution of viral and host species richness for bats (order Chiroptera).
a, Observed total viral richness (for n = 156 host spp.); b, predicted total viral richness given maximum research effort; c, missing viruses or predicted minus observed total viral richness; d, observed zoonotic viral richness (n = 157); e, predicted zoonotic viral richness given maximum research effort; f, missing zoonoses or predicted minus observed zoonotic viral richness (same as included in Fig. 3d); g, global host species richness for Chiroptera (n = 1117); h, host species richness for Chiroptera in our database (n = 192); i, species of the order Chiroptera with no described viruses in the literature. Warmer colours (larger values) in c and f highlight areas predicted to be of greatest value for discovering novel viruses or novel viral zoonoses, respectively, in bats. Red/pink colours in panel i highlight areas with poor viral surveillance in bat species to date. Hatched regions represent areas where model predictions deviate systematically for the collection of species in that grid cell (see Methods).
Extended Data Figure 7
Extended Data Figure 7. Global distribution of viral and host species richness for primates (order Primates).
a, Observed total viral richness (for n = 71 host spp.); b, predicted total viral richness given maximum research effort; c, missing viruses or predicted minus observed total viral richness; d, observed zoonotic viral richness (n = 73); e, predicted zoonotic viral richness given maximum research effort; f, missing zoonoses or predicted minus observed zoonotic viral richness (same as included in Fig. 3e); g, global host species richness for Primates (n = 400); h, host species richness for Primates in our database (n = 98); i, primate species with no described viruses in the literature. Warmer colours (larger values) in c and f highlight areas predicted to be of greatest value for discovering novel viruses or novel viral zoonoses, respectively, in primates. Red/pink colours in panel i highlight areas with poor viral surveillance in primate species to date. Hatched regions represent areas where model predictions deviate systematically for the collection of species in that grid cell (see Methods).
Extended Data Figure 8
Extended Data Figure 8. Global distribution of viral and host species richness for rodents (order Rodentia).
a, Observed total viral richness (for n = 178 host spp.); b, predicted total viral richness given maximum research effort; c, missing viruses or predicted minus observed total viral richness; d, observed zoonotic viral richness (n = 183); e, predicted zoonotic viral richness given maximum research effort; f, missing zoonoses or predicted minus observed zoonotic viral richness (same as included in Fig. 3f); g, global host species richness for Rodentia (n = 2206); h, host species richness for Rodentia in our database (n = 221); i, rodent species with no described viruses in the literature. Warmer colours (larger values) in c and f highlight areas predicted to be of greatest value for discovering novel viruses or novel viral zoonoses, respectively, in wild rodents. Red/pink colours in panel i highlight areas with poor viral surveillance in rodent species to date. Hatched regions represent areas where model predictions deviate systematically for the collection of species in that grid cell (see Methods).
Extended Data Figure 9
Extended Data Figure 9. Order-level phylogenies showing residuals from zoonoses model.
ae, Subtrees from cytochrome b maximum likelihood phylogeny for 558 mammal species (constrained to order-level topology of mammal supertree) for bats (a), carnivores (b), even-toed ungulates (c), rodents (d) and primates (e). Species included have at least one described virus association and available genetic data. Wildlife species names and terminal branches are colour-coded by the residuals (predicted minus observed) from the best-fit GAM to predict the number of zoonotic viruses using all data. Species with residual values between −1 and 1 (black) are accurately predicted within one virus. Warm colours represent species with positive residuals (orange >1 to 3; red >3). Cool colours represent species with negative residuals (green <−1 to −3; blue <−3). Marine mammals, domestic animals, and species with missing data and not included in the best-fit models are shown in grey.

Comment in

Similar articles

Cited by

References

    1. Woolhouse MEJ, Gowtage-Sequeria S. Host range and emerging and reemerging pathogens. Emerg. Infect. Dis. 2005;11:1842–1847. doi: 10.3201/eid1112.050997. - DOI - PMC - PubMed
    1. Jones KE, et al. Global trends in emerging infectious diseases. Nature. 2008;451:990–993. doi: 10.1038/nature06536. - DOI - PMC - PubMed
    1. Taylor LH, Latham SM, Woolhouse MEJ. Risk factors for human disease emergence. Phil. Trans. R. Soc. Lond. B. 2001;356:983–989. doi: 10.1098/rstb.2001.0888. - DOI - PMC - PubMed
    1. Morse SS, et al. Prediction and prevention of the next pandemic zoonosis. Lancet. 2012;380:1956–1965. doi: 10.1016/S0140-6736(12)61684-5. - DOI - PMC - PubMed
    1. Parrish CR, et al. Cross-species virus transmission and the emergence of new epidemic diseases. Microbiol. Mol. Biol. Rev. 2008;72:457–470. doi: 10.1128/MMBR.00004-08. - DOI - PMC - PubMed

Publication types