

mTOR signaling mediates resistance to tankyrase inhibitors in Wnt-driven colorectal cancer
- PMID: 28615517
- PMCID: PMC5564614
- DOI: 10.18632/oncotarget.18146
mTOR signaling mediates resistance to tankyrase inhibitors in Wnt-driven colorectal cancer
Abstract
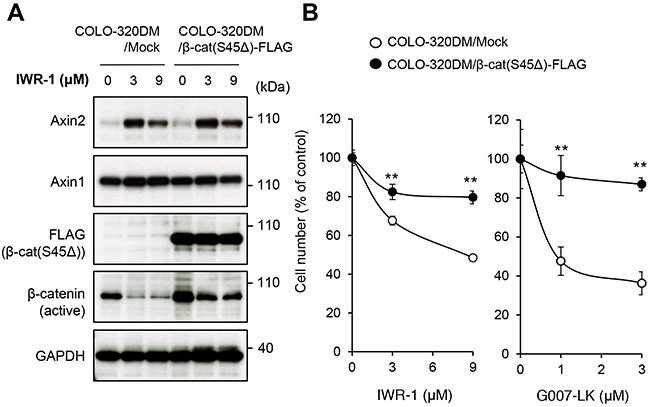
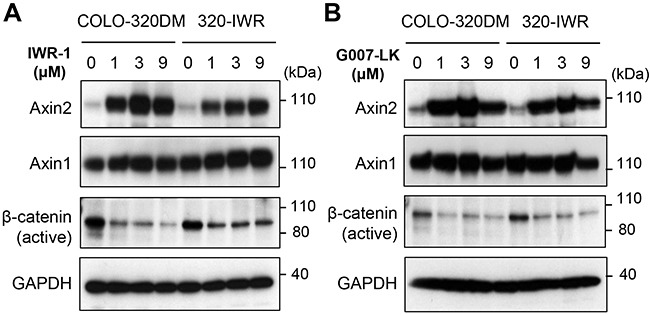
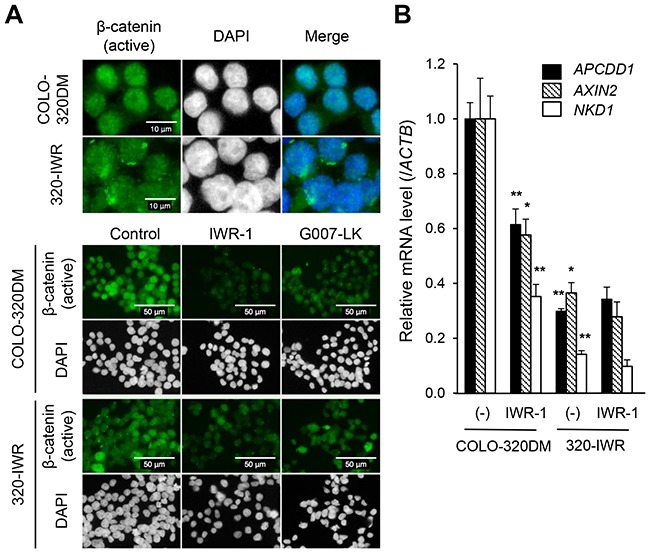
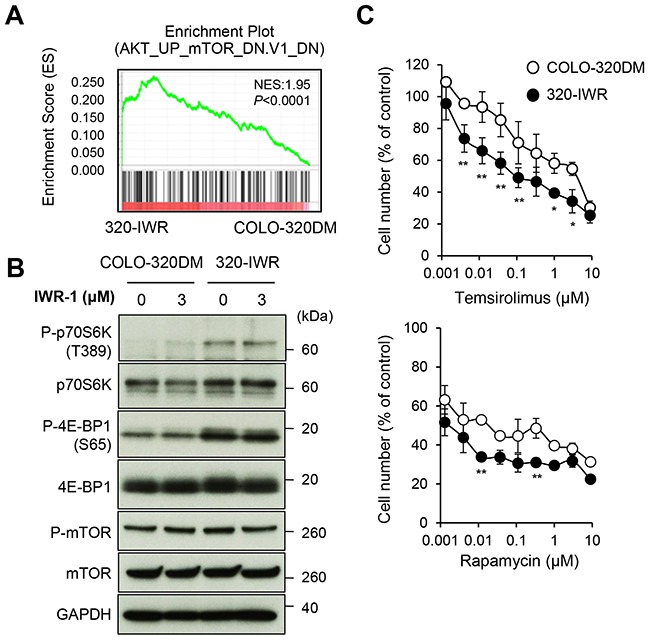
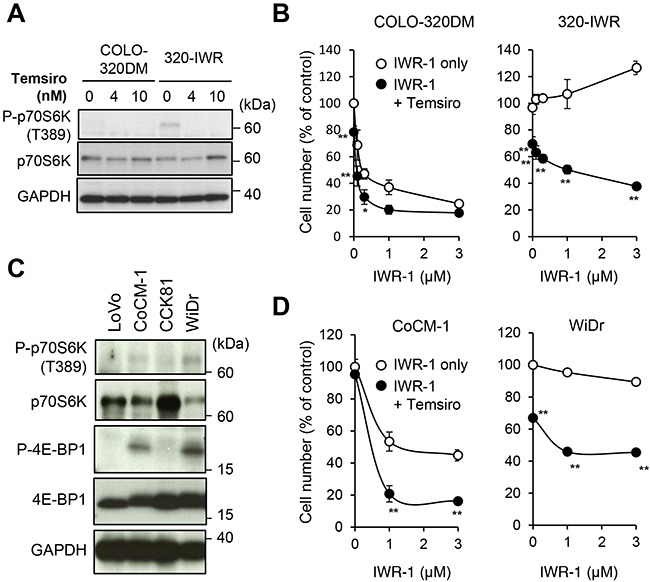
Activation of Wnt/β-catenin signaling is essential for colorectal carcinogenesis. Tankyrase, a member of the poly(ADP-ribose) polymerase (PARP) family, is a positive regulator of the Wnt/β-catenin signaling. Accordingly, tankyrase inhibitors are under preclinical development for colorectal cancer (CRC) therapy. However, Wnt-driven colorectal cancer cells are not equally sensitive to tankyrase inhibitors, and cellular factors that affect tankyrase inhibitor sensitivity remain elusive. Here, we established a tankyrase inhibitor-resistant cell line, 320-IWR, from Wnt/β-catenin-dependent CRC COLO-320DM cells. 320-IWR cells exhibited resistance to tankyrase inhibitors, IWR-1 and G007-LK, but remained sensitive to a PARP-1/2 inhibitor, olaparib, and several anti-CRC agents. In 320-IWR cells, nuclear localization of active β-catenin was decreased and expression of β-catenin target genes was constitutively repressed, suggesting that these cells repressed the Wnt/β-catenin signaling and were dependent on alternative proliferation pathways. 320-IWR cells exhibited upregulated mTOR signaling and were more sensitive to mTOR inhibition than the parental cells. Importantly, mTOR inhibition reversed resistance to tankyrase inhibitors and potentiated their anti-proliferative effects in 320-IWR cells as well as in CRC cell lines in which the mTOR pathway was intrinsically activated. These results indicate that mTOR signaling confers resistance to tankyrase inhibitors in CRC cells and suggest that the combination of tankyrase and mTOR inhibitors would be a useful therapeutic approach for a subset of CRCs.
Keywords: Wnt; colorectal cancer; mTOR; resistance; tankyrase.
Conflict of interest statement
The authors declare no conflicts of interest.
Figures

Similar articles
-
Regulation of Wnt/β-catenin signalling by tankyrase-dependent poly(ADP-ribosyl)ation and scaffolding.Br J Pharmacol. 2017 Dec;174(24):4611-4636. doi: 10.1111/bph.14038. Epub 2017 Nov 5. Br J Pharmacol. 2017. PMID: 28910490 Free PMC article. Review.
-
A novel tankyrase small-molecule inhibitor suppresses APC mutation-driven colorectal tumor growth.Cancer Res. 2013 May 15;73(10):3132-44. doi: 10.1158/0008-5472.CAN-12-4562. Epub 2013 Mar 28. Cancer Res. 2013. PMID: 23539443
-
Tankyrase Inhibition Blocks Wnt/β-Catenin Pathway and Reverts Resistance to PI3K and AKT Inhibitors in the Treatment of Colorectal Cancer.Clin Cancer Res. 2016 Feb 1;22(3):644-56. doi: 10.1158/1078-0432.CCR-14-3081. Epub 2015 Jul 29. Clin Cancer Res. 2016. PMID: 26224873
-
RK-287107, a potent and specific tankyrase inhibitor, blocks colorectal cancer cell growth in a preclinical model.Cancer Sci. 2018 Dec;109(12):4003-4014. doi: 10.1111/cas.13805. Epub 2018 Oct 20. Cancer Sci. 2018. PMID: 30238564 Free PMC article.
-
Tankyrase inhibitors as antitumor agents: a patent update (2013 - 2020).Expert Opin Ther Pat. 2021 Jul;31(7):645-661. doi: 10.1080/13543776.2021.1888929. Epub 2021 Mar 2. Expert Opin Ther Pat. 2021. PMID: 33567917 Review.
Cited by
-
Optimized base editors enable efficient editing in cells, organoids and mice.Nat Biotechnol. 2018 Oct;36(9):888-893. doi: 10.1038/nbt.4194. Epub 2018 Jul 3. Nat Biotechnol. 2018. PMID: 29969439 Free PMC article.
-
Regulation of Wnt/β-catenin signalling by tankyrase-dependent poly(ADP-ribosyl)ation and scaffolding.Br J Pharmacol. 2017 Dec;174(24):4611-4636. doi: 10.1111/bph.14038. Epub 2017 Nov 5. Br J Pharmacol. 2017. PMID: 28910490 Free PMC article. Review.
-
Crossroads of telomere biology and anticancer drug discovery.Cancer Sci. 2020 Sep;111(9):3089-3099. doi: 10.1111/cas.14540. Epub 2020 Jul 6. Cancer Sci. 2020. PMID: 32579791 Free PMC article. Review.
-
Potential Role of Traditional Chinese Medicines by Wnt/β-Catenin Pathway Compared With Targeted Small Molecules in Colorectal Cancer Therapy.Front Pharmacol. 2021 Jul 26;12:690501. doi: 10.3389/fphar.2021.690501. eCollection 2021. Front Pharmacol. 2021. PMID: 34381360 Free PMC article. Review.
-
Overlapping variants in the blood, tissues and cell lines for patients with intracranial meningiomas are predominant in stem cell-related genes.Heliyon. 2020 Nov 30;6(11):e05632. doi: 10.1016/j.heliyon.2020.e05632. eCollection 2020 Nov. Heliyon. 2020. PMID: 33305042 Free PMC article.
References
-
- Nielsen DL, Palshof JA, Larsen FO, Jensen BV, Pfeiffer P. A systematic review of salvage therapy to patients with metastatic colorectal cancer previously treated with fluorouracil, oxaliplatin and irinotecan +/- targeted therapy. Cancer Treat Rev. 2014;40:701–715. - PubMed
-
- Fodde R, Smits R, Clevers H. APC, signal transduction and genetic instability in colorectal cancer. Nat Rev Cancer. 2001;1:55–67. - PubMed
-
- Li VS, Ng SS, Boersema PJ, Low TY, Karthaus WR, Gerlach JP, Mohammed S, Heck AJ, Maurice MM, Mahmoudi T, Clevers H. Wnt signaling through inhibition of β-catenin degradation in an intact Axin1 complex. Cell. 2012;149:1245–1256. - PubMed
MeSH terms
Substances
LinkOut - more resources
Full Text Sources
Other Literature Sources
Medical
Molecular Biology Databases
Miscellaneous
