Detection of gene-environment interactions in the presence of linkage disequilibrium and noise by using genetic risk scores with internal weights from elastic net regression
- PMID: 28606108
- PMCID: PMC5469185
- DOI: 10.1186/s12863-017-0519-1
Detection of gene-environment interactions in the presence of linkage disequilibrium and noise by using genetic risk scores with internal weights from elastic net regression
Erratum in
-
Erratum to: Detection of gene-environment interactions in the presence of linkage disequilibrium and noise by using genetic risk scores with internal weights from elastic net regression.BMC Genet. 2017 Aug 1;18(1):73. doi: 10.1186/s12863-017-0530-6. BMC Genet. 2017. PMID: 28764663 Free PMC article. No abstract available.
Abstract
Background: For the analysis of gene-environment (GxE) interactions commonly single nucleotide polymorphisms (SNPs) are used to characterize genetic susceptibility, an approach that mostly lacks power and has poor reproducibility. One promising approach to overcome this problem might be the use of weighted genetic risk scores (GRS), which are defined as weighted sums of risk alleles of gene variants. The gold-standard is to use external weights from published meta-analyses.
Methods: In this study, we used internal weights from the marginal genetic effects of the SNPs estimated by a multivariate elastic net regression and thereby provided a method that can be used if there are no external weights available. We conducted a simulation study for the detection of GxE interactions and compared power and type I error of single SNPs analyses with Bonferroni correction and corresponding analysis with unweighted and our weighted GRS approach in scenarios with six risk SNPs and an increasing number of highly correlated (up to 210) and noise SNPs (up to 840).
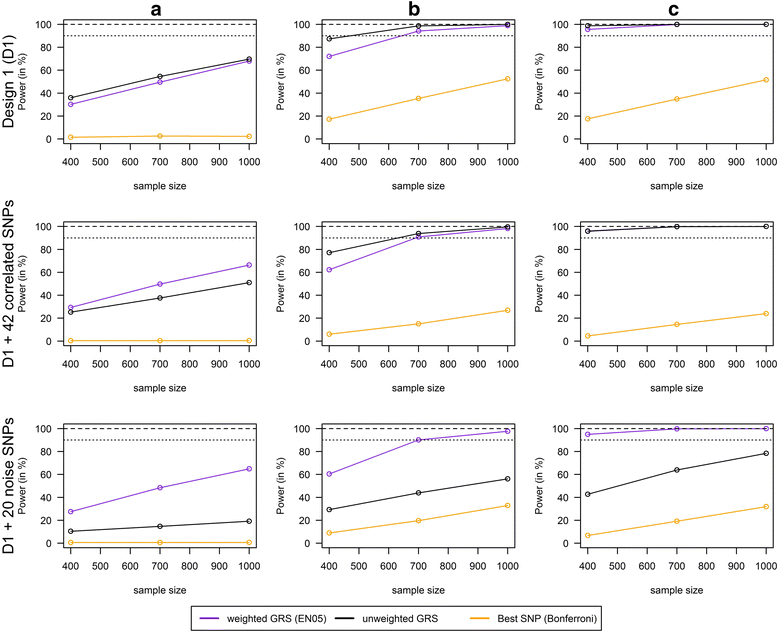
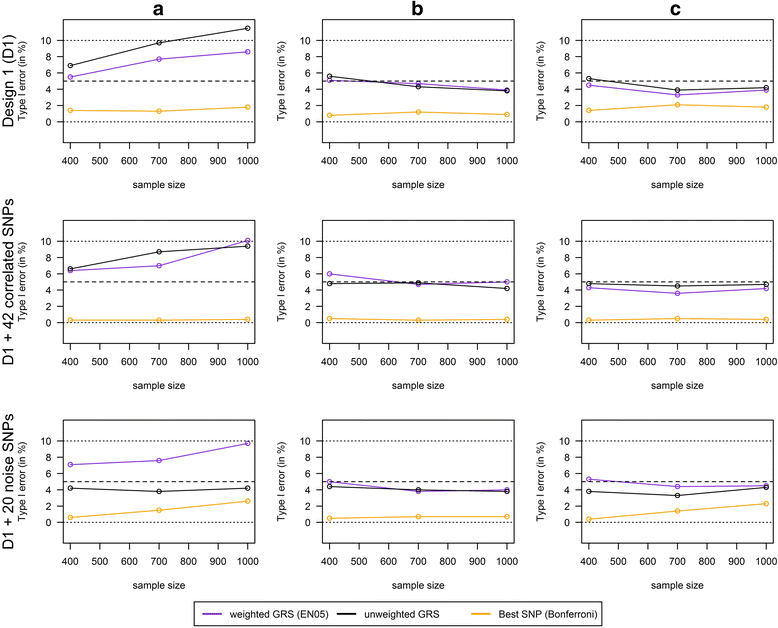
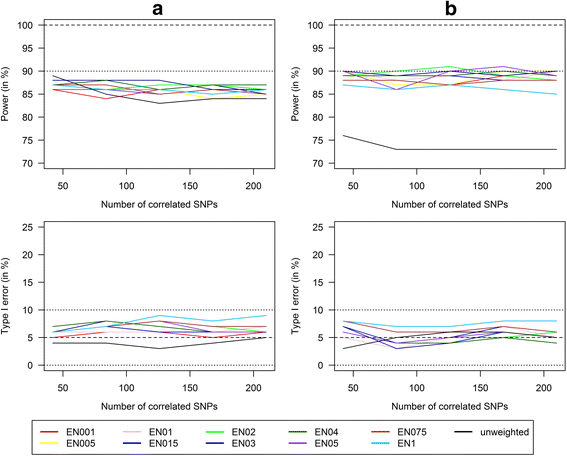
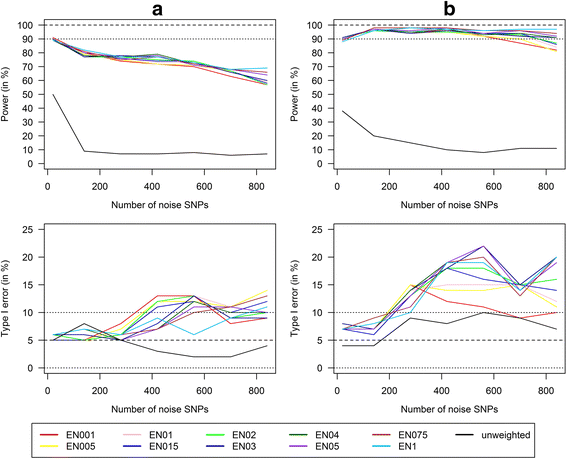
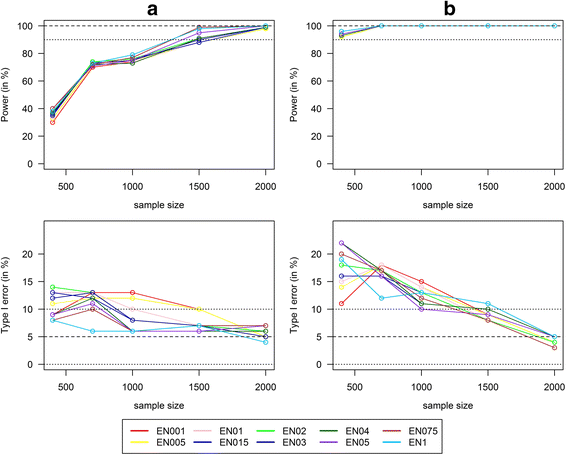
Results: Applying weighted GRS increased the power enormously in comparison to the common single SNPs approach (e.g. 94.2% vs. 35.4%, respectively, to detect a weak interaction with an OR ≈ 1.04 for six uncorrelated risk SNPs and n = 700 with a well-controlled type I error). Furthermore, weighted GRS outperformed the unweighted GRS, in particular in the presence of SNPs without any effect on the phenotype (e.g. 90.1% vs. 43.9%, respectively, when 20 noise SNPs were added to the six risk SNPs). This outperforming of the weighted GRS was confirmed in a real data application on lung inflammation in the SALIA cohort (n = 402). However, in scenarios with a high number of noise SNPs (>200 vs. 6 risk SNPs), larger sample sizes are needed to avoid an increased type I error, whereas a high number of correlated SNPs can be handled even in small samples (e.g. n = 400).
Conclusion: In conclusion, weighted GRS with weights from the marginal genetic effects of the SNPs estimated by a multivariate elastic net regression were shown to be a powerful tool to detect gene-environment interactions in scenarios of high Linkage disequilibrium and noise.
Keywords: Lasso; Linkage disequilibrium; Noise; Penalized regression model; Polygenic approach; Ridge regression.
Figures
Similar articles
-
Comparison of weighting approaches for genetic risk scores in gene-environment interaction studies.BMC Genet. 2017 Dec 16;18(1):115. doi: 10.1186/s12863-017-0586-3. BMC Genet. 2017. PMID: 29246113 Free PMC article.
-
A screening-testing approach for detecting gene-environment interactions using sequential penalized and unpenalized multiple logistic regression.Pac Symp Biocomput. 2015:183-94. Pac Symp Biocomput. 2015. PMID: 25592580 Free PMC article.
-
Polygenic approaches to detect gene-environment interactions when external information is unavailable.Brief Bioinform. 2019 Nov 27;20(6):2236-2252. doi: 10.1093/bib/bby086. Brief Bioinform. 2019. PMID: 30219835 Free PMC article. Review.
-
Gene-environment interactions related to blood pressure traits in two community-based Korean cohorts.Genet Epidemiol. 2019 Jun;43(4):402-413. doi: 10.1002/gepi.22195. Epub 2019 Feb 15. Genet Epidemiol. 2019. PMID: 30770579
-
A Nonlinear Model for Gene-Based Gene-Environment Interaction.Int J Mol Sci. 2016 Jun 4;17(6):882. doi: 10.3390/ijms17060882. Int J Mol Sci. 2016. PMID: 27271617 Free PMC article. Review.
Cited by
-
Comparison of weighting approaches for genetic risk scores in gene-environment interaction studies.BMC Genet. 2017 Dec 16;18(1):115. doi: 10.1186/s12863-017-0586-3. BMC Genet. 2017. PMID: 29246113 Free PMC article.
-
Evaluation of tree-based statistical learning methods for constructing genetic risk scores.BMC Bioinformatics. 2022 Mar 21;23(1):97. doi: 10.1186/s12859-022-04634-w. BMC Bioinformatics. 2022. PMID: 35313824 Free PMC article.
-
Development and validation of an RNA-seq-based transcriptomic risk score for asthma.Sci Rep. 2022 May 23;12(1):8643. doi: 10.1038/s41598-022-12199-0. Sci Rep. 2022. PMID: 35606385 Free PMC article.
-
Influence of blood pressure polygenic risk scores and environmental factors on coronary artery disease in the Korean Genome and Epidemiology Study.J Hum Hypertens. 2024 Mar;38(3):221-227. doi: 10.1038/s41371-023-00878-y. Epub 2023 Nov 20. J Hum Hypertens. 2024. PMID: 37985823
-
Dopaminergic and Opioid Pathways Associated with Impulse Control Disorders in Parkinson's Disease.Front Neurol. 2018 Feb 28;9:109. doi: 10.3389/fneur.2018.00109. eCollection 2018. Front Neurol. 2018. PMID: 29541058 Free PMC article.
References
Publication types
MeSH terms
Substances
LinkOut - more resources
Full Text Sources
Other Literature Sources

