. 2017 Jun 15;68(13):3339-3350.
doi: 10.1093/jxb/erx167.

Stacks off tracks: a role for the golgin AtCASP in plant endoplasmic reticulum-Golgi apparatus tethering

Affiliations

Stacks off tracks: a role for the golgin AtCASP in plant endoplasmic reticulum-Golgi apparatus tethering

Anne Osterrieder et al. J Exp Bot. .

Abstract

The plant Golgi apparatus modifies and sorts incoming proteins from the endoplasmic reticulum (ER) and synthesizes cell wall matrix material. Plant cells possess numerous motile Golgi bodies, which are connected to the ER by yet to be identified tethering factors. Previous studies indicated a role for cis-Golgi plant golgins, which are long coiled-coil domain proteins anchored to Golgi membranes, in Golgi biogenesis. Here we show a tethering role for the golgin AtCASP at the ER-Golgi interface. Using live-cell imaging, Golgi body dynamics were compared in Arabidopsis thaliana leaf epidermal cells expressing fluorescently tagged AtCASP, a truncated AtCASP-ΔCC lacking the coiled-coil domains, and the Golgi marker STtmd. Golgi body speed and displacement were significantly reduced in AtCASP-ΔCC lines. Using a dual-colour optical trapping system and a TIRF-tweezer system, individual Golgi bodies were captured in planta. Golgi bodies in AtCASP-ΔCC lines were easier to trap and the ER-Golgi connection was more easily disrupted. Occasionally, the ER tubule followed a trapped Golgi body with a gap, indicating the presence of other tethering factors. Our work confirms that the intimate ER-Golgi association can be disrupted or weakened by expression of truncated AtCASP-ΔCC and suggests that this connection is most likely maintained by a golgin-mediated tethering complex.

Keywords: Arabidopsis; Golgi apparatus; endomembrane system; endoplasmic reticulum; golgin; optical tweezers; secretory pathway; tethering factor.


Figures

Fig. 1.
Fig. 1.
Fluorescent AtCASP full-length and mutant constructs. (a) Diagram depicting the domain structure of fluorescent AtCASP constructs used in this study. Full-length AtCASP and a truncation AtCASP-∆CC consisting of its C-terminus of 154 amino acids including the transmembrane domain but missing the coiled-coil domains that convey its tethering function. CC, coiled-coil domain; TMD, transmembrane domain; mRFP, monomeric red fluorescent protein. (b) and (c) Confocal laser scanning micrographs of tobacco leaf epidermal cells 3 d after transfection, transiently expressing the standard Golgi marker STtmd-GFP (green) and (b) full-length mRFP-AtCASP (magenta) or (c) of mRFP-AtCASP-∆CC (magenta). Both constructs co-localize in punctate structures, which represent Golgi bodies. Cells were transfected using agrobacterium-mediated transformation. STtmd-GFP was infiltrated at OD600=0.05, mRFP-AtCASP constructs at OD600=0.1. Scale bars, 20 µm.
Fig. 2.
Fig. 2.
Live-cell imaging and quantitative analysis of Golgi body dynamics in AtCASP full-length and mutant Arabidopsis lines. (a–c) Confocal laser scanning micrographs of Arabidopsis cotyledonary leaf cells stably expressing the ER marker GFP-HDEL (green) and (a) STtmd-mRFP (magenta), (b) mRFP-AtCASP (magenta) or (c) mRFP-AtCASP-ΔCC (magenta). No obvious differences in Golgi body morphology, location or dynamics could be observed through qualitative live-cell imaging. Scale bars, 5 µm. (d–e) Quantitative analysis of (d) mean displacement and (e) mean speed of fluorescently labelled Golgi bodies in stable Arabidopsis lines expressing either the control STtmd-mRFP, mRFP-AtCASP, or mRFP-AtCASP- ∆CC. The mean speed and displacement of individual Golgi bodies were determined manually using the Fiji particle tracking plugin MtrackJ (Meijering et al., 2012). Mean speed and displacement values per cell were calculated from pooled Golgi body values (n of Golgi bodies per video ranged between 3–17). Statistical tests, one-way ANOVA and unpaired two-tailed Student’s t-test, were then performed on the pooled cell values (n of cells STtmd=41, AtCASP-FL=79, AtCASP-ΔCC=63, see Table 1 for full summary). Scatter plots depict the mean as a horizontal bar, error bars depict the standard deviation. Asterisks represent the level of significance (*P<0.05, **P<0.01).
Fig. 3.
Fig. 3.
Disruption of the ER-Golgi connection in mutant AtCASP-ΔCC cells. Confocal images showing still images of a time series over 34.4 seconds during optical trapping of Golgi bodies in transgenic Arabidopsis cotyledonary leaf epidermal cells. Plants expressed mRFP-AtCASP-ΔCC (magenta) and the ER marker GFP-HDEL (green). Arrowheads point to optically trapped Golgi bodies. Scale bars, 2 µm. (a) Several Golgi bodies moved with the trap across a short distance. A single Golgi body remained in the trap and moved through the cell detached from the ER. (b) A Golgi body was trapped and the ER-Golgi connection was disrupted at time point 7.8 s (asterisk). The ER tubule followed the Golgi body with a gap. At time point 20.4 s, a second ER tubule mirrored Golgi body movement with a similar gap (arrowhead).
Fig. 4.
Fig. 4.
Comparing the ability to trap Golgi bodies in STtmd-mRFP control, full-length mRFP-AtCASP and mutant mRFP-AtCASP-ΔCC lines. (a) Two or more Golgi bodies were captured in 64% of trapping events in full-length AtCASP lines, compared with just 35% in control and 47% in AtCASP-ΔCC lines. Expression of full-length mRFP-AtCASP appears to make Golgi bodies ‘stickier’. (b) Average numbers of three experiments (n=300) of trapping control, full-length and mutant AtCASP Golgi bodies in Arabidopsis cotyledons using a TIRF-Tweezer system. Compared with 46% trapped Golgi bodies in control cells and 57% trapped Golgi bodies in in mRFP-AtCASP cells, 76% of Golgi bodies expressing the truncation were trapped. The STtmd control and AtCASP full-length lines did not significantly differ from each other (Chi-square test, P=0.321) but the AtCASP-∆CC line differed significantly from the control (P=1.065 × 10⁻⁸) and full-length lines (P=2.091 × 10⁻⁶).
Fig. 5.
Fig. 5.
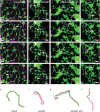
ER and Golgi body tracks differ between control and mutant lines. (a–d) Confocal images showing the effect of optically trapping individual Golgi bodies in Arabidopsis cotyledons expressing GFP-HDEL (green) and (a) the control marker STtmd-mRFP, (b) full-length GFP-AtCASP or (c–d) truncated GFP-AtCASP- ΔCC (all shown in magenta). (e–h) Visualisation of Golgi body tracks (magenta) in relation to the ER tubule tip (green). Arrowheads indicate trapped Golgi bodies. Scale bars, 2 µm. (a) and (e) Control cell expressing STtmd-mRFP and GFP-HDEL. The Golgi-ER connection remained intact and both tracks were closely associated. (b) and (f) Cell expressing mRFP-AtCASP and GFP-HDEL. Golgi and ER remained connected only for a short time before the connection was disrupted (asterisk). (c) and (g) Cell expressing mRFP-AtCASP-∆CC and GFP-HDEL. ER and Golgi moved together for the first part of the time series. The connection then broke apart (asterisk) and the ER followed the Golgi body with a gap. (d) and (h) Time series showing an example in which the ER-Golgi connection was disrupted immediately after trapping. A second ER tubule unsuccessfully attempted to reconnect with the Golgi body (asterisk).
Fig. 6.
Fig. 6.
Semi-quantitative analysis of Golgi body trapping in control, AtCASP full-length and AtCASP mutant-expressing Arabidopsis lines. Assessing the stability of the connection between individual Golgi bodies and the ER in Arabidopsis cotyledonary leaf epidermal cells expressing STtmd-mRFP/GFP-HDEL (control, n=17), full-length mRFP-AtCASP/GFP-HDEL (n=11) or truncated mRFP-AtCASP-∆CC/GFP-HDEL (n=15). Errors bars depict means and standard deviations. (a) Scatterplot displaying the ratio of number of frames per trapping event with an intact ER-Golgi connection versus the number of total frames. A ratio of 1 indicates an intact connection over the whole duration of the time series. The smaller the ratio, the longer the connection was disrupted during a time series. The ER-Golgi connection was disrupted significantly longer in cells expressing mRFP-AtCASP (P=0.0031) or mRFP-AtCASP-∆CC (P=0.007), compared with control cells. Full-length and mutant AtCASP lines did not differ significantly (P=0.75). (b) Scatterplot showing the number times that the ER-Golgi connection was disrupted per individual trapping event. In almost all of the trapping events in control cells, the connection remained intact. Its instability, symbolized by repeated detachments and reattachments of the trapped Golgi body with the ER, increased significantly in mRFP-AtCASP cells (P=0.0047) and mRFP-AtCASP-∆CC cells (P=0.012). No significant difference was observed between full-length and mutant AtCASP (P=0.356).

Comment in

Similar articles

Cited by

References

    1. Altan-Bonnet N, Sougrat R, Lippincott-Schwartz J. 2004. Molecular basis for Golgi maintenance and biogenesis. Current Opinion in Cell Biology 16, 364–372. - PubMed
    1. Avisar D, Abu-Abied M, Belausov E, Sadot E, Hawes C, Sparkes IA. 2009. A comparative study of the involvement of 17 Arabidopsis myosin family members on the motility of Golgi and other organelles. Plant Physiology 150, 700–709. - PMC - PubMed
    1. Barr FA, Short B. 2003. Golgins in the structure and dynamics of the Golgi apparatus. Current Opinion in Cell Biology 15, 405–413. - PubMed
    1. Boevink P, Oparka K, Santa Cruz S, Martin B, Betteridge A, Hawes C. 1998. Stacks on tracks: the plant Golgi apparatus traffics on an actin/ER network. The Plant Journal 15, 441–447. - PubMed
    1. Boyes DC, Zayed AM, Ascenzi R, McCaskill AJ, Hoffman NE, Davis KR, Görlach J. 2001. Growth stage-based phenotypic analysis of Arabidopsis: a model for high throughput functional genomics in plants. The Plant Cell 13, 1499–1510. - PMC - PubMed

MeSH terms