. 2017 Jun 1;169(6):1051-1065.e18.
doi: 10.1016/j.cell.2017.05.022.

The Mammalian Ribo-interactome Reveals Ribosome Functional Diversity and Heterogeneity

Affiliations

The Mammalian Ribo-interactome Reveals Ribosome Functional Diversity and Heterogeneity

Deniz Simsek et al. Cell. .

Abstract

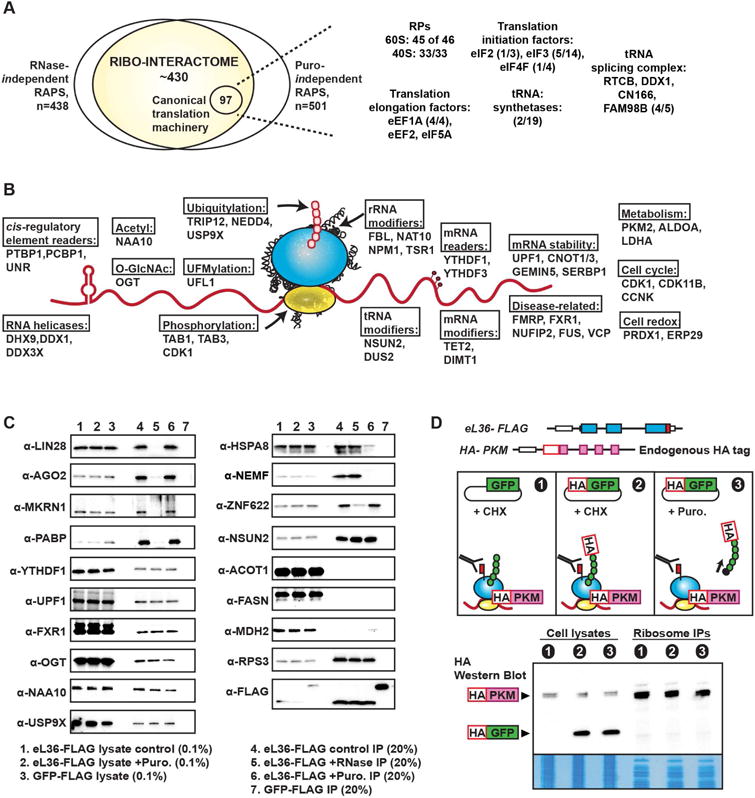
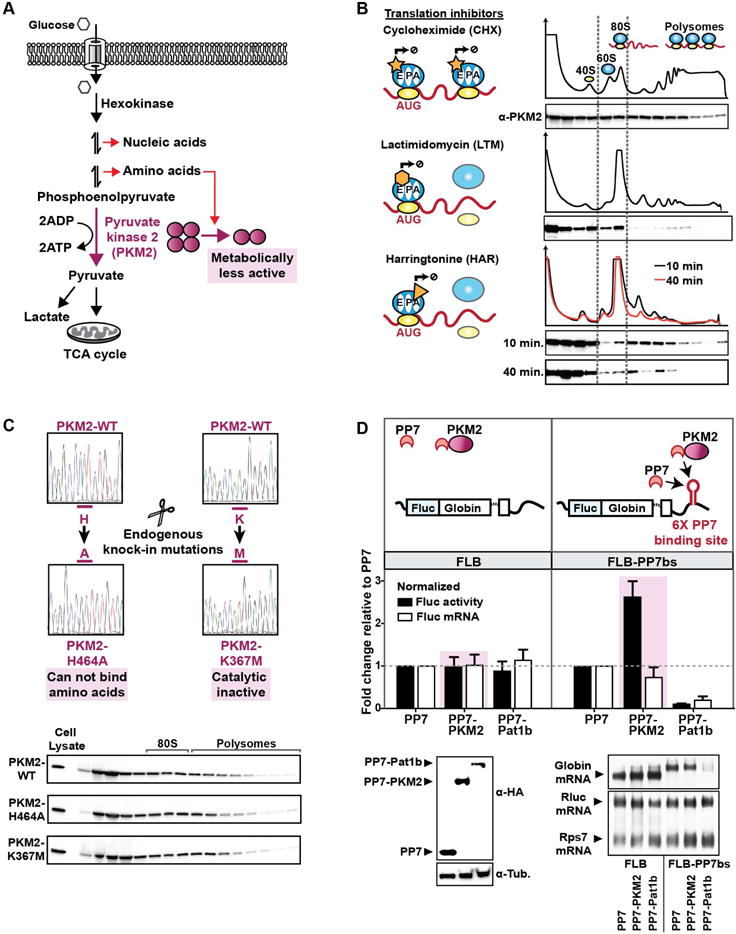
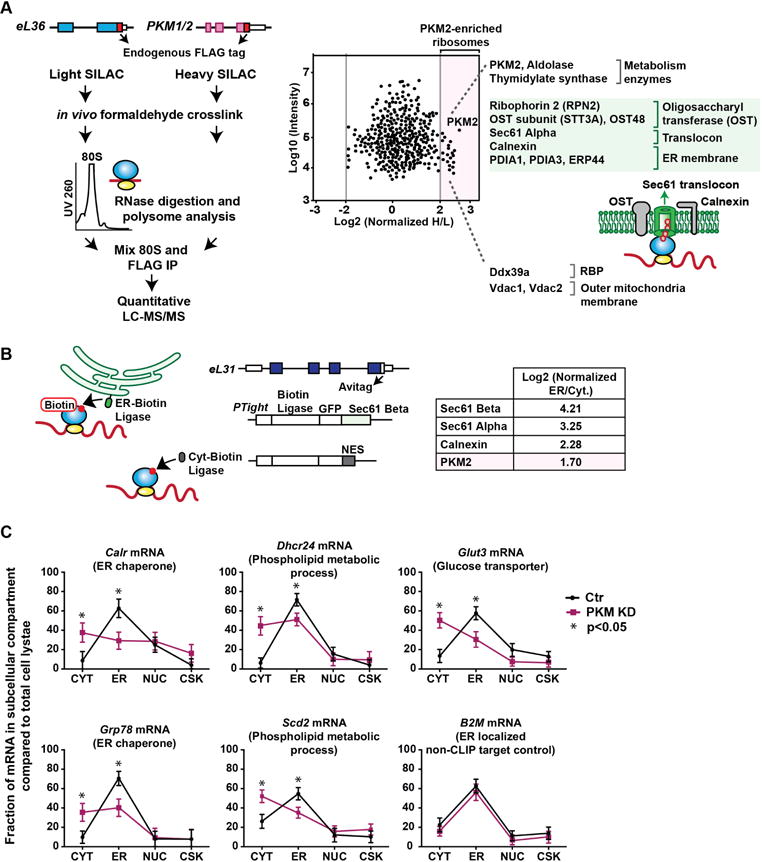
During eukaryotic evolution, ribosomes have considerably increased in size, forming a surface-exposed ribosomal RNA (rRNA) shell of unknown function, which may create an interface for yet uncharacterized interacting proteins. To investigate such protein interactions, we establish a ribosome affinity purification method that unexpectedly identifies hundreds of ribosome-associated proteins (RAPs) from categories including metabolism and cell cycle, as well as RNA- and protein-modifying enzymes that functionally diversify mammalian ribosomes. By further characterizing RAPs, we discover the presence of ufmylation, a metazoan-specific post-translational modification (PTM), on ribosomes and define its direct substrates. Moreover, we show that the metabolic enzyme, pyruvate kinase muscle (PKM), interacts with sub-pools of endoplasmic reticulum (ER)-associated ribosomes, exerting a non-canonical function as an RNA-binding protein in the translation of ER-destined mRNAs. Therefore, RAPs interconnect one of life's most ancient molecular machines with diverse cellular processes, providing an additional layer of regulatory potential to protein expression.

Keywords: PKM; RNA-binding proteins; endoplasmic reticulum; metabolism; ribosome; ribosome heterogeneity; translation; ufmylation.


Figures

Figure 1
Figure 1
Affinity enrichment of mammalian ribosomes defines the ribo-interactome in ESCs. A, In mouse ESCs, eL36 and eS17 are endogenously tagged with FLAG using CRISPR-Cas9 endonuclease system denoted by scissors. In addition to the endogenously FLAG tagged RPs, cells stably expressing different levels of GFP-FLAG transgenes were generated using PiggyBac transposon-mediated stable integration. GFP-FLAG transgene clone 3, expressing FLAG at similar levels to the tagged RPs, was chosen for further analyses. B, Strategy to define the mammalian ribo-interactome. GFP-FLAG cells are used to assess the background of the ribosome affinity enrichment strategy. Cytoplasmic lysates from eL36-FLAG, eS17-FLAG, and GFP-FLAG cells are subjected to FLAG IP under similar conditions, and IPs are analyzed by LC/MS-MS. Average, normalized spectral abundance factor (NSAF) of RPs from three biological replicates of either eL36-FLAG or eS17-FLAG are shown. See Table S1. C, Maximum SAINT probability scores and fold enrichment of eL36 and eS17 experiments are shown. SAINT probability of 0.56 corresponds to 0.08 FDR. 60S RPs are colored in blue, 40S RPs in yellow. D, eL36 specific interactors are defined as those present in all eL36 biological replicates with at least 2 unique peptides, but not present in any of the eS17 biological replicates. The overlap between eL36 and eS17 datasets is defined as the proteins present at the intersection of at least one eL36 and one eS17 replicate with a SAINT score >=0.56. For GO biological process analysis, Benjamini–Hochberg FDR cutoff of 8% and fold enrichment >=4 are used. Examples of enriched GO categories are shown, for a full list see Table S2. The number of identified genes in each GO category is shown in comparison to the number of genes in each GO category.
Figure 2
Figure 2
The quantitative TMT experiment to determine RNase- and puromycin-dependent RAPs. A, Overview of the quantitative-MS experiment approach. Three biological replicates (BR) are used for each control, RNase, and puromycin-treatment. Pearson correlation coefficients for each BR within a treatment are calculated using normalized log2 TMT intensities. B, Scatter plot of normalized log2 RNase/control ratios versus P-values. FDR and negative predictive values (NPV) are estimated by mixture modeling of test statistics (Efron, 2004). 14% of the interactions are estimated to be RNase-dependent (Figure S4). At 99% NPV, 438 interactions are estimated to be RNase-independent. Representative examples of RNase-dependent ribosome-interactions are highlighted. See Table S3. C, Scatter plot with normalized log2 puromycin/control ratios versus P-values. Representative examples of puromycin dependent interactions are highlighted.
Figure 3
Figure 3
The ribo-interactome consists of diverse functional groups. A, The ribo-interactome is defined as the intersection of RNase-independent and puromycin-independent interactions. The number of identified proteins related to canonical translation machinery in the MS experiments is presented along with the known number of factors in each class. B, The ribosome as a hub for interactions with a multitude of proteins with diverse functions. Representative examples of direct ribosome interactors found in each functional group are presented. In the schematic, the pink circles represent the nascent peptides; red circles on the mRNA represent mRNA modifications. C, Validation of representative examples from ribo-interactome. Western blots of the interactors from control, RNase-treated, and puromcyin-treated ribosome IP samples, along with the cytoplasmic lysates which are used as input control for these IPs. D, PKM is endogenously tagged with HA within eL36-FLAG ES cells. Untagged GFP and HA-tagged GFP are further transfected into these cells. GFP does not interact with ribosomes, and is used as a negative control for possible ribosome interactions. GFP nascent chains are depicted by green circles. Western blots of the cell lysates and ribosome IPs are shown alongside Coomassie stained fractions. 0.01% of cytoplasmic lysates are used as input and 20% of the IPs are run in the western blot.
Figure 4
Figure 4
The ufmylation enzyme UFL1 interacts with ribosomes and modifies key components of the translation machinery. A, Schematic of the ufmylation cascade. B, UFL1 is tagged endogenously with HA at its N terminus. The UFL1 antibody recognizes the C-terminal portion of human UFL1 protein. FLAG IPs for both control GFP-FLAG and eL36-FLAG cells are performed. Both the GFP- FLAG input and IP as well as the eL36-FLAG input and IP are blotted with HA, Ufl1, and Ufm1-specific antibodies. C, Sucrose gradient fractionation is performed and fractions are blotted for either the Ufm1 modification or the E3 ligase enzyme, UFL1. UV signal at 260 detects RNA and indicates rRNA abundance across fractions. D, Schematic that outlines the two-step affinity enrichment to identify ufmylated substrates at the ribosome. Fold changes (FC) of each His-Ufm1 IP compared to background IP is shown. 4-fold FC is used as a cutoff and proteins above this cutoff are marked. See Table S4. 80S human ribosome structure with the positions of uS3 (green), uS20 (orange), uL16 (dark blue), mRNA (red), E-site tRNA (dark grey), and EEF2 (black) are indicated. The ribosomal RNAs are shown in light blue (60S) or yellow (40S). PDB: 4V6X with mRNA superimposed are from PDB: 4KZZ.
Figure 5
Figure 5
Characterization of ribosome binding by the metabolism enzyme PKM2. A, Schematic for the glycolysis pathway. B, Sucrose gradient fractionation for PKM2. ESCs are treated with translation elongation inhibitors that act at different stages of translation (inhibitors denoted by yellow geometric shapes). As the duration of the HAR treatment increases, the characteristic polysome UV signal decreases, since uninhibited ribosomes will ‘run-off’ the mRNA as depicted by the lighter blue shaded ribosome cartoon. Drug treatments were performed for short durations to capture immediate effects. CHX treatment was for 2 mins; LTM treatment was for 10 mins, and HAR treatments was for 10 or 40 mins. Protein levels of PKM2 are shown in each fraction. C, Endogenous homozygous knock-in mutations are generated using the CRISPR-Cas9 endonuclease system as denoted by scissors. Sequencing chromatograms of the wild type and mutated PKM2 loci confirm mutations are in homozygosity. Sucrose gradient fractions are precipitated and blotted for PKM2. D, Schematic representation of FLB and FLB-PP7bs reporters. Firefly luciferase activity is normalized to cotransfected Renilla luciferase control and represented relative to PP7 alone. Northern blots are performed with an exon-junction probe crossing the rabbit β-globin intron and are normalized to Renilla control. Rps7 is the loading control. The plots of luciferase activity show the mean of 6 biological replicates. The mRNA levels detected by Northern blots are the mean of 4 biological replicates. Error bars in both represent the standard deviation.
Figure 6
Figure 6
PKM2 directly binds and regulates translation of target mRNAs that are commonly translated at the ER. A, PKM1/2 is endogenously tagged seamlessly with a C-terminal tandem FLAG-HA tag. Schematic of PKM2-FAST iCLIP experimental flow. B, Percentage of the total iCLIP reads for various RNA classes. Positions of PKM2 crosslinks on the mature rRNA region is shown. ‘Others’ refer to U1, U2, U6 and other snoRNAs. Diagram for the A-site finger is taken from Comparative RNA Web (http://www.rna.ccbb.utexas.edu). Canonical base pairs are depicted with (-), GU wobble base pairs with (.). The nucleotide corresponding to the highest peak in the mature rRNA region, signifying the PKM2 crosslinking site on the A-site finger, is highlighted with yellow. C, Overview of ribosome profiling workflow for control and PKM knockdown experiments. D, Scatter plot showing the correlation between PKM2 iCLIP enrichment and translational efficiency change upon PKM depletion. Spearman coefficient (ρ) is presented. E, Cumulative distributions of translational efficiency change upon PKM-depletion. PKM2 iCLIP targets are divided into four groups according to the degree of their iCLIP enrichment. Strong binders have lower translational efficiency in PKM-depleted cells relative to weak binders (P-value < 2.2 ×10⁻¹⁶ between top 5% and bottom 50% iCLIP targets, Mann-Whitney U test). See Table S5. F, GO analysis for cellular compartment and biological process for PKM2 iCLIP targets. Adjusted P-values (Benjamini–Hochberg) are shown.
Figure 7
Figure 7
PKM2 is enriched at ER ribosomes and localizes mRNAs to the ER. A, Quantitative-MS experiment to characterize PKM2 containing ribosomes. Scatter plot with normalized log2 heavy/light ratios comparing eL36 and PKM2-enriched ribosomes (n=2). Mean 0.61; S.D. 0.50; cut off values for enriched proteins was 2.5 S.D. from the mean and is shown as the grey line lines. See Table S6. Green denotes ER-related components. B, Subcellular ER-ribosome enrichment. eL31 is tagged endogenously with Avitag at the C terminus. ER-or cytoplasmic- biotin ligase is expressed from an inducible promoter. ER-biotin ligase is attached to the Sec61 Beta protein and cytoplasmic biotin ligase contains a nuclear export signal (NES). PKM2 enrichment is shown relative to known ER resident proteins. C, Subcellular localization of PKM2 iCLIP targets. The fraction of mRNAs within subcellular fractions normalized to total mRNA are shown. Each fraction value is initially determined by normalizing to an exogenous spike-in RNA control. Data are mean and S.D. of two biological replicates. CYT, cytosol; ER, Endoplasmic reticulum; NUC, nucleus; CSK, cytoskeleton.

Comment in

  • Translation: RAPping with ribosomes.
    Strzyz P. Strzyz P. Nat Rev Mol Cell Biol. 2017 Jul;18(7):406. doi: 10.1038/nrm.2017.62. Epub 2017 Jun 14. Nat Rev Mol Cell Biol. 2017. PMID: 28611415 No abstract available.

Similar articles

Cited by

References

    1. Battle DJ, Kasim M, Yong J, Lotti F, Lau CK, Mouaikel J, Zhang Z, Han K, Wan L, Dreyfuss G. The SMN complex: an assembly machine for RNPs. Cold Spring Harb Symp Quant Biol. 2006;71:313–320. - PubMed
    1. Bendall SC, Hughes C, Stewart MH, Doble B, Bhatia M, Lajoie GA. Prevention of amino acid conversion in SILAC experiments with embryonic stem cells. Mol Cell Proteomics. 2008;7:1587–1597. - PMC - PubMed
    1. Bhat M, Robichaud N, Hulea L, Sonenberg N, Pelletier J, Topisirovic I. Targeting the translation machinery in cancer. Nat Rev Drug Discov. 2015;14:261–278. - PubMed
    1. Brina D, Miluzio A, Ricciardi S, Biffo S. eIF6 anti-association activity is required for ribosome biogenesis, translational control and tumor progression. Biochim Biophys Acta. 2015;1849:830–835. - PubMed
    1. Budkevich T, Giesebrecht J, Altman RB, Munro JB, Mielke T, Nierhaus KH, Blanchard SC, Spahn CM. Structure and dynamics of the mammalian ribosomal pretranslocation complex. Mol Cell. 2011;44:214–224. - PMC - PubMed