

Quaternary interactions and supercoiling modulate the cooperative DNA binding of AGT
- PMID: 28575445
- PMCID: PMC5737729
- DOI: 10.1093/nar/gkx223
Quaternary interactions and supercoiling modulate the cooperative DNA binding of AGT
Abstract
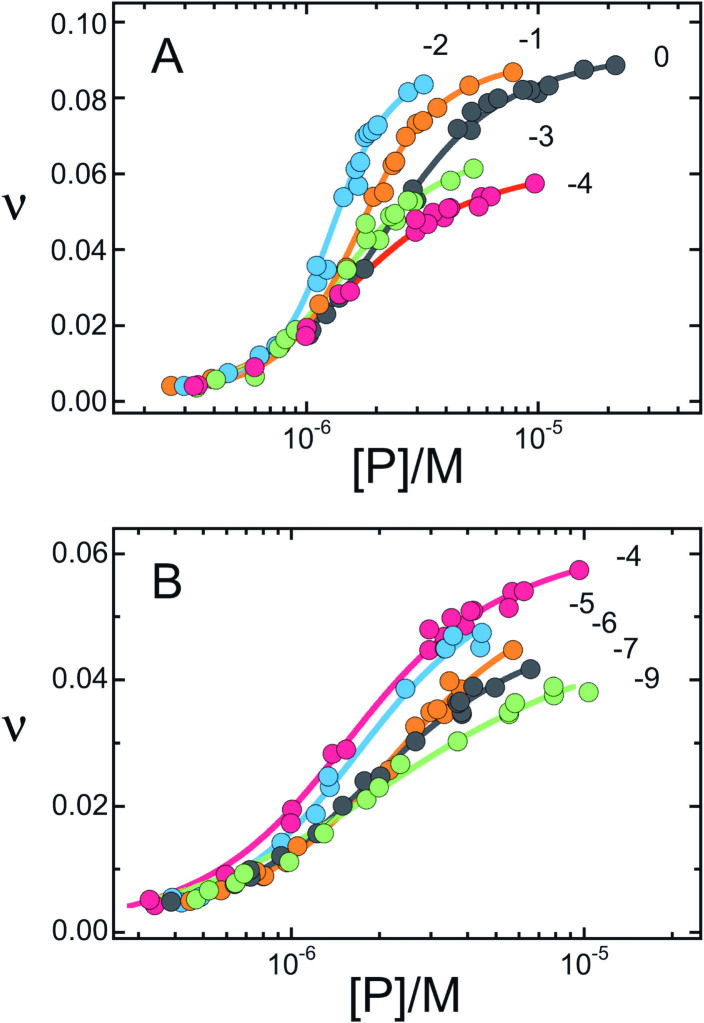
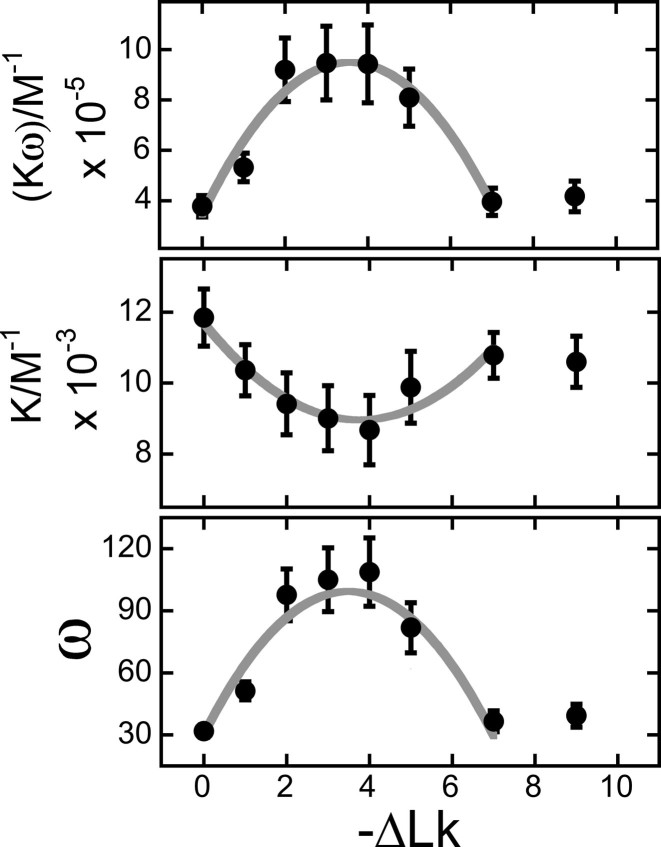
Human O6-alkylguanine-DNA alkyltransferase (AGT) repairs mutagenic O6-alkylguanine and O4-alkylthymine adducts in single-stranded and duplex DNAs. The search for these lesions, through a vast excess of competing, unmodified genomic DNA, is a mechanistic challenge that may limit the repair rate in vivo. Here, we examine influences of DNA secondary structure and twist on protein-protein interactions in cooperative AGT complexes formed on lesion-free DNAs that model the unmodified parts of the genome. We used a new approach to resolve nearest neighbor (nn) and long-range (lr) components from the ensemble-average cooperativity, ωave. We found that while nearest-neighbor contacts were significant, long-range interactions dominated cooperativity and this pattern held true whether the DNA was single-stranded or duplex. Experiments with single plasmid topoisomers showed that the average cooperativity was sensitive to DNA twist, and was strongest when the DNA was slightly underwound. This suggests that AGT proteins are optimally juxtaposed when the DNA is near its torsionally-relaxed state. Most striking was the decline of binding stoichiometry with linking number. As stoichiometry and affinity differences were not correlated, we interpret this as evidence that supercoiling occludes AGT binding sites. These features suggest that AGT's lesion-search distributes preferentially to sites containing torsionally-relaxed DNA, in vivo.
© The Author(s) 2017. Published by Oxford University Press on behalf of Nucleic Acids Research.
Figures
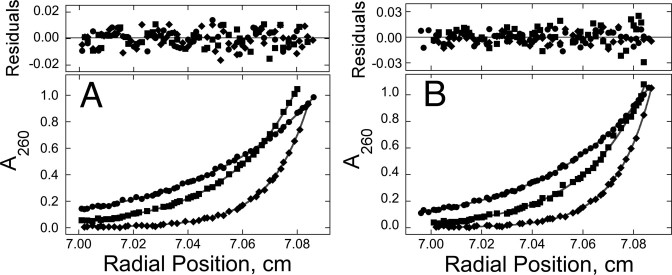
 ), 26 000 rpm (▪) and 35 000 rpm (♦) are shown with vertical offsets for clarity. The smooth curves correspond to a global fit of Equation (2) to a dataset including these scans and ones obtained at [AGT] = 18.2 μM. Panel B: data for binding to double-stranded DNA. Samples contained 2.0 μM DNA and 11.0 μM AGT. Radial scans taken at 20 000 rpm (), 26 000 rpm (▪) and 35 000 rpm (♦) are shown with vertical offsets for clarity. The smooth curves correspond to global fits of Equation (2) to a dataset that includes these scans and ones obtained at [AGT] = 16.5 μM. For both analyses the small residuals, symmetrically-distributed about zero (upper panels) indicate that the cooperative nP + D ⇆ PnD model is compatible with the mass distributions of DNA. These analyses returned n = 2.96 ± 0.09 for single-stranded and 2.85 ± 0.07 for duplex 13-mer DNAs, respectively.
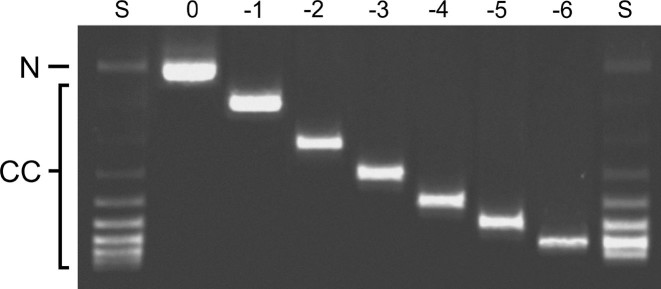
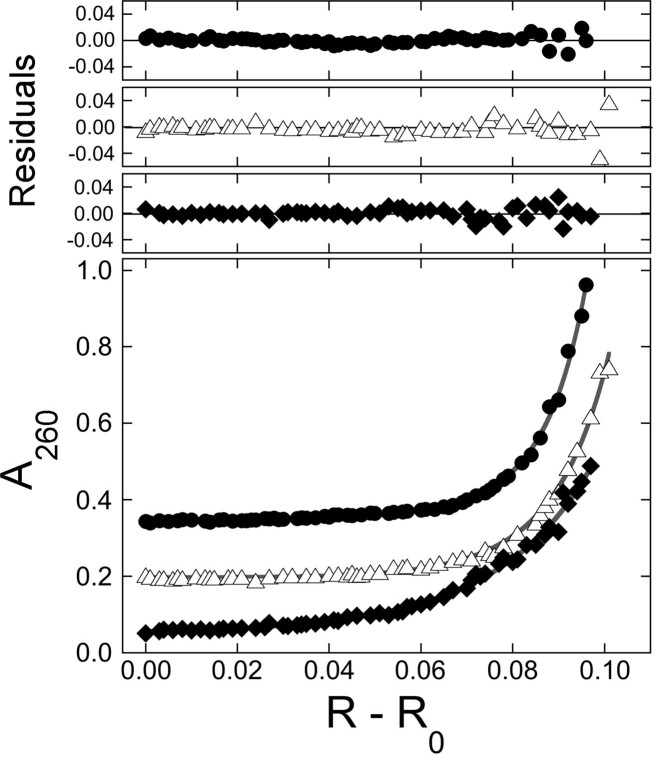 ), of ΔLk = −2 (△) and ΔLk = −5 (♦). Absorbance values were offset vertically to improve visual clarity. The smooth curves correspond to fits of Equation (1) to these data. Small, symmetrically-distributed residuals (upper panels) indicate that the two-species model represented by Equation (1) was consistent with the mass distributions of DNA in these samples.
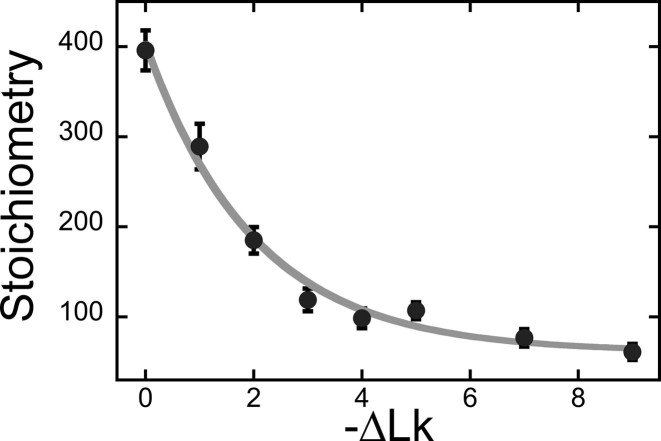
Similar articles
-
Interactions of human O(6)-alkylguanine-DNA alkyltransferase (AGT) with short double-stranded DNAs.Biochemistry. 2008 Dec 30;47(52):13754-63. doi: 10.1021/bi801666c. Biochemistry. 2008. PMID: 19061338 Free PMC article.
-
Reaction and binding of oligodeoxynucleotides containing analogues of O6-methylguanine with wild-type and mutant human O6-alkylguanine-DNA alkyltransferase.Biochemistry. 1999 May 25;38(21):6801-6. doi: 10.1021/bi982908w. Biochemistry. 1999. PMID: 10346901
-
Investigation of the role of tyrosine-114 in the activity of human O6-alkylguanine-DNA alkyltranferase.Biochemistry. 1998 Sep 8;37(36):12489-95. doi: 10.1021/bi9811718. Biochemistry. 1998. PMID: 9730821
-
Insight into the cooperative DNA binding of the O⁶-alkylguanine DNA alkyltransferase.DNA Repair (Amst). 2014 Aug;20:14-22. doi: 10.1016/j.dnarep.2014.01.006. Epub 2014 Feb 16. DNA Repair (Amst). 2014. PMID: 24553127 Free PMC article. Review.
-
Conserved structural motifs governing the stoichiometric repair of alkylated DNA by O(6)-alkylguanine-DNA alkyltransferase.Mutat Res. 2000 Aug 30;460(3-4):151-63. doi: 10.1016/s0921-8777(00)00024-0. Mutat Res. 2000. PMID: 10946226 Review.
Cited by
-
The DNA Alkyltransferase Family of DNA Repair Proteins: Common Mechanisms, Diverse Functions.Int J Mol Sci. 2023 Dec 29;25(1):463. doi: 10.3390/ijms25010463. Int J Mol Sci. 2023. PMID: 38203633 Free PMC article. Review.
-
Every OGT Is Illuminated … by Fluorescent and Synchrotron Lights.Int J Mol Sci. 2017 Dec 5;18(12):2613. doi: 10.3390/ijms18122613. Int J Mol Sci. 2017. PMID: 29206193 Free PMC article. Review.
References
MeSH terms
Substances
LinkOut - more resources
Full Text Sources
Other Literature Sources
Research Materials
Miscellaneous
