

Integrative genomic analyses for identification and prioritization of long non-coding RNAs associated with autism
- PMID: 28562671
- PMCID: PMC5451068
- DOI: 10.1371/journal.pone.0178532
Integrative genomic analyses for identification and prioritization of long non-coding RNAs associated with autism
Abstract
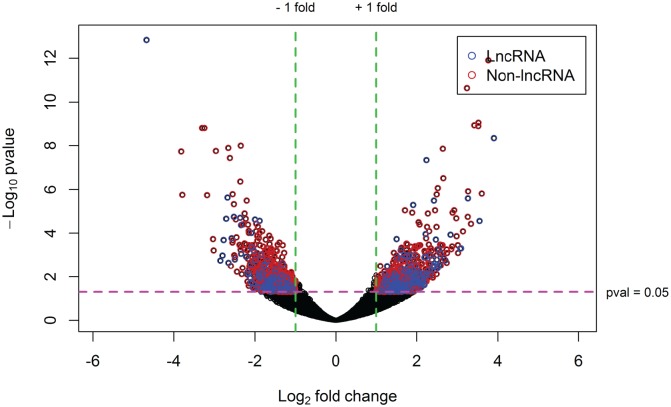
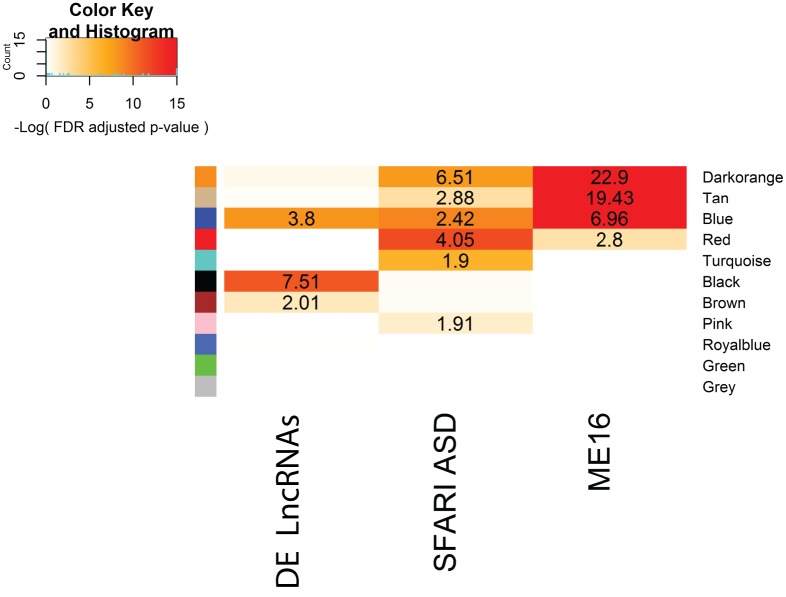
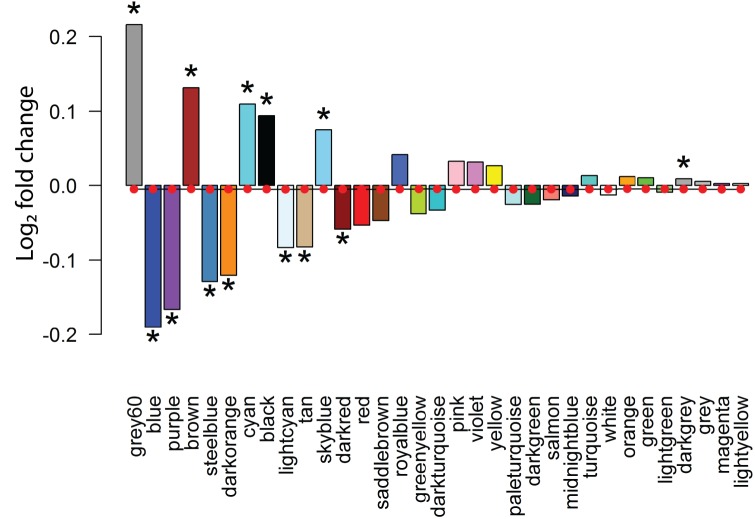
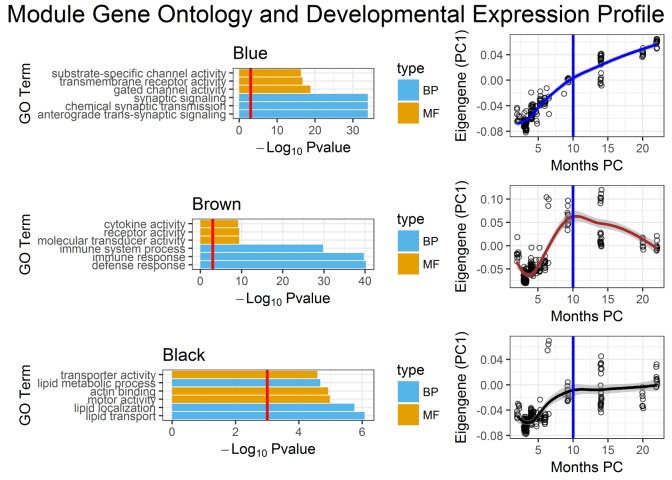
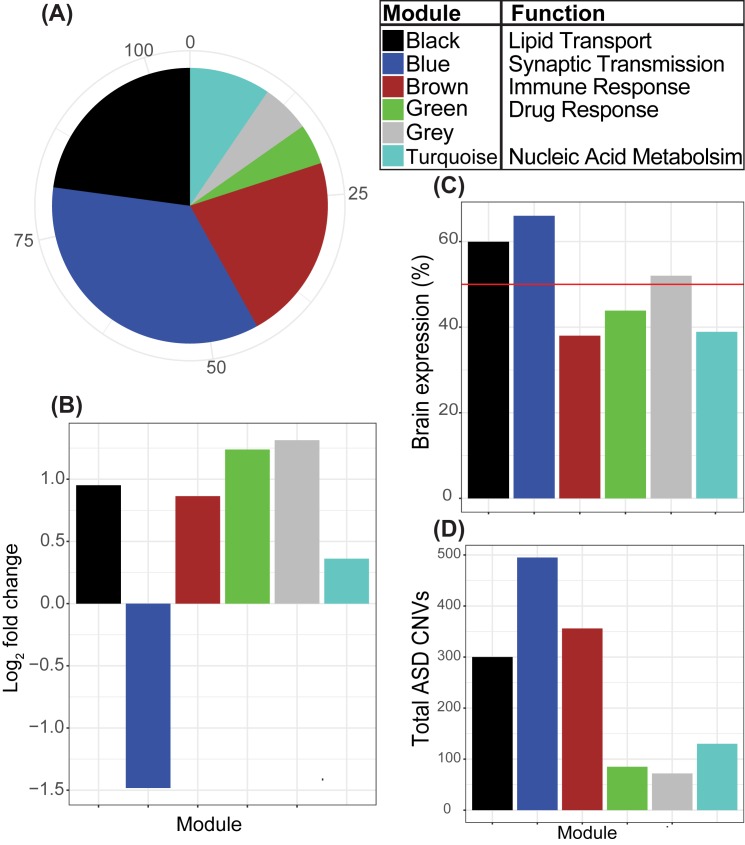
Genetic studies have identified many risk loci for autism spectrum disorder (ASD) although causal factors in the majority of cases are still unknown. Currently, known ASD risk genes are all protein-coding genes; however, the vast majority of transcripts in humans are non-coding RNAs (ncRNAs) which do not encode proteins. Recently, long non-coding RNAs (lncRNAs) were shown to be highly expressed in the human brain and crucial for normal brain development. We have constructed a computational pipeline for the integration of various genomic datasets to identify lncRNAs associated with ASD. This pipeline utilizes differential gene expression patterns in affected tissues in conjunction with gene co-expression networks in tissue-matched non-affected samples. We analyzed RNA-seq data from the cortical brain tissues from ASD cases and controls to identify lncRNAs differentially expressed in ASD. We derived a gene co-expression network from an independent human brain developmental transcriptome and detected a convergence of the differentially expressed lncRNAs and known ASD risk genes into specific co-expression modules. Co-expression network analysis facilitates the discovery of associations between previously uncharacterized lncRNAs with known ASD risk genes, affected molecular pathways and at-risk developmental time points. In addition, we show that some of these lncRNAs have a high degree of overlap with major CNVs detected in ASD genetic studies. By utilizing this integrative approach comprised of differential expression analysis in affected tissues and connectivity metrics from a developmental co-expression network, we have prioritized a set of candidate ASD-associated lncRNAs. The identification of lncRNAs as novel ASD susceptibility genes could help explain the genetic pathogenesis of ASD.
Conflict of interest statement
Figures
Similar articles
-
Co-expression of long non-coding RNAs and autism risk genes in the developing human brain.BMC Syst Biol. 2018 Dec 14;12(Suppl 7):91. doi: 10.1186/s12918-018-0639-x. BMC Syst Biol. 2018. PMID: 30547845 Free PMC article.
-
Prediction and prioritization of autism-associated long non-coding RNAs using gene expression and sequence features.BMC Bioinformatics. 2020 Nov 7;21(1):505. doi: 10.1186/s12859-020-03843-5. BMC Bioinformatics. 2020. PMID: 33160303 Free PMC article.
-
Aberrant expression of long noncoding RNAs in autistic brain.J Mol Neurosci. 2013 Mar;49(3):589-93. doi: 10.1007/s12031-012-9880-8. Epub 2012 Sep 5. J Mol Neurosci. 2013. PMID: 22949041 Free PMC article.
-
Contribution of long noncoding RNAs to autism spectrum disorder risk.Int Rev Neurobiol. 2013;113:35-59. doi: 10.1016/B978-0-12-418700-9.00002-2. Int Rev Neurobiol. 2013. PMID: 24290382 Review.
-
Emerging Role of Non-coding RNAs in Autism Spectrum Disorder.J Mol Neurosci. 2022 Feb;72(2):201-216. doi: 10.1007/s12031-021-01934-3. Epub 2021 Nov 12. J Mol Neurosci. 2022. PMID: 34767189 Review.
Cited by
-
Anti-apoptotic capacity of MALAT1 on hippocampal neurons correlates with CASP3 DNA methylation in a mouse model of autism.Metab Brain Dis. 2023 Dec;38(8):2591-2602. doi: 10.1007/s11011-023-01285-5. Epub 2023 Sep 26. Metab Brain Dis. 2023. PMID: 37751122
-
Phenotypic Subtyping and Re-analyses of Existing Transcriptomic Data from Autistic Probands in Simplex Families Reveal Differentially Expressed and ASD Trait-Associated Genes.Front Neurol. 2020 Nov 12;11:578972. doi: 10.3389/fneur.2020.578972. eCollection 2020. Front Neurol. 2020. PMID: 33281715 Free PMC article.
-
Signalling pathways in autism spectrum disorder: mechanisms and therapeutic implications.Signal Transduct Target Ther. 2022 Jul 11;7(1):229. doi: 10.1038/s41392-022-01081-0. Signal Transduct Target Ther. 2022. PMID: 35817793 Free PMC article. Review.
-
Focus on your locus with a massively parallel reporter assay.J Neurodev Disord. 2022 Sep 9;14(1):50. doi: 10.1186/s11689-022-09461-x. J Neurodev Disord. 2022. PMID: 36085003 Free PMC article. Review.
-
Autism spectrum disorder: insights into convergent mechanisms from transcriptomics.Nat Rev Genet. 2019 Jan;20(1):51-63. doi: 10.1038/s41576-018-0066-2. Nat Rev Genet. 2019. PMID: 30390048 Review.
References
-
- Christensen DL, Baio J, Van Naarden Braun K, Bilder D, Charles J, Constantino JN, et al. Prevalence and characteristics of autism spectrum disorder among children aged 8 years—autism and developmental disabilities monitoring network, 11 sites, United States, 2012. MMWR Surveill Summ. 2016;65(3):1–23. doi: 10.15585/mmwr.ss6503a1 - DOI - PMC - PubMed
-
- Yu L, Wu YM, Wu BL. Genetic architecture, epigenetic influence and environment exposure in the pathogenesis of Autism. Sci China Life Sci. 2015;58(10):958–67. doi: 10.1007/s11427-015-4941-1 - DOI - PubMed
-
- Leblond CS, Nava C, Polge A, Gauthier J, Huguet G, Lumbroso S, et al. Meta-analysis of SHANK mutations in autism spectrum disorders: a gradient of severity in cognitive impairments. PLoS Genet. 2014;10(9):e1004580 doi: 10.1371/journal.pgen.1004580 - DOI - PMC - PubMed
-
- De Rubeis S, He X, Goldberg AP, Poultney CS, Samocha K, Cicek AE, et al. Synaptic, transcriptional and chromatin genes disrupted in autism. Nature. 2014;515(7526):209–15. doi: 10.1038/nature13772 - DOI - PMC - PubMed
-
- Voineagu I, Eapen V. Converging pathways in autism spectrum disorders: interplay between synaptic dysfunction and immune responses. Front Hum Neurosci. 2013;7:738 doi: 10.3389/fnhum.2013.00738 - DOI - PMC - PubMed
MeSH terms
Substances
Grants and funding
LinkOut - more resources
Full Text Sources
Other Literature Sources
