

Generation of carbamoyl phosphate synthetase 1 reporter cell lines for the assessment of ammonia metabolism
- PMID: 28557353
- PMCID: PMC5706564
- DOI: 10.1111/jcmm.13225
Generation of carbamoyl phosphate synthetase 1 reporter cell lines for the assessment of ammonia metabolism
Abstract
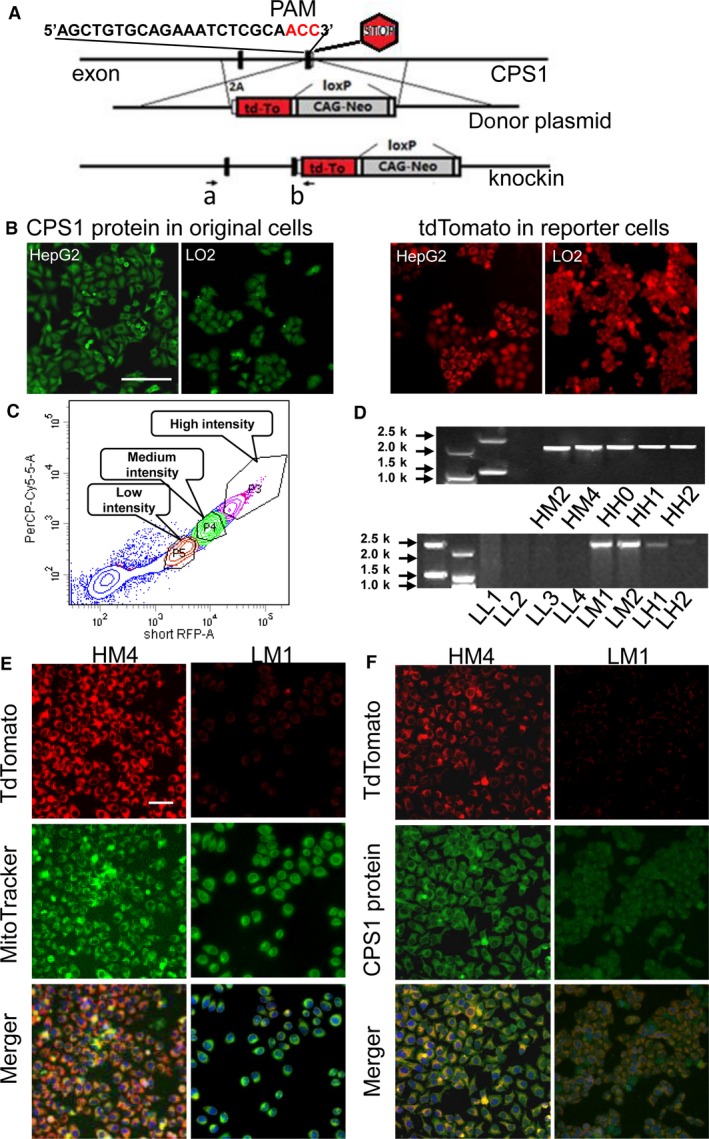
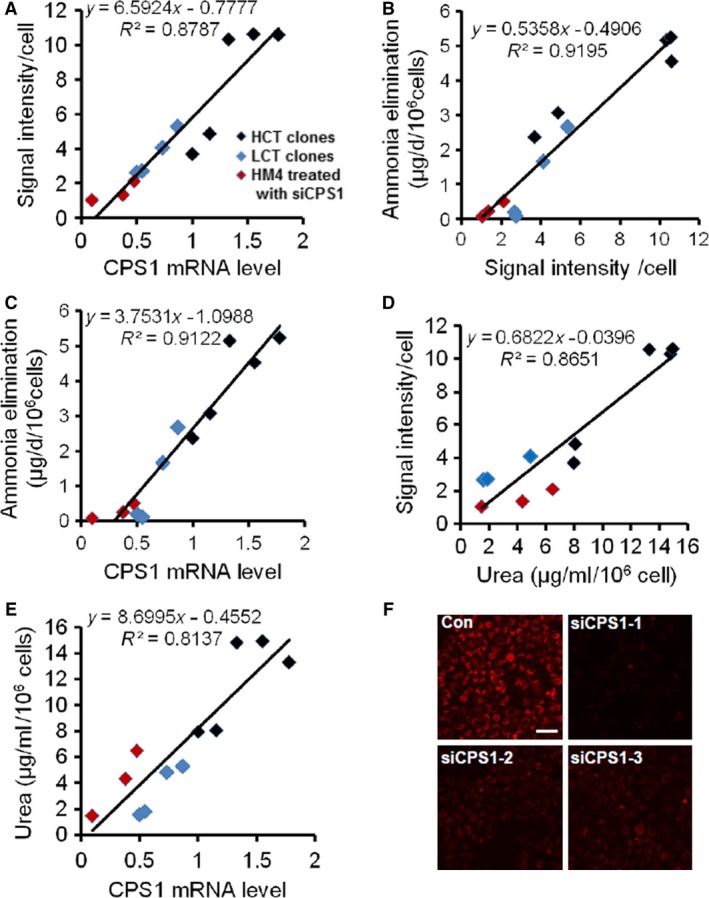
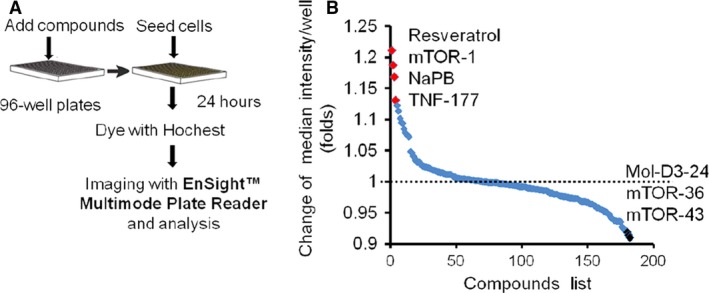
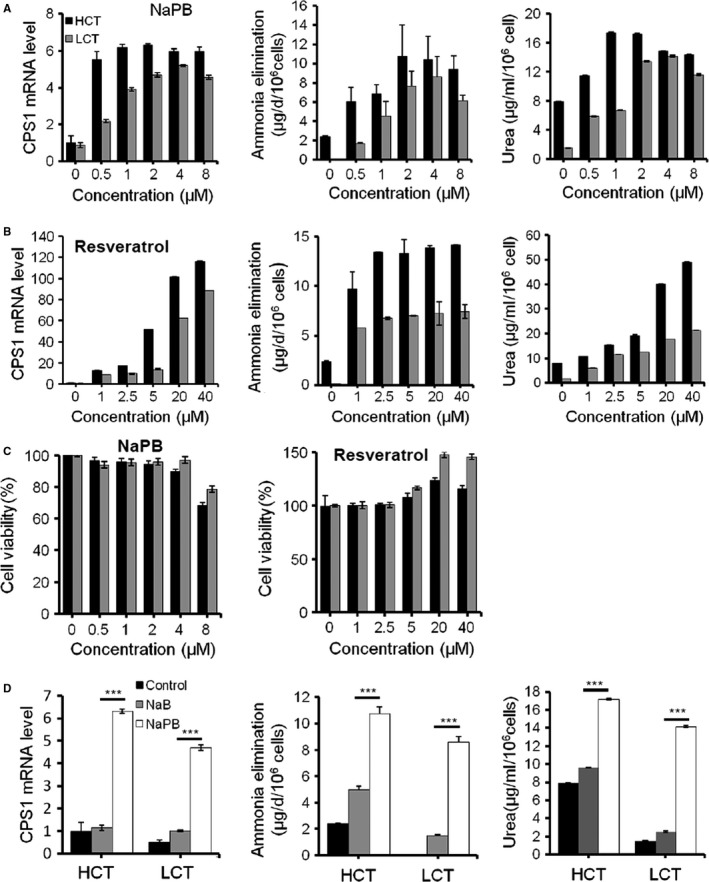
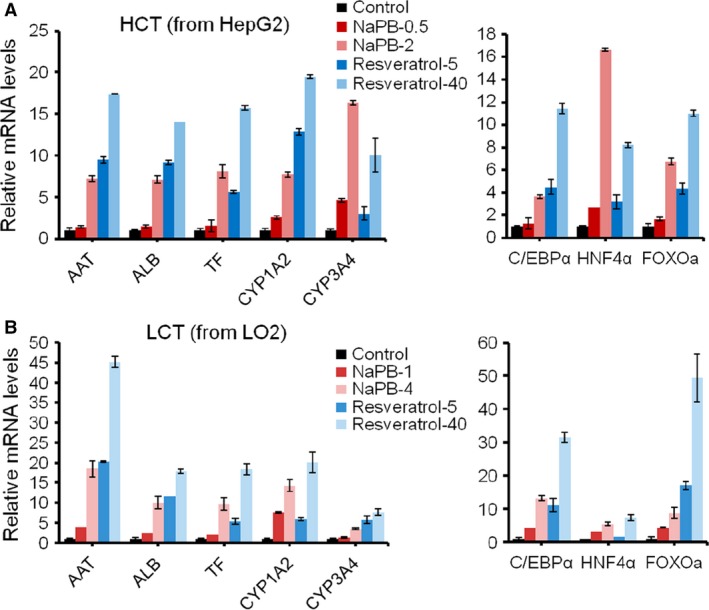
Both primary hepatocytes and stem cells-derived hepatocyte-like cells (HLCs) are major sources for bioartificial liver (BAL). Maintenance of hepatocellular functions and induction of functional maturity of HLCs are critical for BAL's support effect. It remains difficult to assess and improve detoxification functions inherent to hepatocytes, including ammonia clearance. Here, we aim to assess ammonia metabolism and identify ammonia detoxification enhancer by developing an imaging strategy. In hepatoma cell line HepG2, and immortalized hepatic cell line LO2, carbamoyl phosphate synthetase 1 (CPS1) gene, the first enzyme of ammonia-eliminating urea cycle, was labelled with fluorescence protein via CRISPR/Cas9 system. With the reporter-based screening approach, cellular detoxification enhancers were selected among a collection of 182 small molecules. In both CPS1 reporter cell lines, the fluorescence intensity is positively correlated with cellular CPS1 mRNA expression, ammonia elimination and secreted urea, and reflected ammonia detoxification in a dose-dependent manner. Surprisingly, high-level CPS1 reporter clones also reserved many other critical hepatocellular functions, for example albumin secretion and cytochrome 450 metabolic functions. Sodium phenylbutyrate and resveratrol were identified to enhance metabolism-related gene expression and liver-enriched transcription factors C/EBPα, HNF4α. In conclusion, the CPS1-reporter system provides an economic and effective platform for assessment of cellular metabolic function and high-throughput identification of chemical compounds that improve detoxification activities in hepatic lineage cells.
Keywords: Ammonia; CRISPR/CAS9; Carbamoyl phosphate synthetase 1; Hepatocellular functions; Resveratrol; Sodium phenylbutyrate.
© 2017 The Authors. Journal of Cellular and Molecular Medicine published by John Wiley & Sons Ltd and Foundation for Cellular and Molecular Medicine.
Figures

Similar articles
-
CPS1: Looking at an ancient enzyme in a modern light.Mol Genet Metab. 2020 Nov;131(3):289-298. doi: 10.1016/j.ymgme.2020.10.003. Epub 2020 Oct 10. Mol Genet Metab. 2020. PMID: 33317798 Free PMC article. Review.
-
Y-box binding protein-1 down-regulates expression of carbamoyl phosphate synthetase-I by suppressing CCAAT enhancer-binding protein-alpha function in mice.Gastroenterology. 2009 Jul;137(1):330-40. doi: 10.1053/j.gastro.2009.02.064. Epub 2009 Mar 9. Gastroenterology. 2009. PMID: 19272383
-
The activity of the carbamoyl phosphate synthase 1 promoter in human liver-derived cells is dependent on hepatocyte nuclear factor 3-beta.J Cell Mol Med. 2017 Sep;21(9):2036-2045. doi: 10.1111/jcmm.13123. Epub 2017 Mar 8. J Cell Mol Med. 2017. PMID: 28272778 Free PMC article.
-
Optimizing combination of liver-enriched transcription factors and nuclear receptors simultaneously favors ammonia and drug metabolism in liver cells.Exp Cell Res. 2018 Jan 15;362(2):504-514. doi: 10.1016/j.yexcr.2017.12.015. Epub 2017 Dec 16. Exp Cell Res. 2018. PMID: 29253535
-
Unraveling the therapeutic potential of carbamoyl phosphate synthetase 1 (CPS1) in human diseases.Bioorg Chem. 2023 Jan;130:106253. doi: 10.1016/j.bioorg.2022.106253. Epub 2022 Nov 5. Bioorg Chem. 2023. PMID: 36356370 Review.
Cited by
-
CRISPR/Cas9-based liver-derived reporter cells for screening of mPGES-1 inhibitors.J Enzyme Inhib Med Chem. 2019 Dec;34(1):799-807. doi: 10.1080/14756366.2019.1587416. J Enzyme Inhib Med Chem. 2019. PMID: 30879343 Free PMC article.
-
Caspase recruitment domain family member 10 regulates carbamoyl phosphate synthase 1 and promotes cancer growth in bladder cancer cells.J Cell Mol Med. 2019 Dec;23(12):8128-8138. doi: 10.1111/jcmm.14683. Epub 2019 Sep 29. J Cell Mol Med. 2019. PMID: 31565867 Free PMC article.
-
CPS1: Looking at an ancient enzyme in a modern light.Mol Genet Metab. 2020 Nov;131(3):289-298. doi: 10.1016/j.ymgme.2020.10.003. Epub 2020 Oct 10. Mol Genet Metab. 2020. PMID: 33317798 Free PMC article. Review.
References
-
- Prakash RMK. Mechanisms, diagnosis and management of hepatic encephalopathy. Nat Rev Gastroenterol Hepatol. 2010; 7: 515–25. - PubMed
-
- Struecker B, Raschzok N, Sauer IM. Liver support strategies: cutting‐edge technologies. Nat Rev Gastroenterol Hepatol. 2014; 11: 166–76. - PubMed
-
- Sussman NL, Kelly JH. Artificial liver. Clin Gastroenterol Hepatol. 2014; 12: 1439–42. - PubMed
-
- Rozga J. Liver support technology–an update. Xenotransplantation. 2006; 13: 380–9. - PubMed
MeSH terms
Substances
Grants and funding
LinkOut - more resources
Full Text Sources
Other Literature Sources
Research Materials
