

Contribution of systemic and somatic factors to clinical response and resistance to PD-L1 blockade in urothelial cancer: An exploratory multi-omic analysis
- PMID: 28552987
- PMCID: PMC5446110
- DOI: 10.1371/journal.pmed.1002309
Contribution of systemic and somatic factors to clinical response and resistance to PD-L1 blockade in urothelial cancer: An exploratory multi-omic analysis
Abstract
Background: Inhibition of programmed death-ligand 1 (PD-L1) with atezolizumab can induce durable clinical benefit (DCB) in patients with metastatic urothelial cancers, including complete remissions in patients with chemotherapy refractory disease. Although mutation load and PD-L1 immune cell (IC) staining have been associated with response, they lack sufficient sensitivity and specificity for clinical use. Thus, there is a need to evaluate the peripheral blood immune environment and to conduct detailed analyses of mutation load, predicted neoantigens, and immune cellular infiltration in tumors to enhance our understanding of the biologic underpinnings of response and resistance.
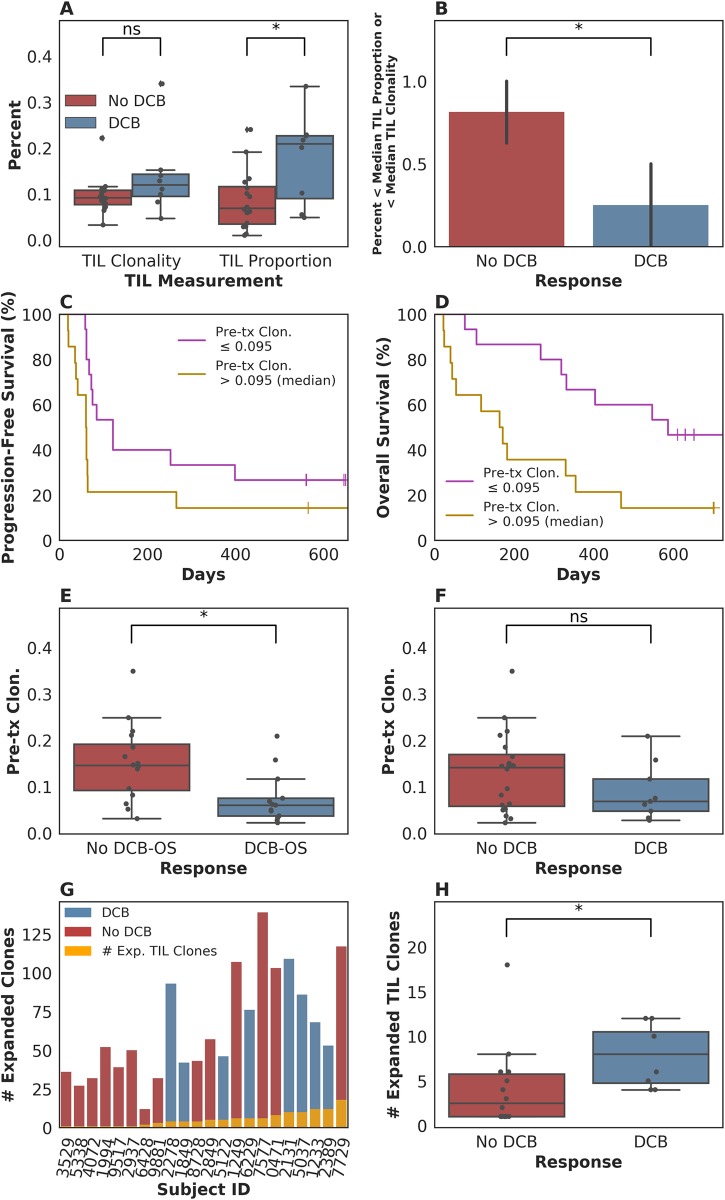
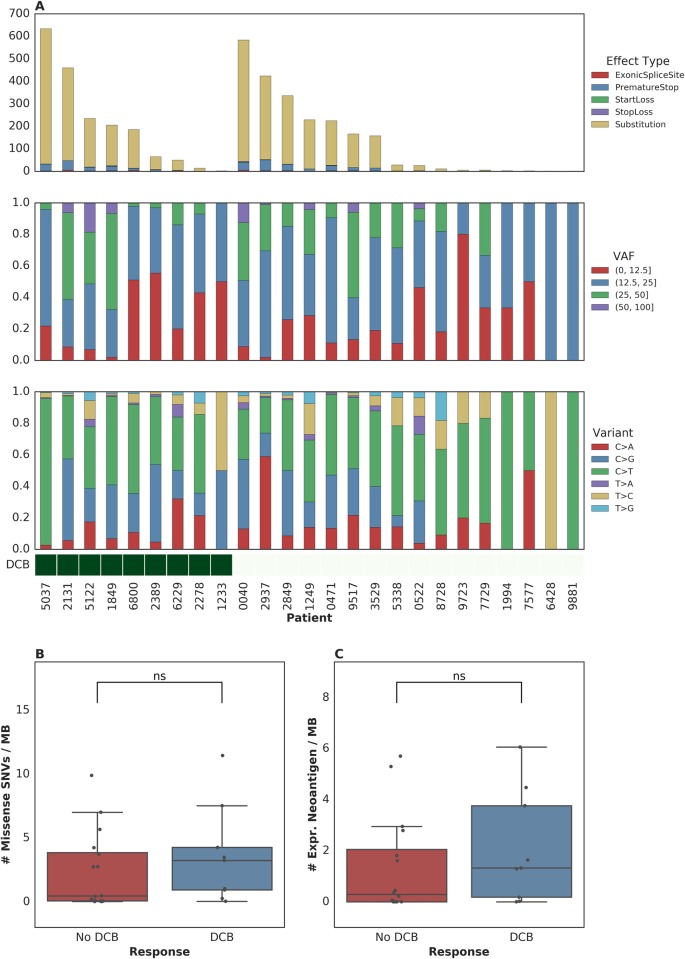
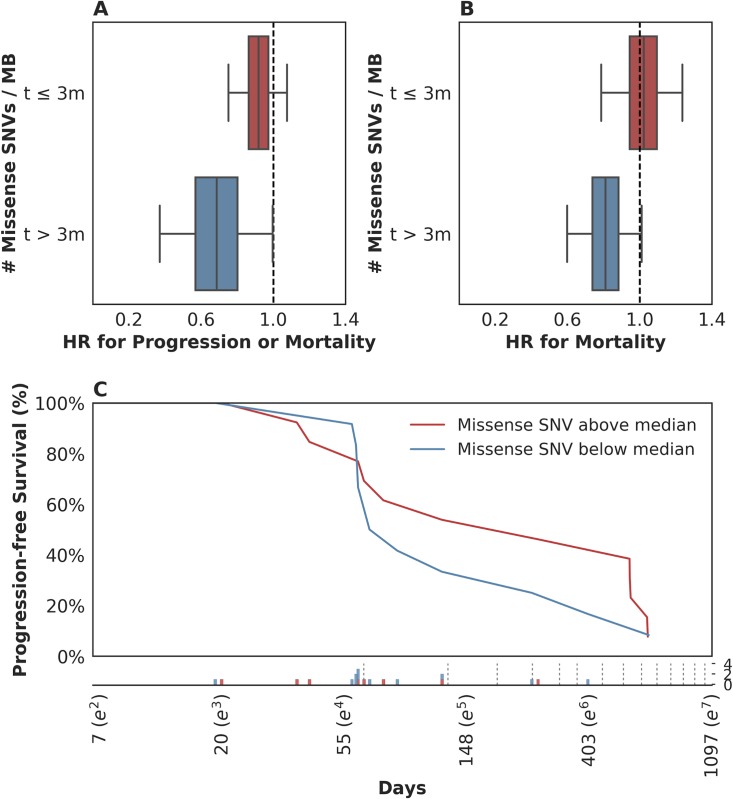
Methods and findings: The goals of this study were to (1) evaluate the association of mutation load and predicted neoantigen load with therapeutic benefit and (2) determine whether intratumoral and peripheral blood T cell receptor (TCR) clonality inform clinical outcomes in urothelial carcinoma treated with atezolizumab. We hypothesized that an elevated mutation load in combination with T cell clonal dominance among intratumoral lymphocytes prior to treatment or among peripheral T cells after treatment would be associated with effective tumor control upon treatment with anti-PD-L1 therapy. We performed whole exome sequencing (WES), RNA sequencing (RNA-seq), and T cell receptor sequencing (TCR-seq) of pretreatment tumor samples as well as TCR-seq of matched, serially collected peripheral blood, collected before and after treatment with atezolizumab. These parameters were assessed for correlation with DCB (defined as progression-free survival [PFS] >6 months), PFS, and overall survival (OS), both alone and in the context of clinical and intratumoral parameters known to be predictive of survival in this disease state. Patients with DCB displayed a higher proportion of tumor-infiltrating T lymphocytes (TIL) (n = 24, Mann-Whitney p = 0.047). Pretreatment peripheral blood TCR clonality below the median was associated with improved PFS (n = 29, log-rank p = 0.048) and OS (n = 29, log-rank p = 0.011). Patients with DCB also demonstrated more substantial expansion of tumor-associated TCR clones in the peripheral blood 3 weeks after starting treatment (n = 22, Mann-Whitney p = 0.022). The combination of high pretreatment peripheral blood TCR clonality with elevated PD-L1 IC staining in tumor tissue was strongly associated with poor clinical outcomes (n = 10, hazard ratio (HR) (mean) = 89.88, HR (median) = 23.41, 95% CI [2.43, 506.94], p(HR > 1) = 0.0014). Marked variations in mutation loads were seen with different somatic variant calling methodologies, which, in turn, impacted associations with clinical outcomes. Missense mutation load, predicted neoantigen load, and expressed neoantigen load did not demonstrate significant association with DCB (n = 25, Mann-Whitney p = 0.22, n = 25, Mann-Whitney p = 0.55, and n = 25, Mann-Whitney p = 0.29, respectively). Instead, we found evidence of time-varying effects of somatic mutation load on PFS in this cohort (n = 25, p = 0.044). A limitation of our study is its small sample size (n = 29), a subset of the patients treated on IMvigor 210 (NCT02108652). Given the number of exploratory analyses performed, we intend for these results to be hypothesis-generating.
Conclusions: These results demonstrate the complex nature of immune response to checkpoint blockade and the compelling need for greater interrogation and data integration of both host and tumor factors. Incorporating these variables in prospective studies will facilitate identification and treatment of resistant patients.
Conflict of interest statement
I have read the journal's policy and the authors of this manuscript have the following competing interests. ERM is a member of the Editorial Board of PLOS Medicine. SAF declared stock ownership in Kite Pharmaceuticals. MDH declared research grants from BMS and Genentech and paid consultancy from Genentech, Merck, BMS, AstraZeneca, Janssen and Neon. EY declared employment at Adaptive Biotechnologies. MV declared employment by Adaptive Biotechnologies Corp. with salary and stock options. SB declared ownership of stocks or shares and paid employment at Adaptive Biotechnologies. HR declared employment, equity ownership, patents, and royalties with Adaptive Biotechnologies. JER declared consultancy for Roche/Genetech, Bristol Myers Squibb, Oncogenex, Eli Lilly, AstraZeneca, Merck, Sanofi and Boehringer-Ingleheim, and stock in Merck and Illumina. DFB declared consultancy for Bristol Myers Squibb, Genentech-Roche, Pfizer, Merck, Novartis and Eli-Lilly; research support from Bristol Myers Squibb, Genentech-Roche, Merck, Novartis and Amgen; and travel support from Eli-Lilly, Genentech and Merck. AS declared research grants from BMS and paid consultancy for BMS and Driver. JER declared research grants from Neon and paid consultancy for AstraZeneca.
Figures

Similar articles
-
Atezolizumab in patients with locally advanced and metastatic urothelial carcinoma who have progressed following treatment with platinum-based chemotherapy: a single-arm, multicentre, phase 2 trial.Lancet. 2016 May 7;387(10031):1909-20. doi: 10.1016/S0140-6736(16)00561-4. Epub 2016 Mar 4. Lancet. 2016. PMID: 26952546 Free PMC article. Clinical Trial.
-
Association of Survival and Immune-Related Biomarkers With Immunotherapy in Patients With Non-Small Cell Lung Cancer: A Meta-analysis and Individual Patient-Level Analysis.JAMA Netw Open. 2019 Jul 3;2(7):e196879. doi: 10.1001/jamanetworkopen.2019.6879. JAMA Netw Open. 2019. PMID: 31290993 Free PMC article.
-
TGFβ attenuates tumour response to PD-L1 blockade by contributing to exclusion of T cells.Nature. 2018 Feb 22;554(7693):544-548. doi: 10.1038/nature25501. Epub 2018 Feb 14. Nature. 2018. PMID: 29443960 Free PMC article.
-
Immunotherapy in Urothelial Cancer: Recent Results and Future Perspectives.Drugs. 2017 Jul;77(10):1077-1089. doi: 10.1007/s40265-017-0748-7. Drugs. 2017. PMID: 28493171 Review.
-
Biomarkers for PD-1/PD-L1 Blockade Therapy in Non-Small-cell Lung Cancer: Is PD-L1 Expression a Good Marker for Patient Selection?Clin Lung Cancer. 2016 Sep;17(5):350-361. doi: 10.1016/j.cllc.2016.03.011. Epub 2016 Apr 6. Clin Lung Cancer. 2016. PMID: 27137346 Review.
Cited by
-
High Response Rate and Durability Driven by HLA Genetic Diversity in Patients with Kidney Cancer Treated with Lenvatinib and Pembrolizumab.Mol Cancer Res. 2021 Sep;19(9):1510-1521. doi: 10.1158/1541-7786.MCR-21-0053. Epub 2021 May 26. Mol Cancer Res. 2021. PMID: 34039647 Free PMC article. Clinical Trial.
-
Enhancer decommissioning by MLL4 ablation elicits dsRNA-interferon signaling and GSDMD-mediated pyroptosis to potentiate anti-tumor immunity.Nat Commun. 2022 Nov 2;13(1):6578. doi: 10.1038/s41467-022-34253-1. Nat Commun. 2022. PMID: 36323669 Free PMC article.
-
Genetic and non-genetic clonal diversity in cancer evolution.Nat Rev Cancer. 2021 Jun;21(6):379-392. doi: 10.1038/s41568-021-00336-2. Epub 2021 Mar 16. Nat Rev Cancer. 2021. PMID: 33727690 Review.
-
De novo prediction of cancer-associated T cell receptors for noninvasive cancer detection.Sci Transl Med. 2020 Aug 19;12(557):eaaz3738. doi: 10.1126/scitranslmed.aaz3738. Sci Transl Med. 2020. PMID: 32817363 Free PMC article.
-
A multifactorial model of T cell expansion and durable clinical benefit in response to a PD-L1 inhibitor.PLoS One. 2018 Dec 31;13(12):e0208422. doi: 10.1371/journal.pone.0208422. eCollection 2018. PLoS One. 2018. PMID: 30596661 Free PMC article.
References
-
- Powles T, Eder JP, Fine GD, Braiteh FS, Loriot Y, Cruz C, et al. MPDL3280A (anti-PD-L1) treatment leads to clinical activity in metastatic bladder cancer. Nature. 2014;515: 558–562. doi: 10.1038/nature13904 - DOI - PubMed
-
- Rosenberg JE, Hoffman-Censits J, Powles T, van der Heijden MS, Balar AV, Necchi A, et al. Atezolizumab in patients with locally advanced and metastatic urothelial carcinoma who have progressed following treatment with platinum-based chemotherapy: a single-arm, multicentre, phase 2 trial. Lancet. 2016;387: 1909–1920. doi: 10.1016/S0140-6736(16)00561-4 - DOI - PMC - PubMed
-
- Postow MA, Yuan J, Kitano S, Lesokhin AM, Wolchok JD. Markers for anti-cytotoxic T-lymphocyte antigen 4 (CTLA-4) therapy in melanoma. Methods Mol Biol. 2014;1102: 83–95. doi: 10.1007/978-1-62703-727-3_6 - DOI - PubMed
-
- Robins HS, Campregher PV, Srivastava SK, Wacher A, Turtle CJ, Kahsai O, et al. Comprehensive assessment of T-cell receptor beta-chain diversity in alphabeta T cells. Blood. 2009;114: 4099–4107. doi: 10.1182/blood-2009-04-217604 - DOI - PMC - PubMed
-
- Lefranc M-P, Giudicelli V, Duroux P, Jabado-Michaloud J, Folch G, Aouinti S, et al. IMGT®, the international ImMunoGeneTics information system® 25 years on. Nucleic Acids Res. 2015;43: D413–22. doi: 10.1093/nar/gku1056 - DOI - PMC - PubMed
Publication types
MeSH terms
Substances
Associated data
Grants and funding
LinkOut - more resources
Full Text Sources
Other Literature Sources
Research Materials
