. 2017 Jun 5;41(5):496-510.e5.
doi: 10.1016/j.devcel.2017.05.003. Epub 2017 May 25.

Lineage Establishment and Progression within the Inner Cell Mass of the Mouse Blastocyst Requires FGFR1 and FGFR2

Affiliations

Lineage Establishment and Progression within the Inner Cell Mass of the Mouse Blastocyst Requires FGFR1 and FGFR2

Minjung Kang et al. Dev Cell. .

Abstract

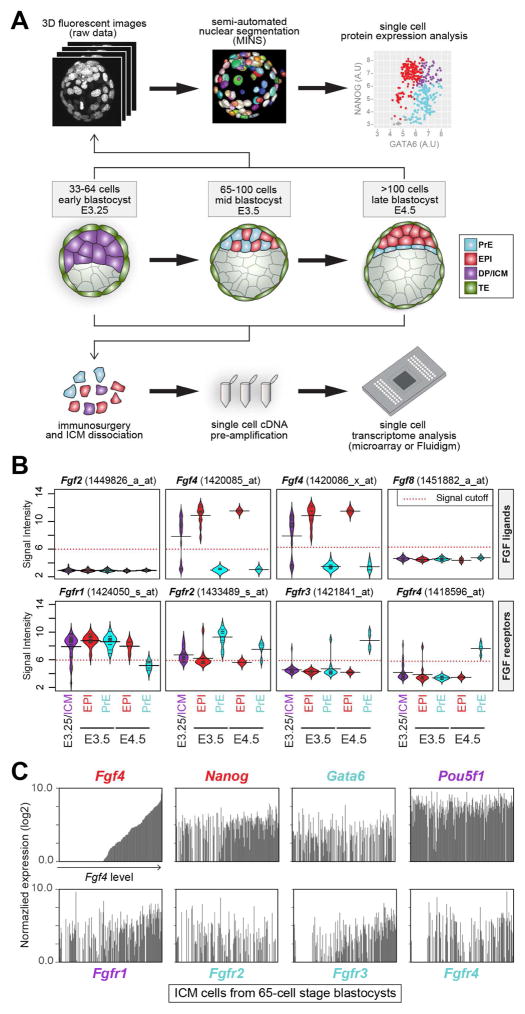
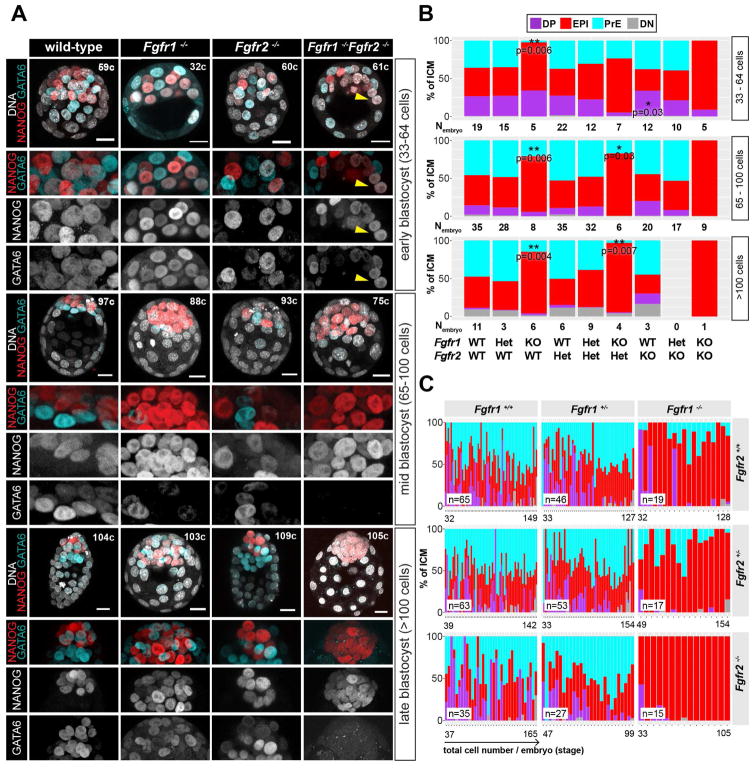
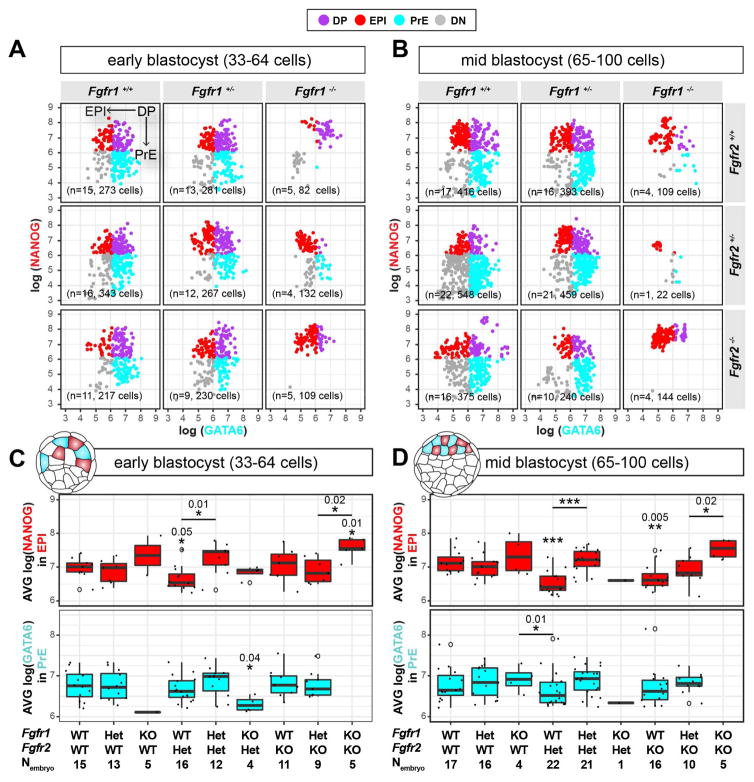
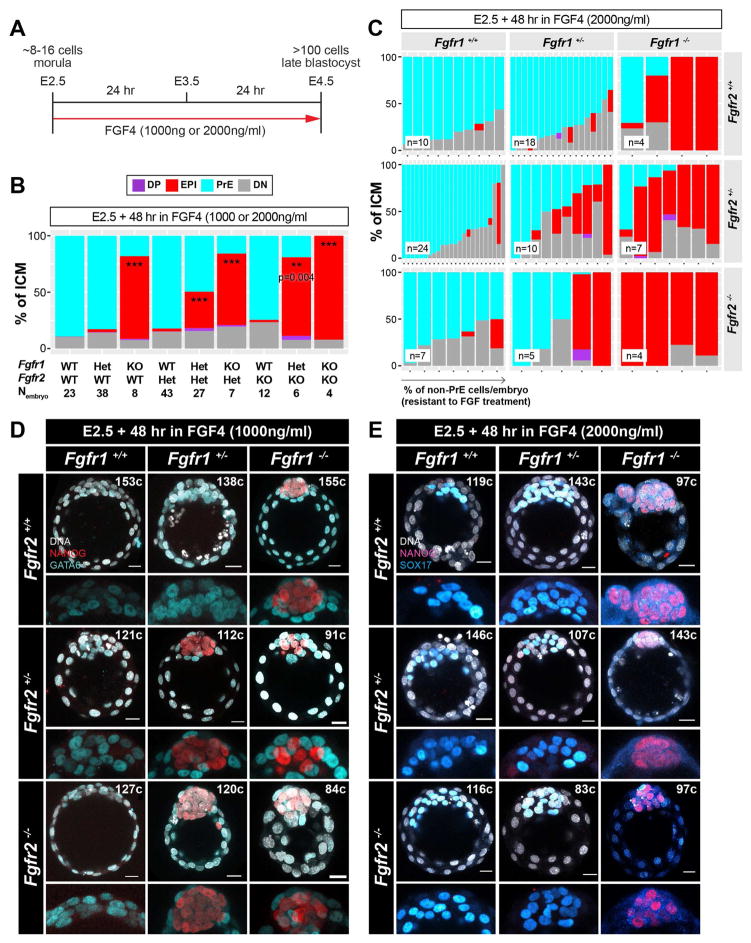
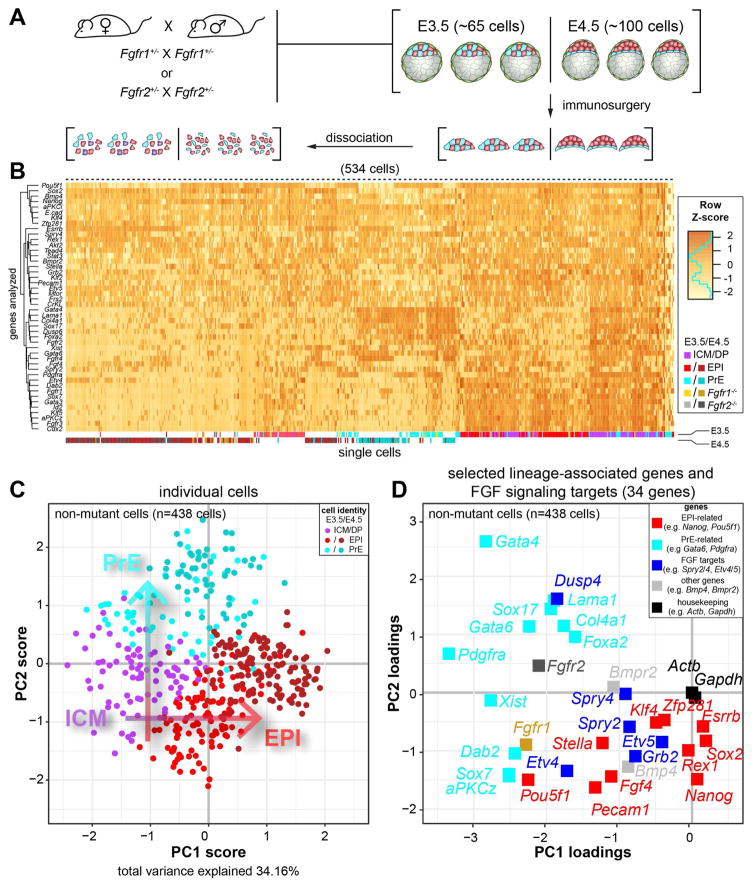
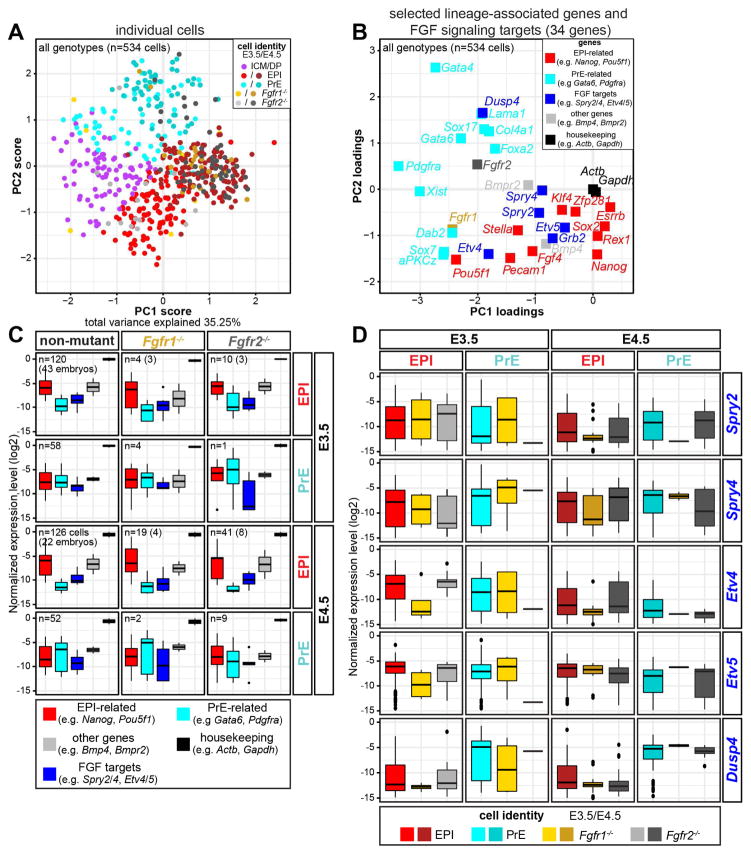
Fibroblast growth factor 4 (FGF4) is the key signal driving specification of primitive endoderm (PrE) versus pluripotent epiblast (EPI) within the inner cell mass (ICM) of the mouse blastocyst. To gain insight into the receptor(s) responding to FGF4 within ICM cells, we combined single-cell-resolution quantitative imaging with single-cell transcriptomics of wild-type and Fgf receptor (Fgfr) mutant embryos. Despite the PrE-specific expression of FGFR2, it is FGFR1, expressed by all ICM cells, that is critical for establishment of a PrE identity. Signaling through FGFR1 is also required to constrain levels of the pluripotency-associated factor NANOG in EPI cells. However, the activity of both receptors is required for lineage establishment within the ICM. Gene expression profiling of 534 single ICM cells identified distinct downstream targets associated with each receptor. These data lead us to propose a model whereby unique and additive activities of FGFR1 and FGFR2 within the ICM coordinate establishment of two distinct lineages.

Keywords: FGF; GATA6; NANOG; blastocyst; epiblast; inner cell mass; pluripotency; primitive endoderm; quantitative image analysis; single-cell transcriptomics.


Figures

Figure 1
Figure 1. Single-cell RNA and protein expression analysis of preimplantation mouse embryos
(A) Schematic representation of single-cell protein and gene expression analysis pipelines used in this study. MINS image analysis (top), single-cell targeted transcriptomics (bottom), and schematic of early to late blastocyst development (middle). For protein expression analysis (top), embryos of various stages were fixed, immunostained and imaged in 3D with a confocal microscope. Individual nuclei were segmented and relative fluorescence intensities of each channel measured. For single-cell RNA expression profiling (bottom), trophectoderm (TE, green) cells were removed by immunosurgery, and single ICM cells were mechanically dissociated. Single cells were collected for cDNA amplification and expression analysis. (B) Violin plots showing single-cell expression profiles of FGF ligands (top row) and receptors (bottom row) in preimplantation embryos at E3.25 (34–50 cells), E3.5 (63–91 cells) and E4.5 (163–227 cells) stages (raw data from (Ohnishi et al., 2014)). At E3.5 and E4.5, ICM cells were divided into two groups of EPI and PrE by an unsupervised cluster stability analysis of the 100 most variable genes in the dataset. The width of each violin represents the density distribution of the population. Red dotted lines mark the signal cut-off level (determined by Fgf4 expression levels in Fgf4−/− cells). Two different Fgf4 probes exhibit similar expression patterns. (C) Fluidigm-based gene expression analysis of single ICM cells (n=193, 38 embryos) from non-mutant (wild-type, Fgfr1+/− and Fgfr2+/−) embryos at the mid blastocyst stage (~65-cells) to show relative expression levels of lineage markers (Fgf4, Nanog, Gata6, Pdgfra) and all FGF receptors (Fgfr1–4). Each column represents a single cell. Cells are aligned based on level of Fgf4 expression. See also Figure S1.
Figure 2
Figure 2. Fgfr1−/−;Fgfr2−/− embryos initially activate GATA6 expression in uncommitted ICM/DP cells, but fail to maintain its expression to establish PrE lineage
(A) Maximum intensity projections of representative confocal images showing localization of cells expressing NANOG (red) and GATA6 (blue) in whole mount wild-type, Fgfr1−/−, Fgfr2−/− and Fgfr1−/−;Fgfr2−/− embryos at the early (33–64 cells), mid (65–100 cells) and late (>100 cells) blastocyst stages. DNA is stained with Hoechst 33342 (grayscale). High magnification images of the ICM depicting expression of NANOG (red) and GATA6 (blue) across the ICM population. Yellow arrowheads indicate double positive ICM cells. Single channel grayscale images of NANOG and GATA6 in magnified region show their distribution throughout the ICM. Scale bars represent 20μm. c, total number of cells in individual embryos. (B) Average ICM lineage composition (DP/PrE/EPI/DN), represented as percentage of ICM at the early (top row), mid (middle row), and late (bottom row) blastocyst stages. Each column shows average lineage composition of the ICM from all embryos for each genotype, indicated below. Nembryo indicates number of embryos analyzed for each genotype. Asterisks indicate statistical significance: p-values are as indicated (Wilcoxon test). Significance was tested against wild-type. (C) ICM lineage composition in individual embryos of each genotype shown in (B). Each column represents a single embryo; columns arranged by total cell number in ascending order, corresponding to developmental stage (left to right). The nine genotypes of the series are indicated. The total cell numbers of the smallest and largest embryos are indicated at bottom of each plot. The total numbers of embryos (n) analyzed for each genotype are indicated at bottom left corner of each plot. DP: double-positive (GATA6+, NANOG+), EPI: epiblast (NANOG+, GATA6−) PrE: primitive endoderm (GATA6+, NANOG) DN: double negative (GATA6, NANOG). See also Figure S2 and S3.
Figure 3
Figure 3. Single-cell quantitative protein expression analysis reveals that Fgfr1 is critical for EPI cells to maintain physiological levels of NANOG
(A, B) Scatter plots indicating levels of GATA6 and NANOG protein in individual ICM cells in embryos of each genotype at the 33–64 cell (A) and 65–100 cell (B) stages. For each genotype, numbers of embryos and ICM cells analyzed are indicated at the bottom-left of each plot. Lineage identity of each cell was assigned based on relative expression levels of NANOG and GATA6 (see STAR Methods for details). (C, D) Boxplots showing average expression NANOG in EPI [top] and GATA6 in PrE cells [bottom] of embryos of each genotype at the 33–64 cell (C) and 65–100 cell (D) stages. Data points represent average expression levels of all cells in each lineage and embryo. Top and bottom edges of boxes represent third and first quartiles, respectively. Middle lines mark the median. Top whiskers extend from third quartile to highest value within 1.5 * IQR (inter-quartile range); bottom whiskers extend from first quartile to lowest value within 1.5 * IQR. Open circles represent data beyond 1.5 * IQR. Color-coding of box plots is indicative of analyzed lineage as before, and as shown in embryo schemes. Nembryo indicates number of embryos analyzed of each genotype. Asterisks indicate statistical significance: p-values are as indicated or ***p<0.001 (Wilcoxon test), ns: not significant. Significance was tested against wild-type unless otherwise indicated with horizontal lines for the groups being compared. See also figure S2 and S3.
Figure 4
Figure 4. Exogenous FGF4 fails to induce PrE fate conversion throughout the ICM in the absence of Fgfr1
(A) Schematic of FGF4 treatment regime. Arrow represents length of culture in the presence of FGF4, from embryo collection (beginning of the arrow) until fixation (arrowhead). (B) Average ICM composition, represented as percentage of ICM cells (DP/PrE/EPI/DN) in embryos treated with exogenous FGF4 at 1000 or 2000ng/ml for 48 hours. Each column shows average lineage composition of the ICM in all embryos for each genotype, indicated below. Nembryo indicates number of embryos analyzed of each genotype. Asterisks indicate statistical significance: ***p<0.001 (Wilcoxon test). Significance was tested against wild-type. (C) ICM lineage composition in individual embryos of each genotype treated with FGF4 at 2000ng/ml. Each column represents an individual embryo, arranged by percent of non-PrE cells in ICM in ascending order, corresponding to their resistance to FGF treatment. The nine genotypes of the Fgfr1;Fgfr2 double mutant series are indicated. The total number of embryos analyzed per genotype is indicated at the bottom left corner of each plot. DP: double-positive (GATA6+, NANOG+), EPI: epiblast (NANOG+), PrE: primitive endoderm (GATA6+or SOX17+), DN: double negative (GATA6, SOX17, NANOG). (D–E) Representative immunofluorescence confocal images of Fgfr1;Fgfr2 mutant series treated with exogenous FGF4, showing localization of cells expressing NANOG and GATA6 (red and blue) (D), or NANOG and SOX17 (magenta and blue) (E). Scale bars represent 20μm. c, total number of cells in the embryo. See also Figure S4.
Figure 5
Figure 5. Fluidigm-based single-cell targeted transcriptome analysis of Fgfr1−/− and Fgfr2−/− single mutant embryos at mid and late blastocyst stages
(A) Schematic representation of experiment workflow. Mid and late stage blastocysts were collected from single heterozygous intercrosses, subjected to immunosurgery, followed by mechanical dissociation of single ICM cells, then used for targeted transcriptomic analysis (see STAR Methods for details). (B) Unsupervised hierarchal clustering of all single ICM cells (n= 534 cells, 83 embryos) at the mid (E3.5, ~65 cells) and late blastocyst (E4.5, ~100 cells) stages based on relative expression of all 48 genes analyzed. Accompanying heatmap shows relative expression levels of all the genes in individual cells color-coded by assigned z-scores based on expression level relative to mean expression (assigned a value of zero) across all samples (or cells) in a row (or gene). Cyan line in the color key reflects the population distribution across the z-scores. Cells were genotyped based on their average Fgfr1 and Fgfr2 expression per embryo (see STAR Methods for details). Each lineage is color-coded (DP: purple, EPI: red, PrE: cyan, Fgfr1−/−: gold, Fgfr2−/−: gray), and further divided into stages by shade (lighter: E3.5, darker: E4.5). Heatmap shows expression level of each gene in individual cells. (C) Principal component analysis (PCA) was performed with all collected non-mutant ICM cells using a subset of 34 genes that include lineage-associated genes, as well as genes relating to the downstream FGF pathway. All cells are color-coded by lineage. (D) PC projections of the 34 genes showing their relative contributions to variance displayed among samples in (C). A gene with a more positive PC loading value is more enriched in cells with more positive PC values in (C). Projecting all variables on the first two PCs identifies which genes have the highest weight (lineage-biased expression) for different clusters of samples depicted in Figure 5C. Positions of Fgfr1 and Fgfr2 are colored (gold and gray, respectively) and boxed. Genes are color-coded by association to a particular group (lineage, FGF target etc.). See also Figure S5.
Figure 6
Figure 6. EPI-related genes dominate expression over PrE-related genes in Fgfr1−/− ICM cells
(A) Principal component analysis (PCA) performed with all collected non-mutant single ICM cells and Fgfr1−/− and Fgfr2−/− cells using the 34 gene subset as in Figure 5C. All cells are color-coded by lineage as indicated. (B) PC projection of the 34 gene subset including expression levels in the Fgfr1−/− and Fgfr2−/− cells, showing the contribution of each gene towards PC1 and PC2 as in Figure 5D. (C) and (D) Boxplots showing normalized expression of indicated groups of genes averaged per cell in each lineage, genotype and stage. Each plot separates data by lineage. Boxes separate data by color-coded gene sets. Data points represent average expression of all specified genes per cell. Top and bottom edges of boxes represent third and first quartiles, respectively. Middle lines mark the median. Top whiskers extend from third quartile to highest value within 1.5 * IQR (inter-quartile range); bottom whiskers extend from first quartile to lowest value within 1.5 * IQR. Dots represent data beyond 1.5 * IQR. n, number of cells analyzed in each plot. See also Figure S6.
Figure 7
Figure 7. Working model. Two FGF receptors, FGFR1 and FGFR2, are required for the establishment and progression of both EPI and PrE lineages within the ICM of the mouse blastocyst
All ICM cells respond to FGF4. Schematic representation of range of pERK activity and NANOG levels during ICM cell fate establishment. At early blastocyst stages [top panel], a subset of uncommitted ICM/DP cells express Fgf4. This signal is transduced through FGFR1 by all ICM cells. FGFR1-expressing ICM cells sustain low ERK activity with robust negative feedback through ETVs and SPRYs, to maintain NANOG at physiological levels. Marginal levels of ERK activity and constrained NANOG ensure acquisition of an EPI fate by a subset of cells. [Middle panel] At the onset of Fgfr2 expression in presumptive PrE cells, more robust ERK activation through both FGFR1 and FGFR2 with less negative feedback via DUSPs extinguishes NANOG and maintains GATA6 expression, thereby activating the PrE program. The engagement of distinct feedbacks in each lineage results in varying levels of MAPK/ERK activity across the ICM population at the mid-blastocyst stage, promoting cells towards one versus the other lineage. Complete inhibition of FGF-ERK activity [bottom panel] results in non-physiological (high) levels of NANOG expression in all ICM cells, indicating that wild-type EPI cells transduce low levels of an FGF-ERK signal to constrain NANOG expression. In the absence of FGFR1, NANOG levels are high due to minimal levels of active ERK, and cells fail to downregulate NANOG concomitant with EPI maturation in wild-type embryos at the late blastocyst stage. Thus, ICM cells both fail to form PrE cells and a bona fide EPI lineage. Some Fgfr1−/− embryos are able to specify PrE cells since some uncommitted/DP cells in the ICM may have some ERK activity and NANOG levels within a range to turn on the PrE program upon the onset of Fgfr2 expression. By contrast, in Fgfr2−/− embryos FGF4 is exclusively transduced through FGFR1 and both EPI and PrE are specified, arguing FGFR2 functions as an ancillary receptor ensuring timely PrE establishment.

Similar articles

Cited by

References

    1. Artus J, Panthier JJ, Hadjantonakis AK. A role for PDGF signaling in expansion of the extra-embryonic endoderm lineage of the mouse blastocyst. Development. 2010;137:3361–72. doi: 10.1242/dev.050864. - DOI - PMC - PubMed
    1. Artus J, Piliszek A, Hadjantonakis AK. The primitive endoderm lineage of the mouse blastocyst: sequential transcription factor activation and regulation of differentiation by Sox17. Dev Biol. 2011;350:393–404. doi: 10.1016/j.ydbio.2010.12.007. - DOI - PMC - PubMed
    1. Behringer R, Gertsenstein M, Nagy KV, Nagy A. Manipulating the Mouse Embryo: A Laboratory Manual. 4. Cold Spring Harbor Laboratory Press; Cold Spring harbor, NY: 2014.
    1. Bessonnard S, De Mot L, Gonze D, Barriol M, Dennis C, Goldbeter A, Dupont G, Chazaud C. Gata6, Nanog and Erk signaling control cell fate in the inner cell mass through a tristable regulatory network. Development. 2014;141:3637–48. doi: 10.1242/dev.109678. - DOI - PubMed
    1. Boroviak T, Loos R, Lombard P, Okahara J, Behr R, Sasaki E, Nichols J, Smith A, Bertone P. Lineage-Specific Profiling Delineates the Emergence and Progression of Naive Pluripotency in Mammalian Embryogenesis. Dev Cell. 2015;35:366–82. doi: 10.1016/j.devcel.2015.10.011. - DOI - PMC - PubMed

Publication types

Substances