. 2017 Jun 5;41(5):511-526.e4.
doi: 10.1016/j.devcel.2017.05.004. Epub 2017 May 25.

Distinct Requirements for FGFR1 and FGFR2 in Primitive Endoderm Development and Exit from Pluripotency

Affiliations

Distinct Requirements for FGFR1 and FGFR2 in Primitive Endoderm Development and Exit from Pluripotency

Andrei Molotkov et al. Dev Cell. .

Abstract

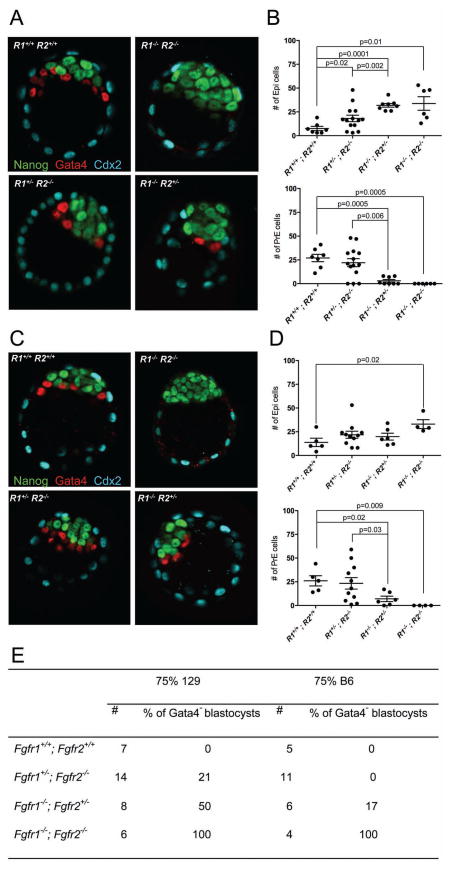
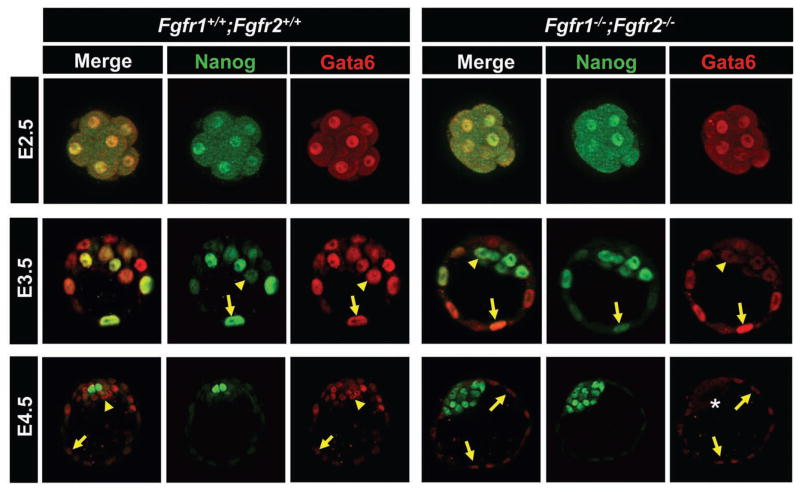
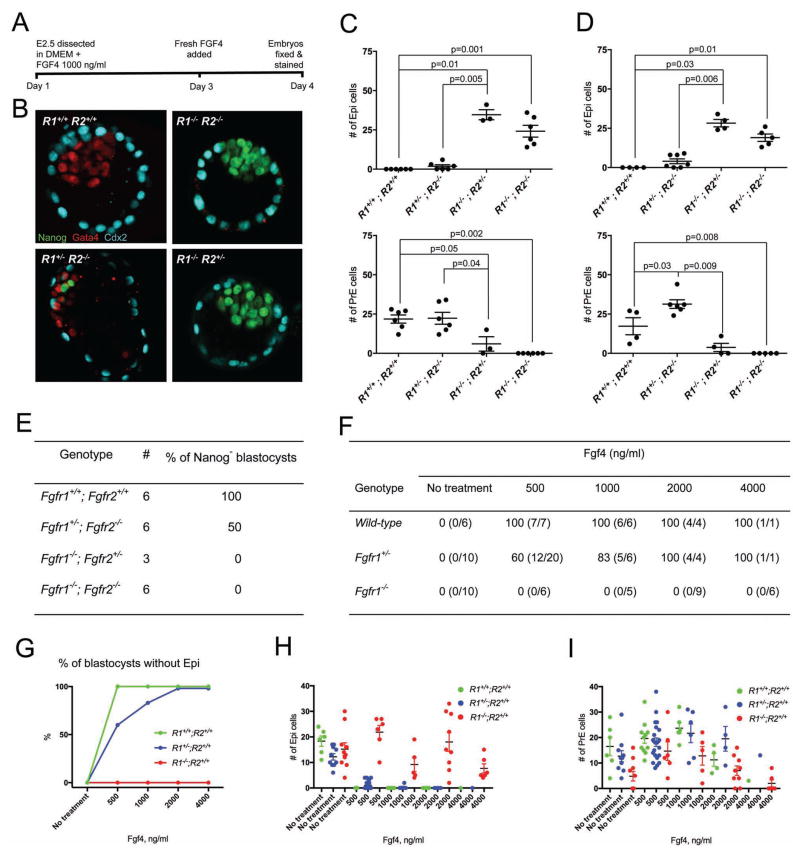
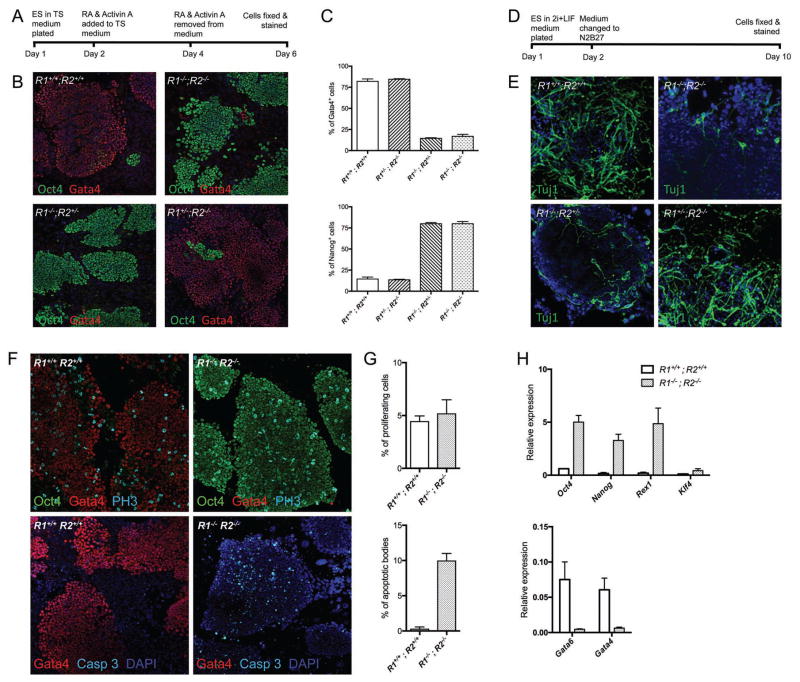
Activation of the FGF signaling pathway during preimplantation development of the mouse embryo is known to be essential for differentiation of the inner cell mass and the formation of the primitive endoderm (PrE). We now show using fluorescent reporter knockin lines that Fgfr1 is expressed in all cell populations of the blastocyst, while Fgfr2 expression becomes restricted to extraembryonic lineages, including the PrE. We further show that loss of both receptors prevents the development of the PrE and demonstrate that FGFR1 plays a more prominent role in this process than FGFR2. Finally, we document an essential role for FGFRs in embryonic stem cell (ESC) differentiation, with FGFR1 again having a greater influence than FGFR2 in ESC exit from the pluripotent state. Collectively, these results identify mechanisms through which FGF signaling regulates inner cell mass lineage restriction and cell commitment during preimplantation development.

Keywords: FGF; epiblast; pluripotency; primitive endoderm; signaling.


Figures

Figure 1
Figure 1. Fgfr1-Cerulean and Fgfr2-mCherry Expression in Preimplantation Development
(A) Schematic representation of Fgfr1-Cerulean and Fgfr2-mCherry reporter alleles. (B) Fgfr2-mCherry (red) is detected by direct fluorescence (df) in primitive endoderm (arrowhead) and trophectoderm (arrow) at E3.5. Note absence of Fgfr2-mCherry in epiblast (asterisk). (C) Fgfr1-Cerulean (blue) is detected by direct fluorescence (df) in all cell lineages at E3.5. Expression of Nanog (green, epiblast), Gata4 (red, primitive endoderm) and Cdx2 (white, trophectoderm) are shown; arrowhead, PrE. (D) Fgfr2-mCherry expression is detected in all cells of 8-cell embryos at E2.5 by labeling with antibodies (ab) to mCherry (green) and by direct fluorescence (df; red). Note that Cdx2 (cyan) is expressed in all cells at this stage. (E) At E3.25 Fgfr2-mCherry is strongly expressed in Cdx2 (cyan)+ TE cells while no Fgfr2-mCherry expression is detected in ICM cells by direct fluorescence. Note weak Fgfr2-mCherry labeling in ICM detected with antibodies. (F) At E3.25, at the onset of blastocoel development (asterisk), strong Fgfr2-mCherry was detected in Cdx2+ TE cells, while weak homogeneous Fgfr2-mCherry staining was detected in all ICM cells by antibody labeling. Note that no direct Fgfr2-mCherry fluorescence was detected in the ICM cells at this stage. (G) At E3.5 strong Fgfr2-mCherry expression was detected in subpopulation of ICM, possibly destined to become PrE cells (arrow). Note that weak direct Fgfr2-mCherry fluorescence is detected in developing PrE cells at this stage (arrow). (H, I) Fgfr2-mCherry expression strongly correlates with the Gata6 expression both in ICM and TE cells. (H) E3.5 blastocysts were stained with antibodies to mCherry (ab, green) and Gata6 (white); red shows direct mCherry fluorescence (df). DAPI (blue) was used to label nuclei. Individual channel images are shown. (I) Fgfr2 and Gata6 expression was measured using the MINS software (Lou et al., 2014). Note that ICM cells (top panel) are split into two populations: cells that are either negative or have weak Gata6/Fgfr2-mCherry expression (marked with yellow circle), and cells that express high levels of Gata6 and Fgfr2-mCherry. Note that TE cells have considerably higher Fgfr2-mCherry and Gata6 expression when compared to ICM cells, which is reflected by different X-axis scaling. (See also Figure S1).
Figure 2
Figure 2. Distinct Roles of Fgfr1 and Fgfr2 in Primitive Endoderm Development in 129 (A, B) and B6 (C, D) Genetic Backgrounds
(A) Localization of Nanog (green), Gata4 (red) and Cdx2 (cyan) in wild-type and Fgfr1−/−; Fgfr2−/−; Zp3+/Cre embryos on 129 genetic background. Note that a single copy of either Fgfr1 (R1+/−; R2−/−) or Fgfr2 (R1−/−; R2+/−) rescues primitive endoderm development. Embryos on the 129 genetic background contained a copy of Zp3Cre allele (A, B). (B) Quantitative analysis of number of Nanog+ (Epi) and Gata4+ (PrE) cells in Fgfr1 and Fgfr2 compound mutants. Note complete lack of Gata4+ cells in all double-null mutant embryos. A single allele of Fgfr1 was more efficient in rescuing primitive endoderm formation compared to a single allele of Fgfr2. (C) Similar to embryos on the 129 genetic background, all Fgfr1−/−; Fgfr2−/− embryos on the B6 background lack primitive endoderm indicated by loss of Gata4+ cells. Note that a single copy of either receptor rescues primitive endoderm formation. (D) On the B6 genetic background, Fgfr1 still plays a primary role in primitive endoderm development, while Fgfr2 contributes more significantly than in the 129 background. Data are represented as mean ± SEM. (E) Individual roles of Fgfr1 and Fgfr2 in primitive endoderm development in embryos on 129 and B6 genetic backgrounds. Total number of the embryos and present of embryos without PrE (Gata4) are shown for each genotype. (See also Figure S4, S5 and Table S1, S2, S3).
Figure 3
Figure 3. Primitive Endoderm Development Is Initiated but Not Maintained in Fgfr1−/−; Fgfr2−/− Embryos
Note Gata6 is expressed in all cells of Fgfr1+/+; Fgfr2+/+ and Fgfr1−/−; Fgfr2−/−; Zp3+/Cre embryos at E2.5 but is not found in inner cell mass of Fgfr1−/−; Fgfr2−/−; Zp3+/Cre at E4.5. For E2.5 and E3.5 stages embryos were fixed in PFA and analyzed immediately after dissection. For E4.5 stage embryos were dissected at E3.5 and were cultured for 48h in DMEM before analysis (see text for details). Localizations of Nanog (green), Gata4 (red) and Cdx2 (cyan) positive cells are shown. Arrowheads, Gata6 positive cells in ICM; arrows, Gata6 positive cells in TE; asterisk, absence of Gata6 positive cells in ICM of E4.5 embryos. (See also Figure S5).
Figure 4
Figure 4. Exogenous Fgf4 Fails to Rescue PrE Formation in Fgfr1−/−; Fgfr2−/− Embryos on 129 and B6 Genetic Backgrounds
(A) Time-line of the experiments. Embryos were dissected at E2.5 and were cultured in DMEM in the presence of Fgf4 (1000 ng/ml) and heparin (1 μg/ml) for 72h. (B) Localizations of Nanog (green), Gata4 (red) and Cdx2 (cyan) positive cells in Fgfr1+/+; Fgfr2+/+, Fgfr1−/−; Fgfr2−/−, Fgfr1+/−; Fgfr2−/− and Fgfr1−/−; Fgfr2+/− blastocysts are shown. Note that embryos on the 129 genetic background contained a copy of Zp3Cre allele. (C, D) Quantification of number of Nanog+ (Epi) and Gata4+ (PrE) cells in Fgfr1 and Fgfr2 compound mutants in embryos on 129 (C) and B6 (D) genetic backgrounds. Note stimulation with Fgf4 converted all ICM cells of Fgfr1+/+; Fgfr2+/+ blastocysts to Gata4+ PrE cells, while exogenous Fgf4 had no effect on the fate of the ICM cells in Fgfr1−/−; Fgfr2−/− blastocysts. Fgf4 stimulation was considerably more potent in embryos with a single wild-type allele of Fgfr1 than Fgfr2. Embryos on the 129 genetic background contained a copy of Zp3Cre allele. (E) Effect of exogenous Fgf4 (1000 ng/ml) on primitive endoderm development in Fgfr1 and Fgfr2 compound mutants. Total number of embryos and percent of embryos without epiblast (Nanog) are shown. (F) Effect of exogenous Fgf4 on primitive endoderm development in Fgfr1+/+ (wild type), Fgfr1+/ and Fgfr1−/− embryos. Percentage of embryos without Epi cells and number of embryos (in parenthesis) are shown. Note that these embryos are wild-type for Fgfr2. (G) Exogenous Fgf4 does not convert Epi cells into PrE cells in mouse embryos deficient for both copies of Fgfr1. Percent of embryos without Epi cells is shown. (H, I) Number of Epi (H) and PrE (I) cells in wild-type, Fgfr1+/−; Fgfr2+/+ and Fgfr1−/−; Fgfr2+/+ untreated embryos and embryos treated with Fgf4 (500 – 4000 ng/ml). Note Fgf4 at 500 and 1000 ng/ml increased the number of PrE cells in Fgfr1−/−; Fgfr2+/+ embryos (I) while the number of Epi cells was not decreased (H). Fgf4 at 2000 and 4000 ng/ml decreased the number of PrE cells in treated embryos. Data are represented as mean ± SEM.
Figure 5
Figure 5. Fgf Signaling Through Fgfrs Is Required for ES Cells to Exit from Pluripotency
(A) Time line of XEN cells derivation from ES cells. Fgfr1+/+; Fgfr2+/+, Fgfr1−/−; Fgfr2−/−, Fgfr1+/−; Fgfr2−/− and Fgfr1−/−; Fgfr2+/− ES cells were cultured on a layer of mitotically inactivated mouse embryonic fibroblasts; 24h after seeding, XEN cells derivation was induced by incubation with activin A and RA for 48h as described in methods. (B) Antibodies to Gata4 (red) and Oct4 (green) were used to label XEN cells and pluripotent ES cells, correspondingly. Note robust differentiation of wild-type ES cells in XEN cells while Fgfr1−/−; Fgfr2−/− ES cells had significantly reduced capacity to differentiate in XEN cells; a single wild-type allele of Fgfr1 but not Fgfr2 rescues differentiation of ES cells in XEN cells. (C) Results of the flow cytometry analysis of the XEN cells derivation. Data represents percentage of XEN cells (Gata4+ cells) and percentage of pluripotent ES cells (Nanog+ cells) at the end of the experiment. (D) Time line of ES cells neuronal differentiation; for neuronal differentiation Fgfr1+/+; Fgfr2+/+, Fgfr1−/−; Fgfr2−/−, Fgfr1+/−; Fgfr2−/− and Fgfr1−/−; Fgfr2+/− ES cells were cultured in feeder free conditions in N2B27 medium for 10 days (see methods for details). (E) Antibodies to Tuj1 were used to label neurons. Note robust differentiation of wild-type ES cells to neurons after 10 days; only few Tuj1+ neurons were formed by Fgfr1−/−; Fgfr2−/− ES cells; like XEN cells differentiation, a single wild-type allele of Fgfr1 was sufficient to completely rescue ES cell neuronal differentiation. (F) Proliferation (top panels) and apoptosis (bottom panel) of the ES cell derived XEN cells. On top panels, Oct4 (green) and Gata4 (red) were used to label undifferentiated ES cells and ES derived XEN cells. Proliferating cells were labeled with antibody to PH3 (cyan). On bottom panels, an antibody to Caspase 3 was used to label apoptotic bodies (cyan). Note multiple apoptotic bodies among the undifferentiated Fgfr1−/−; Fgfr2−/− ES cells. (G) Percent of proliferating cells (top) and apoptotic bodies (bottom) during ES cells differentiation into XEN cells. (H) Gene expression of the pluripotency markers (top panel) and XEN cell specific markers (bottom panel) analyzed by qPCR. Note Fgfr1−/−; Fgfr2−/− ES cells maintain expression of the pluripotency factors and fail to up regulate expression of XEN cell specific genes (Gata6 and Gata4). Data are represented as mean ± SEM. (See also Figure S6).
Figure 6
Figure 6. qPCR analysis of gene expression changes in wild-type and Fgfr1−/−; Fgfr2−/− ES cells released from Serum + LIF + 2i conditions
Wild-type and Fgfr1−/−; Fgfr2−/− ES cells were maintained in Serum (Ser) + LIF + 2i medium (see methods for details). To release from pluripotency the cells were placed in N2B27 medium for 48h and gene expression changes were analyzed by qPCR. Expression of β2-microglobulin was used to normalize cDNA amount. (For primer information see Table S6). Data are represented as mean ± SEM. (A) Expression of “naïve” pluripotency factors (Smith, 2017). (B) Expression of “general” pluripotency factors. (C) Expression of “formative” phase factors.
Figure 7
Figure 7. Instructive and Permissive Roles of Fgf Signaling During Preimplantation Development
At E2.5–E3.25 (nascent blastocysts), ICM cells are bi-potential and express both Epi (Nanog) and PrE (Gata6) cell markers as well as Fgfr1. At some point, ICM cells make a decision to express Fgf4, at varying levels (Fgf4high and Fgf4low). Our results suggest that this initial decision is independent of Fgf signaling. Fgf4 produced by ICM cells activates Fgf signaling by binding either to Fgfr1 (primary receptor) or Fgfr2 (non-essential, secondary receptor) and induces the PrE fate. Depending on the number of Fgf4 producing cells and the level of secreted Fgf4, more or fewer ICM cells become PrE, as supported by exposure to exogenous Fgf4 (mid blastocyst). Later in development (implanting blastocyst), Fgf4 autocrine signaling through Fgfr1 permits exit of Epi cells from pluripotency and differentiation towards embryonic lineages, as supported by ES cell differentiation assays. It is also possible that Fgf4 paracrine signaling through Fgfr1 and Fgfr2 regulates PrE cell proliferation/survival.

Similar articles

Cited by

References

    1. Arman E, Haffner-Krausz R, Chen Y, Heath JK, Lonai P. Targeted disruption of fibroblast growth factor (FGF) receptor 2 suggests a role for FGF signaling in pregastrulation mammalian development. Proceedings of the National Academy of Sciences of the United States of America. 1998;95:5082–5087. - PMC - PubMed
    1. Artus J, Kang M, Cohen-Tannoudji M, Hadjantonakis AK. PDGF signaling is required for primitive endoderm cell survival in the inner cell mass of the mouse blastocyst. Stem cells (Dayton, Ohio) 2013;31:1932–1941. - PMC - PubMed
    1. Artus J, Panthier JJ, Hadjantonakis AK. A role for PDGF signaling in expansion of the extra-embryonic endoderm lineage of the mouse blastocyst. Development (Cambridge, England) 2010;137:3361–3372. - PMC - PubMed
    1. Artus J, Piliszek A, Hadjantonakis AK. The primitive endoderm lineage of the mouse blastocyst: sequential transcription factor activation and regulation of differentiation by Sox17. Developmental biology. 2011;350:393–404. - PMC - PubMed
    1. Bessonnard S, De Mot L, Gonze D, Barriol M, Dennis C, Goldbeter A, Dupont G, Chazaud C. Gata6, Nanog and Erk signaling control cell fate in the inner cell mass through a tristable regulatory network. Development (Cambridge, England) 2014;141:3637–3648. - PubMed

Publication types

MeSH terms

Substances