. 2017 May 26:8:15503.
doi: 10.1038/ncomms15503.

The distinct metabolic phenotype of lung squamous cell carcinoma defines selective vulnerability to glycolytic inhibition

Affiliations

The distinct metabolic phenotype of lung squamous cell carcinoma defines selective vulnerability to glycolytic inhibition

Justin Goodwin et al. Nat Commun. .

Abstract

Adenocarcinoma (ADC) and squamous cell carcinoma (SqCC) are the two predominant subtypes of non-small cell lung cancer (NSCLC) and are distinct in their histological, molecular and clinical presentation. However, metabolic signatures specific to individual NSCLC subtypes remain unknown. Here, we perform an integrative analysis of human NSCLC tumour samples, patient-derived xenografts, murine model of NSCLC, NSCLC cell lines and The Cancer Genome Atlas (TCGA) and reveal a markedly elevated expression of the GLUT1 glucose transporter in lung SqCC, which augments glucose uptake and glycolytic flux. We show that a critical reliance on glycolysis renders lung SqCC vulnerable to glycolytic inhibition, while lung ADC exhibits significant glucose independence. Clinically, elevated GLUT1-mediated glycolysis in lung SqCC strongly correlates with high 18F-FDG uptake and poor prognosis. This previously undescribed metabolic heterogeneity of NSCLC subtypes implicates significant potential for the development of diagnostic, prognostic and targeted therapeutic strategies for lung SqCC, a cancer for which existing therapeutic options are clinically insufficient.


Conflict of interest statement

The authors declare no competing financial interests.

Figures

Figure 1
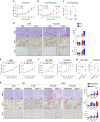
Figure 1. GLUT1 is highly expressed in lung SqCC compared to lung ADC.
(a) Comparison of GLUT1 expression between 517 ADC and 501 SqCC tumour samples from the TCGA mRNA sequencing data (104 normalized transcripts per million mappable read (TPM)). Error bars represent the median±quartile range, Mann–Whitney u-test, ****P<0.0001. (b) Expression of all GLUT isoform mRNA (104 normalized transcripts TPM) in TCGA ADC and SqCC tumour samples. Mann–Whitney u-test, ****P<0.0001. (c,d) Representative IHC images and quantification of GLUT1 expression in human patient clinical samples of ADC and SqCC. ****P<0.0001. (e) Comparison of GLUT1 mRNA expression from human NSCLC tumour samples and matched normal lung tissue samples. ****P<0.0001, ***P<0.001. (f) Representative IHC images of GLUT1, CK5 and p63 expression in human ADC and SqCC tissue microarray tumour cores (left). Low-magnification scale bar, 300 μm; high-magnification scale bar, 50 μm. Quantification of GLUT1-positive staining in ADC and SqCC microarray samples (right). ***P<0.001. (g) Representative IHC images (left) and quantification (right) of GLUT1 expression in SqCC patient-derived xenograft tumours compared to ADC patient-derived xenograft tumours. **P<0.01. (h) Representative GLUT1, p63 and TTF1 IHC images of KL ADC and SqCC tumours. Scale bars, 200 μm. All error bars represent the mean±s.e.m., and two-tailed t-test was used unless noted otherwise. All scale bars, 50 μm unless otherwise noted.
Figure 2
Figure 2. GLUT1 expression and glucose uptake in lung SqCC cell lines.
(a) qRT–PCR analysis comparing GLUT1 mRNA expression in a panel of ADC and SqCC cell lines (n=6–8 per cell line from three biologically independent experiments). (b) Immunoblot analysis of GLUT1 expression in ADC and SqCC cell lines. (c) Representative GLUT1 immunocytochemistry images (left) and fluorescent quantification (right) of GLUT1 staining (n=3, 7–10 images from each experiment were captured for quantification). ***P<0.001, **P<0.01, *P<0.05. (d) Representative fluorescent images (left) and quantification (right) of fluorescent glucose uptake in ADC and SqCC cell lines (n=3, 7–10 images from each experiment were captured for quantification). ***P<0.001, **P<0.01. All error bars represent the mean±s.e.m., and one-way ANOVA was used. All scale bars, 25 m.
Figure 3
Figure 3. GLUT1 knockdown inhibits lung SqCC tumour growth.
(a) Immunoblot analysis of GLUT1 expression in control shGFP and shGLUT1 HCC95 and HCC1588 cells. (b) In vitro proliferation of control shGFP and shGLUT1 HCC95 and HCC1588 cells (n=6 from two biologically independent experiments for each construct). Two-way ANOVA, ****P<0.0001. (c) Cell viability was assayed via Annexin-V and 7-AAD staining in control shGFP and shGLUT1 HCC95 and HCC1588 cells (n=3 from three biologically independent experiments for each construct). ANOVA, ****P<0.0001, ***P<0.001, **P<0.01. (d) Representative fluorescent images (top), and quantification (bottom) of fluorescent glucose uptake in shGFP and shGLUT1 HCC95 and HCC1588 cells (n=3, six to nine images were captured in each group for quantification). One-way ANOVA, ****P<0.0001. Scale bar, 25 μm. (e,f) Comparison of relative intracellular ATP (e), NADH and NADPH (f) levels between shGFP and shGLUT1 HCC95 and HCC1588 cells (n=6 each group from two to three biologically independent experiments). Two-tailed t-test, ****P<0.0001, ***P<0.001, **P<0.01, *P<0.05. (g) In vivo tumour growth (left) and representative GLUT1 IHC images (right) of shGFP and shGLUT1 HCC95 xenograft tumours (n=3–5 for each group). Scale bar, 100 μm. Two-way ANOVA, *P<0.05. All error bars represent the mean±s.e.m.
Figure 4
Figure 4. Lung SqCC relies on glucose for cellular bioenergetics.
(a) Heatmap depicting expression distribution of genes from the highlighted metabolic gene sets enriched in the TCGA cohort of SqCC patients. (b) GSEA mountain plot depicting significantly enriched glycolytic gene expression as defined by the KEGG gene set. P<0.001; NES, normalized enrichment score. (c) Glycolytic gene expression (normalized TPM) of TCGA SqCC (n=501) and ADC (n=517) patients. Mann–Whitney u-test, ****P<0.0001. (d,e) Extracellular lactate concentration (d) and O2 consumption rate (e) in ADC (A549 and H522) and SqCC (HCC95 and HCC1588) cell lines cultured in 25 and 5 mM glucose concentrations for 24 h (n=6–9 each group from two to three biologically independent experiments). Two-tailed t-test, ***P<0.001, *P<0.05. (fh) Comparison of relative intracellular ATP (f), NADH (g) and NADPH (h) between cells cultured in 25 and 5 mM glucose concentrations for 24–72 h (n=9 each group from three biologically independent experiments). Two-tailed t-test, **P<0.01, *P<0.05. (i) Cell viability of ADC and SqCC cell lines cultured in decreasing glucose concentrations for 72–96 h (n=3–4 each group from at least two biologically independent experiments). One-way ANOVA ***P<0.001, **P<0.01, *P<0.05. (j) Extracellular acidification rate (left) and O2 consumption rate (right) of ADC (A549 and H522) and SqCC (HCC95 and HCC1588) cell lines in 5 mM glucose after 1-h glucose starvation. ANOVA, ****P<0.0001. (k) Cell viability was assayed via Annexin-V and 7-AAD staining in cells treated with glycolytic inhibitor, 2-DG (25 mM) for 72 h (n=6 each group from three to four biologically independent experiments). ANOVA, ****P<0.0001, **P<0.01, *P<0.05. (l) Quantification of fluorescent glucose uptake in ADC (A549) and SqCC (HCC95, HCC1588 and HCC2814) cell lines after 1-h treatment with GLUT1 inhibitor WZB117 (50 μM; n=2–3, 10–15 images from each experiment were captured for quantification from at least two biologically independent experiments). (m) Extracellular acidification rate of ADC (A549 and H522) and SqCC (HCC95 and HCC1588) cell lines treated with 100 μM WZB117 in 5 mM glucose media (n=2 from two biologically independent experiments). (n) Cell viability was assayed via Annexin-V and 7-AAD staining in cells treated with GLUT1 inhibitor WZB117 (50 μM) for 48 h (n=6 each group from three to four biologically independent experiments). ANOVA, ****P<0.0001. All error bars represent the mean±s.e.m.
Figure 5
Figure 5. Lung SqCC is susceptible to glycolytic inhibition.
(a,b) Xenograft tumour growth of A549 ADC (PBS, n=9; 2-DG, n=5; a) and HCC1588 SqCC (PBS, n=12; 2-DG, n=12; b) treated with PBS as control or glycolytic inhibitor 2-DG (500 mg kg−1, once daily). Two-way ANOVA, *P<0.05. (c) Tumour weights of PBS- or 2-DG-treated xenograft tumours. Two-tailed t-test, **P<0.01. (d) IHC analysis (left) and quantification of % area (right) of necrosis, proliferative marker Ki67 and cleaved caspase-3 (CC3) in PBS (A549, n=9; HCC1588, n=12) or 2-DG (A549, n=5; HCC1588, n=12)-treated xenograft tumours. Eight to ten images in each tumour were captured and analysed for quantification. Two-tailed t-test, **P<0.01, *P<0.05. (e,f) Xenograft tumour growth of ADC A549 (PBS, n=11; WZB117, n=6) and H1299 (PBS, n=5; WZB118, n=5; e) and SqCC HCC1588 (PBS, n=6; WZB117, n=6) and HCC2814 (PBS, n=5; WZB117, n=4; f) treated with PBS/DMSO as vehicle or GLUT1 inhibitor, WZB117 (10 mg kg−1, once daily). Two-way ANOVA, ****P<0.0001, ***P<0.001, *P<0.05. (g) Tumour weights of PBS/DMSO or WZB117-treated SqCC HCC1588 (left) and HCC2814 (right) xenograft tumours. Two-tailed t-test. **P<0.01. (h) IHC analysis (left) and quantification of % area (right) of necrosis, proliferative marker Ki67 and CC3 in PBS/DMSO (A549, n=11; H1299, n=5; HCC1588, n=6; HCC2814, n=5) or WZB117 (A549, n=6; H1299, n=5; HCC1588, n=5; HCC2814, n=4)-treated xenograft tumours. Eight to ten images in each tumour were captured and analysed for quantification. Two-tailed t-test. **P<0.01, *P<0.05. All error bars represent the mean±s.e.m. Scale bars, 100 μm.
Figure 6
Figure 6. Increased 18F-FDG uptake in lung SqCC.
(a) Representative 18F-FDG-PET/μCT overlays comparing KL animals with only ADC tumours (left) and animals possessing SqCC tumours (right). H, heart. Scale Bar, 4 mm. (b,c) Correlative analysis between SUVmax and % area of SqCC tumours (b) and total tumour burden (c). Pearson and Spearman R-values and probabilities are presented for correlations. (d) 18F-FDG uptake in the areas of SqCC and ADC within the same KL tumour-bearing mouse. Scale bar, 3 mm. Histological phenotype (SqCC or ADC) was determined by IHC analysis of p63 (SqCC) and SP-C (ADC). Scale bar, 50 μm. H, Heart. (e) 18F-FDG uptake of representative human ADC (case 4, Supplementary Table 1) and SqCC (case 19, Supplementary Table 1) patients. H, heart. (f) Comparison of SUVmax between ADC and SqCC patients. Each box represents the lower quartile, median and upper quartile, and whiskers represent the 10th and 90th percentiles of the data. Two-tailed t-test. **P<0.01.
Figure 7
Figure 7. Elevated PIK3/AKT/HIF-1α pathways in KL SqCC tumours.
(a,b) Analysis of TCGA gene expression (normalized TPM) and PIK3CA (a) and PTEN (b) genomic copy number alteration profiles. Each dot represents one SqCC patient (n=501). Boxes represent the interquartile range and whiskers are drawn to the minimum and maximum. Kruskal–Wallis non-parametric ANOVA, ****P<0.0001, ***P<0.001, **P<0.01. (c) IHC analysis (top) and quantification (bottom) of p63, p-AKT, p-S6, p-4EBP1, HIF-1α and GLUT1 in KL tumours (n=6 each group). Two-tailed t-test, ****P<0.0001, ***P<0.001, **P<0.01. Scale bar, 50 μm. (d) Immunoblot analysis of HIF-1α and GLUT1 in control shGFP and shHIF-1α knockdown SqCC cell lines, HCC95 and HCC1588. All error bars represent the mean±s.e.m.
Figure 8
Figure 8. High GLUT1 expression is associated with poor prognosis.
(a) Kaplan–Meier 5-year survival analysis comparing GLUT1 high and low expressing patients in the TCGA lung SqCC cohort. GLUT1 high and low groups were separated by the median expression. Significance was determined with log-rank test. P=0.04; HR, 1.34. (b) Comparison of GLUT1 expression (normalized TPM) in patients with smoking history in TCGA NSCLC cohort. Each dot represents one patient (n=1018). Error bars represent the median±interquartile range. Mann–Whitney u-test. ****P<0.0001.

Similar articles

Cited by

References

    1. Chen Z., Fillmore C. M., Hammerman P. S., Kim C. F. & Wong K. K. Non-small-cell lung cancers: a heterogeneous set of diseases. Nat. Rev. Cancer 14, 535–546 (2014). - PMC - PubMed
    1. Drilon A., Rekhtman N., Ladanyi M. & Paik P. Squamous-cell carcinomas of the lung: emerging biology, controversies, and the promise of targeted therapy. Lancet Oncol. 13, e418–e426 (2012). - PubMed
    1. Sun S., Schiller J. H., Spinola M. & Minna J. D. New molecularly targeted therapies for lung cancer. J. Clin. Invest. 117, 2740–2750 (2007). - PMC - PubMed
    1. Einhorn L. H. First-line chemotherapy for non-small-cell lung cancer: is there a superior regimen based on histology? J. Clin. Oncol. 26, 3485–3486 (2008). - PubMed
    1. Thatcher N. et al.. Necitumumab plus gemcitabine and cisplatin versus gemcitabine and cisplatin alone as first-line therapy in patients with stage IV squamous non-small-cell lung cancer (SQUIRE): an open-label, randomised, controlled phase 3 trial. Lancet Oncol. 16, 763–774 (2015). - PubMed

Publication types

MeSH terms