

Deletion of PIKfyve alters alveolar macrophage populations and exacerbates allergic inflammation in mice
- PMID: 28533230
- PMCID: PMC5470042
- DOI: 10.15252/embj.201695528
Deletion of PIKfyve alters alveolar macrophage populations and exacerbates allergic inflammation in mice
Abstract
Alveolar macrophages (AMs) are specialized tissue-resident macrophages that orchestrate the immune responses to inhaled pathogens and maintain organ homeostasis of the lung. Dysregulation of AMs is associated with allergic inflammation and asthma. Here, we examined the role of a phosphoinositide kinase PIKfyve in AM development and function. Mice with conditionally deleted PIKfyve in macrophages have altered AM populations. PIKfyve deficiency results in a loss of AKT activation in response to GM-CSF, a cytokine critical for AM development. Upon exposure to house dust mite extract, mutant mice display severe lung inflammation and allergic asthma accompanied by infiltration of eosinophils and lymphoid cells. Moreover, they have defects in production of retinoic acid and fail to support incorporation of Foxp3+ Treg cells in the lung, resulting in exacerbation of lung inflammation. Thus, PIKfyve plays a role in preventing excessive lung inflammation through regulating AM function.
Keywords: alveolar macrophage; anti‐inflammatory response; inositol lipid; lipid kinase; macrophage development.
© 2017 The Authors.
Figures
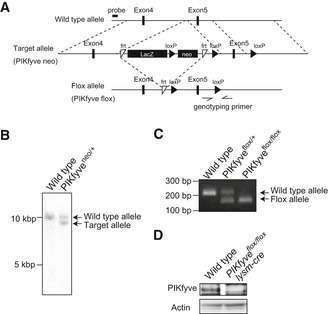
Design of PIKfyve knockout mouse generation.
Southern blot analysis using genomes from wild‐type and PIKfyve Neo mice having a LacZ and neomycin cassette in the target allele. The LacZ and neomycin cassette was deleted using an frt site by crossing with Flp recombinase‐expressing transgenic mice.
PCR genotyping of mice using a primer pair for the loxP site.
PIKfyve flox/flox mice were crossed with mice expressing Cre recombinase downstream of the lysozyme LysM promoter (lysm‐cre). Protein expression of PIKfyve and
β ‐actin in bone marrow‐derived M‐CSF‐induced macrophages was investigated by Western blot analysis.
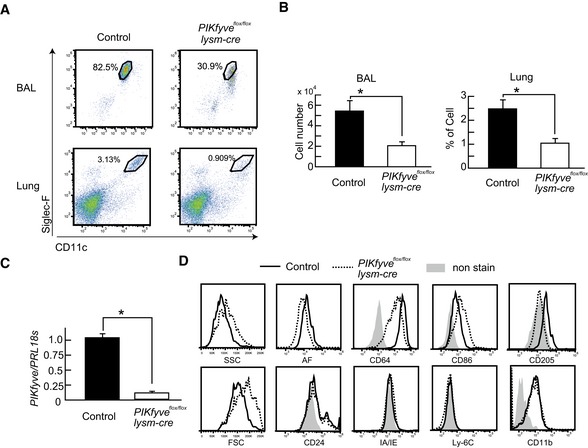
Flow cytometry of AMs in BAL fluid and lung stained with anti‐CD11c and anti‐Siglec‐F.
Number of AMs in BAL fluid and percentage of AMs in lung are shown in bar graphs (n = 4).
PIKfyve gene expression in AMs measured by RT–PCR (n = 3).
SSC, FSC and autofluorescence (AF), and expression of CD64, CD86, IA/IE, Ly‐6C, CD24, CD11b, and CD205 in AMs.

Gating to separate myeloid lineage cells in lung. Doublet cells were excluded, and CD45+ cells were separated with distinct cell surface markers; alveolar macrophages (AMs) (CD11bintSiglec‐F+CD11chighCD64+), eosinophils (CD11c−Siglec‐F+), neutrophils (CD11b+Ly‐6G+), CD103+ DCs (CD11chighIA/IEhighCD11b−CD103+), CD11b+ DCs (CD11chighIA/IEhighCD11b+CD103−CD24+CD64−), interstitial macrophages (IMs) (CD11chighIA/IEhighCD11b+CD103−CD24−CD64+), Ly‐6C+ monocytes (CD11b+IA/IE−CD64+/−Ly‐6C+), and Ly‐6C− monocytes (CD11b+IA/IE−CD64−Ly‐6C−).
Number of indicated cells in lungs (n = 3).
Expression of surface makers in CD11bintSiglec‐F+CD11chighCD64+ AMs.
Flow cytometry of spleen, bone marrow, liver, and intraperitoneal cells stained with anti‐F4/80 and anti‐CD11b.
Percentage of F4/80+CD11b+ macrophages in each tissue (n = 3).
- A
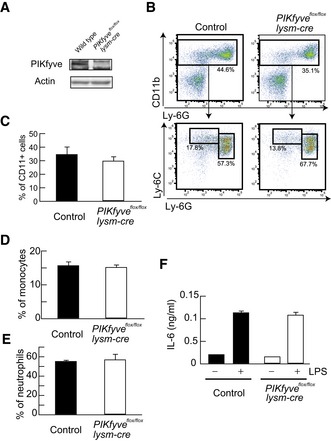
Protein expression of PIKfyve and β‐actin in neutrophils was investigated by Western blot analysis.
- B
Flow cytometry of neutrophils and monocytes in bone marrow. CD11b+ cells were gated and analyzed for Ly‐6C and Ly‐6G.
- C–E
Percentages of CD11b+ cells (C), Ly‐6C+Ly‐6Glow monocytes (D), and Ly‐6CintLy‐6Ghigh neutrophils (E) are shown as bar graphs (n = 3).
- F
Ly‐6CintLy‐6Ghigh neutrophils in bone marrow were sorted and stimulated with LPS. IL‐6 production was analyzed by ELISA (n = 3).
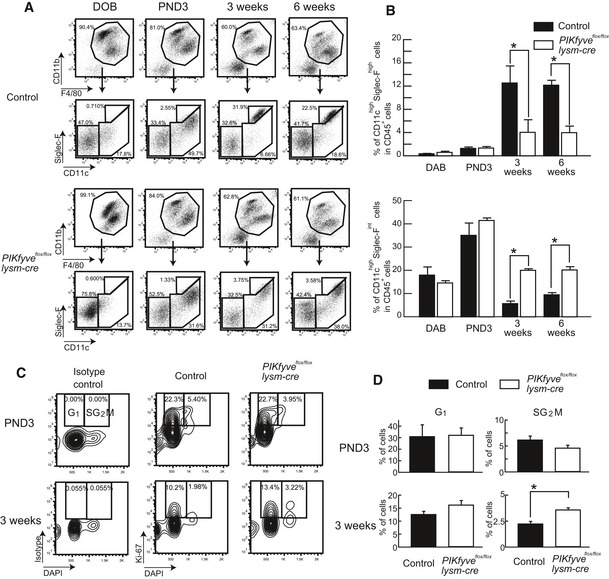
Lungs were harvested at the indicated times after birth and analyzed by flow cytometry. CD45+ blood cells were gated for CD11b and F4/80, and CD11b+F4/80+ cells were stained with anti‐CD11c and anti‐Siglec‐F.
Percentages of CD11chighSiglec‐Fhigh AMs (upper) and of CD11highSiglec‐Fint AMs (lower) in CD45+ cells are plotted as bar graphs (n ≥ 5).
CD11highSiglec‐Fhigh AMs in lung were stained with DAPI and anti‐Ki‐67 or isotype control. Ki‐67+DAPIlow cells were gated as G1 phase, and Ki‐67+DAPIhigh cells were gated as SG2M phase.
The percentage of G1 and SG2M phase cells are plotted as a bar graph (n = 3).

- A
AMs and IMs in lung, spleen, bone marrow, liver, and intraperitoneal cavity were isolated, and PIKfyve expression was measured by RT–PCR (n = 3).
- B
M‐CSF‐induced macrophages were cultured with GM‐CSF for 3 days, and CD11b+F4/80+ cells were stained with anti‐CD11c and anti‐Siglec‐F. Percentages of CD11c+Siglec‐F+ cells in CD11b+F4/80+ cells are plotted as a bar graph (n = 3).
- C
M‐CSF‐induced macrophages were stimulated with GM‐CSF, and the time course of phosphorylation level of AKT, STAT5, NF‐κB p65, JNK, p38, and ERK was investigated by Western blot analysis using the indicated antibodies.
- D
AMs or lungs were isolated, and the expression of Csf2, Csfra, and Csfrb was measured by RT–PCR (n = 3).
- E
Expression of CD131 (GM‐CSF receptor β) in AM was measured by FACS (n = 3).
- F, G
Lungs were isolated at PND5. CD45+ cells were stained with anti‐CD11c and anti‐Siglec‐F, and CD45+CD11c+Siglec‐F+ cells were stained with anti‐pAKT (F) and anti‐pSTAT5 (G). Percentages of pAKT‐positive cells are plotted in a bar graph (n = 4).
- H
CD11chighSiglec‐Fhigh cells were isolated from control, and CD11chighSiglec‐F+ cells including Siglec‐Fint cells were isolated from PIKfyve flox/flox lysm‐cre mice. Gene expression in AMs was measured by gene chip analysis, and the expression of transcription factors involved in macrophage development and function is shown.
- I
M‐CSF‐induced macrophages were stimulated with GM‐CSF in the presence or absence of GSK690693, and the expression of Irf8, Irf5, and Irf1 was measured by RT–PCR (n = 4).
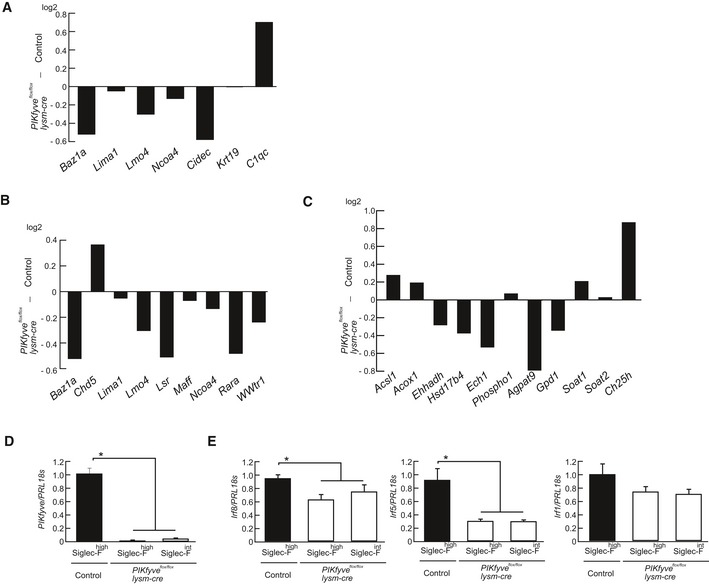
- A–C
CD11chighSiglec‐Fhigh cells were isolated from control, and CD11chighSiglec‐F+ cells including Siglec‐Fint cells were isolated from PIKfyve flox/flox lysm‐cre mice. Gene expression in these cells was measured by gene chip analysis. The expression of signature genes for AM development and function (A), Pparγ‐regulated genes (B), and lipid metabolism‐related genes (C) are shown as bar graphs.
- D, E
CD11chighSiglec‐Fhigh cells were isolated from control and PIKfyve flox/flox lysm‐cre mice, and CD11chighSiglec‐Fint cells were isolated from PIKfyve flox/flox lysm‐cre mice. Gene expression for PIKfyve (D), and Irf8, Irf5, and Irf1 (E) were measured by qPCR (n = 4).
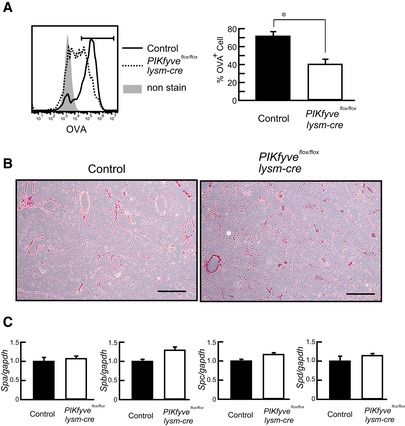
Mice were intranasally administered Alexa633‐labeled OVA protein. AMs in BAL were isolated and stained with anti‐CD11c. Histogram (left) and percentage (right) of OVA‐loaded cells are shown (n = 4).
Lung sections of 8‐month‐old mice were stained with H/E. Scale bar: 500 µm.
Surfactant gene expression in lung was measured by RT–PCR (n = 3).

Protocol for inducing airway inflammation by HDM intranasal administration.
Numbers of infiltrating neutrophils, eosinophils, and CD4+ T cells in BAL fluid are plotted as a bar graph (n = 4).
Representative hematoxylin and eosin (H/E) and periodic acid Schiff (PAS) staining of lung sections. Scale bar: 20 µm (upper) 5 µm (lower).
Cytokine gene expression in lung tissue was determined by RT–PCR (n = 4).
Production of IL‐4 and IL‐13 in lung homogenates was investigated by ELISA (n = 3).

- A
BAL fluid cells were stained with lineage markers and were further stained with anti‐T1/ST2 and anti‐Sca‐1.
- B
Percentages of ILCs in BAL fluid are plotted as a bar graph (n ≥ 3).
- C
Il33 and Tslp gene expression in lung tissue was determined by RT–PCR (n ≥ 3).
- D, E
Number of CD11b+ DCs (D) and IMs (E) was measured by multi FACS analysis (n = 3).
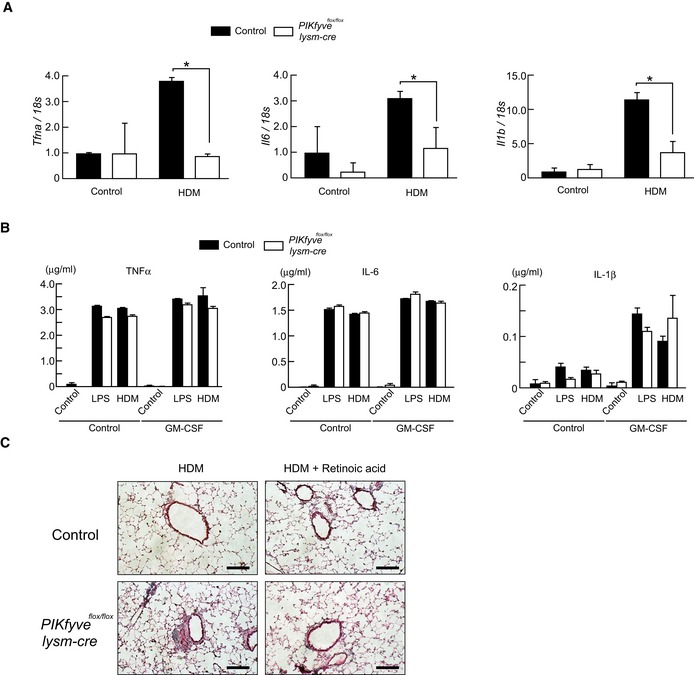
Mice were intranasally administrated HDM, and CD11chighSiglec‐Fhigh cells were isolated from control, and CD11chighSiglec‐F+ cells including Siglec‐Fint cells were isolated from PIKfyve flox/flox lysm‐cre mice. Expression of Tnfa, Il6, and Il1b was measured by qPCR (n = 4).
M‐CSF‐induced macrophages were stimulated with LPS or HDM in the presence or absence of GM‐CSF. Production of TNFα, IL‐6, and IL‐1β was measured by ELISA (n = 3).
Mice were treated with HDM, with or without retinoic acid, and lung sections were stained with H/E. Scale bar: 10 µm.
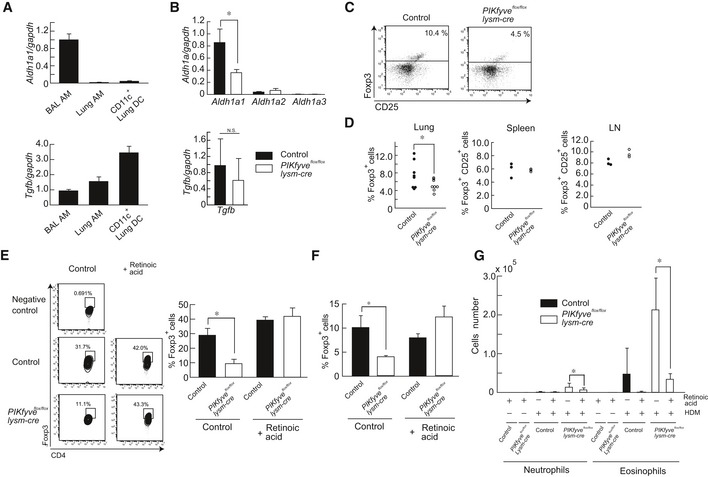
Aldh1a1 and Tgfb expression in BAL AMs, lung AMs, and CD11c+ DCs was measured by RT–PCR (n = 3).
Comparison of Aldh1a and TGFb expression in BAL AMs from control and PIKfyve flox/flox lysm‐cre mice (n ≥ 3).
CD4+ T cells in lung were gated for Foxp3 and CD25.
Percentages of Foxp3‐positive T cells in lung, and of Foxp3− and CD25‐positive T cells in spleen and lymph node (LN) are plotted.
Splenic CD4+CD25− T cells were isolated and co‐cultured with AMs from BAL fluid for 5 days with or without retinoic acid. Total cells were stained with anti‐CD4 and anti‐Foxp3, and the percentages of Foxp3+ Treg cells in CD4 T cells are plotted as a bar graph (n = 3).
Percentages of Foxp3+ Treg cells in lung after administration of retinoic acid (n ≥ 3).
Numbers of neutrophils and eosinophils in BAL fluid after administration of HDM in the presence or absence of retinoic acid (n ≥ 3).
Similar articles
-
GM-CSF and IL-33 Orchestrate Polynucleation and Polyploidy of Resident Murine Alveolar Macrophages in a Murine Model of Allergic Asthma.Int J Mol Sci. 2020 Oct 11;21(20):7487. doi: 10.3390/ijms21207487. Int J Mol Sci. 2020. PMID: 33050608 Free PMC article.
-
Ssu72 regulates alveolar macrophage development and allergic airway inflammation by fine-tuning of GM-CSF receptor signaling.J Allergy Clin Immunol. 2021 Apr;147(4):1242-1260. doi: 10.1016/j.jaci.2020.07.038. Epub 2020 Sep 8. J Allergy Clin Immunol. 2021. PMID: 32910932
-
AMFR drives allergic asthma development by promoting alveolar macrophage-derived GM-CSF production.J Exp Med. 2022 May 2;219(5):e20211828. doi: 10.1084/jem.20211828. Epub 2022 Mar 25. J Exp Med. 2022. PMID: 35333296 Free PMC article.
-
Gm-CSF regulates pulmonary surfactant homeostasis and alveolar macrophage-mediated innate host defense.Annu Rev Physiol. 2002;64:775-802. doi: 10.1146/annurev.physiol.64.090601.113847. Annu Rev Physiol. 2002. PMID: 11826288 Review.
-
GM-CSF and dendritic cells in allergic airway inflammation: basic mechanisms and prospects for therapeutic intervention.Curr Drug Targets Inflamm Allergy. 2003 Dec;2(4):279-92. doi: 10.2174/1568010033484052. Curr Drug Targets Inflamm Allergy. 2003. PMID: 14561147 Review.
Cited by
-
PIKfyve Deficiency in Myeloid Cells Impairs Lysosomal Homeostasis in Macrophages and Promotes Systemic Inflammation in Mice.Mol Cell Biol. 2019 Oct 11;39(21):e00158-19. doi: 10.1128/MCB.00158-19. Print 2019 Nov 1. Mol Cell Biol. 2019. PMID: 31427458 Free PMC article.
-
Antigen Presentation in the Lung.Front Immunol. 2022 May 9;13:860915. doi: 10.3389/fimmu.2022.860915. eCollection 2022. Front Immunol. 2022. PMID: 35615351 Free PMC article. Review.
-
Selective Termination of Autophagy-Dependent Cancers.Cells. 2024 Jun 25;13(13):1096. doi: 10.3390/cells13131096. Cells. 2024. PMID: 38994949 Free PMC article. Review.
-
GM-CSF and IL-33 Orchestrate Polynucleation and Polyploidy of Resident Murine Alveolar Macrophages in a Murine Model of Allergic Asthma.Int J Mol Sci. 2020 Oct 11;21(20):7487. doi: 10.3390/ijms21207487. Int J Mol Sci. 2020. PMID: 33050608 Free PMC article.
-
New Insight into Drugs to Alleviate Atopic March via Network Pharmacology-Based Analysis.Curr Issues Mol Biol. 2022 May 18;44(5):2257-2274. doi: 10.3390/cimb44050153. Curr Issues Mol Biol. 2022. PMID: 35678682 Free PMC article.
References
-
- Balhara J, Gounni AS (2012) The alveolar macrophages in asthma: a double‐edged sword. Mucosal Immunol 5: 605–609 - PubMed
-
- Becher B, Schlitzer A, Chen J, Mair F, Sumatoh HR, Teng KW, Low D, Ruedl C, Riccardi‐Castagnoli P, Poidinger M, Greter M, Ginhoux F, Newell EW (2014) High‐dimensional analysis of the murine myeloid cell system. Nat Immunol 15: 1181–1189 - PubMed
-
- Gautier EL, Chow A, Spanbroek R, Marcelin G, Greter M, Jakubzick C, Bogunovic M, Leboeuf M, van Rooijen N, Habenicht AJ, Merad M, Randolph GJ (2012) Systemic analysis of PPARgamma in mouse macrophage populations reveals marked diversity in expression with critical roles in resolution of inflammation and airway immunity. J Immunol 189: 2614–2624 - PMC - PubMed
Publication types
MeSH terms
Substances
LinkOut - more resources
Full Text Sources
Other Literature Sources
Medical
Molecular Biology Databases
