. 2017 Jun 29;546(7660):617-621.
doi: 10.1038/nature22799. Epub 2017 May 22.

Structure of a pre-catalytic spliceosome

Affiliations

Structure of a pre-catalytic spliceosome

Clemens Plaschka et al. Nature. .

Abstract

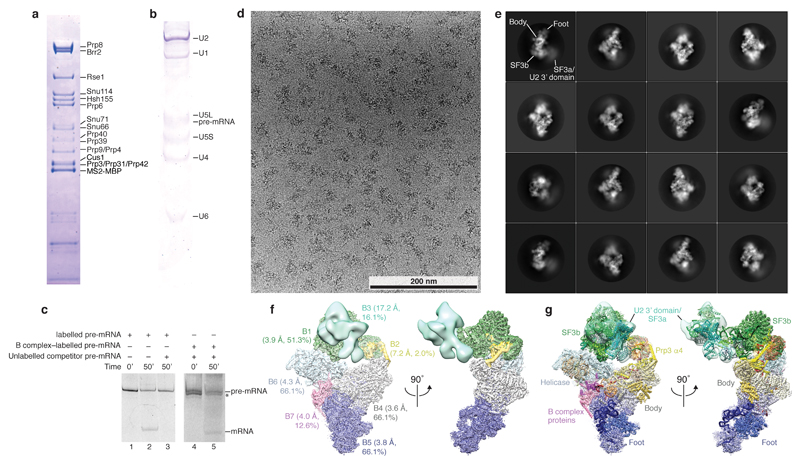
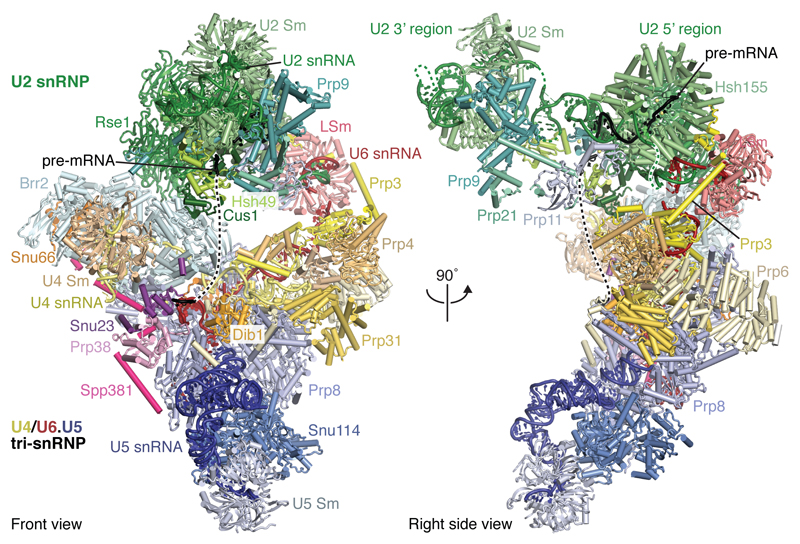
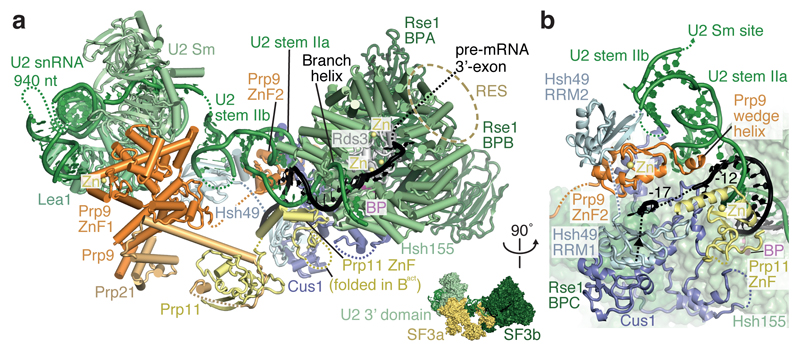
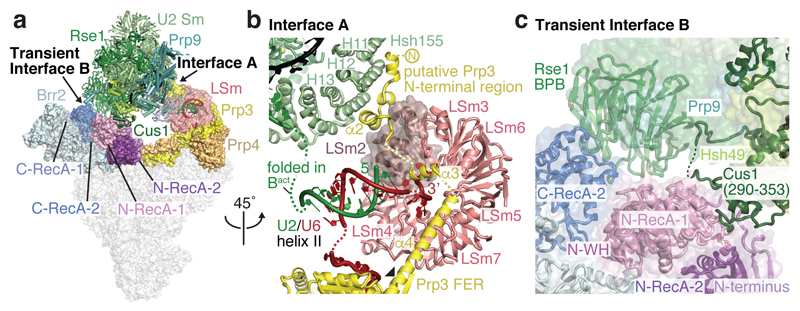
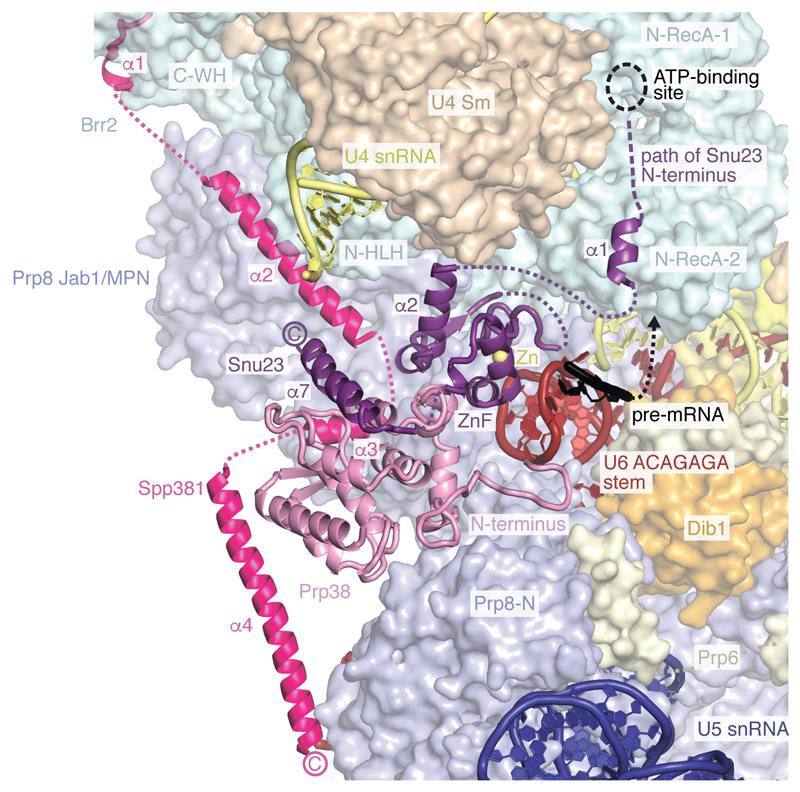
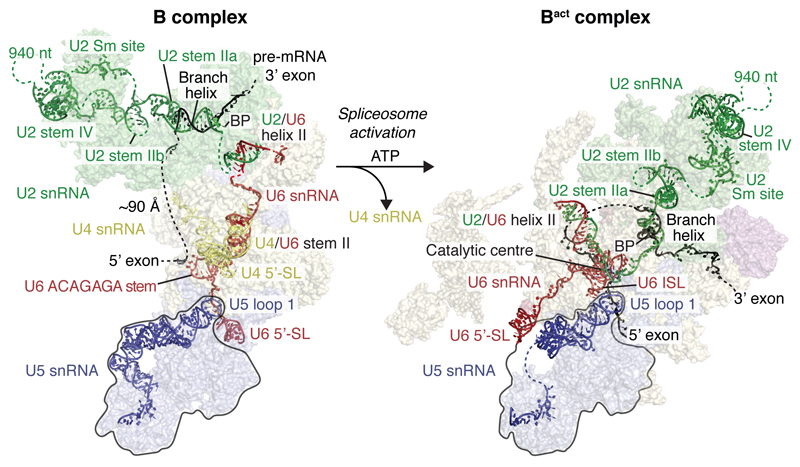
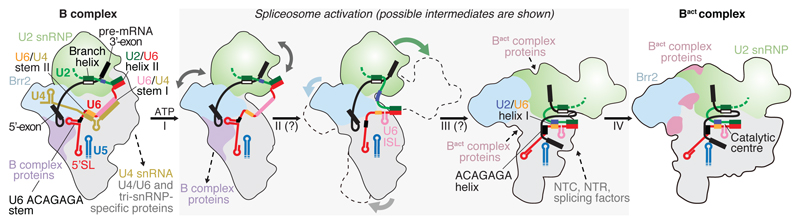
Intron removal requires assembly of the spliceosome on precursor mRNA (pre-mRNA) and extensive remodelling to form the spliceosome's catalytic centre. Here we report the cryo-electron microscopy structure of the yeast Saccharomyces cerevisiae pre-catalytic B complex spliceosome at near-atomic resolution. The mobile U2 small nuclear ribonucleoprotein particle (snRNP) associates with U4/U6.U5 tri-snRNP through the U2/U6 helix II and an interface between U4/U6 di-snRNP and the U2 snRNP SF3b-containing domain, which also transiently contacts the helicase Brr2. The 3' region of the U2 snRNP is flexibly attached to the SF3b-containing domain and protrudes over the concave surface of tri-snRNP, where the U1 snRNP may reside before its release from the pre-mRNA 5' splice site. The U6 ACAGAGA sequence forms a hairpin that weakly tethers the 5' splice site. The B complex proteins Prp38, Snu23 and Spp381 bind the Prp8 N-terminal domain and stabilize U6 ACAGAGA stem-pre-mRNA and Brr2-U4 small nuclear RNA interactions. These results provide important insights into the events leading to active site formation.


Conflict of interest statement

The authors declare no competing financial interests.

Figures

Extended Data Figure 1
Extended Data Figure 1. Biochemical characterization and cryo-EM of the B complex spliceosome.
a, Protein analysis of purified B complex (SDS-PAGE stained with Coomassie blue). U1 snRNP components and U1 snRNA are sub-stoichiometric (see b), consistent with U1 snRNP destabilization in B complex,. For gel source data see Supplementary Figure 1a. b, RNA analysis of purified B complex (denaturing 9 % polyacrylamide TBE gel stained with Toluidine blue). For gel source data see Supplementary Figure 1b. c, Purified B complex is active in an in vitro splicing assay. Splicing reactions were carried out in yeast extract in absence (Lanes 1 and 2) or presence of 60 nM competitor pre-mRNA (Lane 3), prohibiting the assembly of new spliceosomes. B complex was assembled on labelled pre-mRNA and purified (see Methods), and added to yeast extract for 10 min together with 60 nM unlabelled competitor pre-mRNA, before addition of ATP to initiate the reaction (Lanes 4 and 5). Splicing reactions contained 2 mM ATP (Lanes 1-5). The asterisk marks a degradation product. For gel source data see Supplementary Figure 1c. d, Cryo-EM micrograph of B complex. Scale bar, 200 nm. e, Representative 2D class averages of B complex reveal flexibility of peripheral regions relative to the tri-snRNP body. f, Composite cryo-EM density of B complex shown in two orthogonal views. Colours indicate the respective cryo-EM densities used for modelling (B1, green; B2, yellow; B3, light green; B4, grey; B5, blue; B6, light blue; B7, magenta). The sharpened densities are shown and are aligned using overlapping regions (see Extended Data Fig. 2). The percentage of particles from the full set of 496,581 that contribute to the respective density are indicated together with the overall resolution (see Extended Data Fig. 9). g, Composite cryo-EM density of B complex superimposed on a ribbon model of the B complex structure, coloured as in Fig. 1. B complex, excluding the U1 snRNP, has a molecular weight of 2.5 MDa of which we modelled 1.8 MDa.
Extended Data Figure 2
Extended Data Figure 2. Three-dimensional classification of cryo-EM data.
Three-dimensional image classification of the cryo-EM data set using the B complex negative stain reconstruction (Methods; Extended Data Fig. 3b) as the initial reference model. The percentage of single particles contributing to each class is provided. To help visualize structural differences, 3D reconstructions of B complex are coloured according to mobile regions: SF3b (green), U2 3’ domain/SF3a (light green), helicase (cyan), body (grey), foot (navy blue), and B complex proteins (magenta). For each classification round the type of mask and use of signal subtraction is indicated. The type of mask, overall resolution, and use of signal subtraction is also indicated for each 3D refinement subsequent to classification. For additional details see the Methods and Extended Data Fig. 9.
Extended Data Figure 3
Extended Data Figure 3. Negative stain and cryo-EM reconstructions of B complex.
a, Three-dimensional image classification of negative stain EM data. 12,296 particles were refined using the negative stain reconstruction of the human BΔU1-complex (EMD-1066) as the initial reference, and were subsequently classified. Class 2 contained most features and was used for 3D refinement. The percentage of single particles contributing to each class is provided. b, Two orthogonal views of the yeast B complex negative stain reconstruction used as the initial reference for processing of the cryo-EM data set. c, Gold-standard Fourier shell correlation (FSC = 0.143) of the respective B1, B2, B3, B4, B5, B6, and B7 cryo-EM single particle reconstructions. d, Orientation distribution plot of all particles that contribute to the respective B1, B2, B3, B4, B5, B6, and B7 cryo-EM single particle reconstructions. e, The composite B complex cryo-EM density (maps B1-7) is shown in two orthogonal views and coloured by local resolution, as determined by ResMap. Compare Extended Data Fig. 1f. f, A central slice through the composite B complex cryo-EM density (maps B1-7) is shown in two orthogonal views and coloured by local resolution, as determined by ResMap.
Extended Data Figure 4
Extended Data Figure 4. Details of the U2 snRNP.
a, Multiple conformations of the U2 snRNP 3’ domain/SF3a subcomplexes relative to SF3b indicate flexibility. This apparent mobility may be important to form A complex, consistent with dynamic contacts of the U2 snRNA 5’-end with SF3a60 (human Prp9) and SF3b49 (human Hsh49) in the isolated U2 snRNP that differ from U2 snRNP protein–snRNA interactions observed in the yeast B complex structure. Surface representations of U2 3’ domain (light green), SF3a (light yellow), and SF3b (dark green) are shown. U2 3’ domain/SF3a are positioned according to 3D classes 1, 6, and 7 from round 5 (compare Extended Data Fig. 2). A cartoon summarizes the movements. b, Representative regions of the sharpened SF3b-containing density (B1) at 3.9 Å resolution are superimposed on the refined coordinate model. The density shows side-chain features for a loop in Cus1, a β-strand in Rse1, an α-helix in Hsh155, and separation of RNA nucleotides in the U2–pre-mRNA branch helix. Colours as in Fig. 2. c, Cryo-EM densities for SF3a are superimposed on the B complex coordinate model. The crystal structure of the Y-shaped core of SF3a is superimposed on the B3 density. Prp11 ZnF, Prp9 ZnF2 and the Prp9 C-terminus are superimposed on the B1 density. Structural elements of SF3a, including the Prp9 wedge helix, and disordered regions are indicated. For cryo-EM density nomenclature see Extended Data Fig. 1f. Colours as in Fig. 2.
Extended Data Figure 5
Extended Data Figure 5. Flexibility of the U2 snRNP relative to tri-snRNP.
a, Multiple positions of the U2 snRNP relative to tri-snRNP. Representative classes are shown (class 1, 6, and 8 from round 3, see Extended Data Fig. 2) that reside along a continuum of conformations (compare Extended Data Fig. 1e). The U2 snRNP moves together with the U6 LSm ring, which is anchored via the putative Prp3 N-terminus. A cartoon summarizes the movements in two orthogonal views. The location of the U2 snRNP has an apparent effect on the strength of the putative pre-mRNA 5’-exon cryo-EM density (compare Extended Data Fig. 6e). When the U2 snRNP is positioned away from the U6 ACAGAGA stem, the pre-mRNA density is weaker than when the U2 snRNP is positioned closer. This suggests how Brr2 helicase activity may carry out a kinetic proofreading of the pre-mRNA 5’-exon–U6 snRNA interaction: When the U2 snRNP is close to tri-snRNP activation may occur normally (productive activation). However, when the U2 snRNP is positioned further away and the 5’-exon is not tethered, Brr2 activity may instead lead to dissociation of the U2 snRNP from tri-snRNP (non-productive activation). b, The Prp3 model is superimposed on B1 (putative N-terminal region), B2 (helix α4) and B4 (C-terminal region) cryo-EM densities. The Prp3 ferredoxin-like fold (FER) and secondary structure elements are labelled. The black triangle indicates the region of Prp3 helix α4 that bends with different U2 snRNP positions (see a). For cryo-EM density nomenclature see Extended Data Fig. 1f.
Extended Data Figure 6
Extended Data Figure 6. Details of B-specific proteins and U6 snRNA.
a, Fit of the Spp381 model to B6 (helix α1-α2) and B7 (helix α3-α4) cryo-EM densities. Helix α4 was modelled into weak density (B7) based on homology to the human and Chaetomium thermophilum crystal structure. For cryo-EM density nomenclature see Extended Data Fig. 1f. b, Fit of the Prp38 model to the B7 cryo-EM density. Helix α5 is shown below, revealing side-chain features in the density. c, Fit of the Snu23 model to B6 (helix α1) and B7 (remainder of Snu23) cryo-EM densities. Helix α2 is shown below, revealing side-chain features in the density. d, Composite cryo-EM density and fit of the U6 snRNA model. The B1, B2, B4, B5, and B7 densities are shown without (left) and with the U6 snRNA model superimposed (right). U6 elements and the site of interaction with U5 snRNA loop 1 are indicated. e, A weak density for pre-mRNA connects from the U6 snRNA ACAGAGA stem to the U2 SF3b-bound intron. The connecting density (map B2) is shown at intermediate (gray, threshold of 0.023) and low thresholds (light blue, threshold of 0.0173). The U6 snRNA densities are shown as in panel d. The register of pre-mRNA near the U6 ACAGAGA stem is uncertain and was tentatively modelled based on complementarity with UBC4 pre-mRNA upstream and nearest to the 5’-exon, consistent with RNA crosslinking. According to this register ~40 pre-mRNA nucleotides separate U6- and SF3b-bound regions. The lower right panel shows the fit of the pre-mRNA–U6 snRNA ACAGAGA stem loop model to the unsharpened B7 density. For cryo-EM density nomenclature see Extended Data Fig. 1f. f, Snu23 binds near the nucleotide-binding pocket of the N-terminal Brr2 helicase cassette, where it may influence Brr2 activity. Brr2 (pale cyan) and Snu23 (violet) models are superimposed on the B6 cryo-EM density, coloured as the underlying proteins. The RecA-1 and RecA-2 lobes of the N-terminal Brr2 helicase cassette are labelled, and an ADP nucleotide was modelled by aligning the N-terminal helicase cassette of human Brr2 bound to ADP (ref.73) (PDB ID 4KIT) on the equivalent yeast Brr2 residues. The path of the Snu23 N-terminus cryo-EM density is indicated, and is near to the Brr2 nucleotide-binding pocket. g, The U6 ACAGAGA stem is chaperoned by Dib1, Prp6, Prp8, and B complex proteins. Stabilization of the U6 ACAGAGA stem may facilitate tethering of pre-mRNA at its tip, whereas the U6 ACAGAGA box is buried in the stem. Surface models of Snu23 ZnF, Prp38 N-terminus, Prp6 N-terminus, Dib1, Prp8L and Prp8N domains, and Brr2 are shown and reveal a network of protein-RNA contacts to maintain the U6 stem. h, Comparison of human tri-snRNP (PDB ID 3JCR) and yeast B complex (this study) reveals that the Prp8N and Prp8EN domains serve as a platform for mutually exclusive binding of Prp28 and B complex proteins. Their Prp8N binding sites overlap and the altered location of the Prp8EN domain between the two complexes provides additional interfaces for either Prp28 or B complex proteins to bind. Movements compared to B complex in Brr2 and U4/U6 di-snRNP are indicated with arrows, and may occur after A complex association. The U2 snRNP is shown in grey to highlight tri-snRNP components, which are coloured as in Fig. 1. Comparison with Bact and C* structures– further suggests that Prp8N and Prp8EN domains serve as a general platform for step-specific splicing factors during the splicing cycle.
Extended Data Figure 7
Extended Data Figure 7. U5 snRNA model, location of the U1 snRNP, and RNA secondary structure diagrams.
a, An improved model for U5 snRNA. A secondary structure diagram (left) and refined coordinate model (right) are shown, and the newly determined Variable Stem Loop II, Stem III, and Stem IV are labelled together with known U5 snRNA elements. The long form of U5 snRNA is shown, where the short form ends with nucleotide 179. The grey boxes indicate regions not included in the model. Lines indicate Watson-Crick base-pairs, and dots indicate G-U wobble base-pairs. The U5 snRNA model was prepared by M. Wilkinson. b, Putative model of the RNA interaction network in the pre-B complex. The RNA network is unchanged compared to B complex, except for the interaction of the pre-mRNA 5’-exon with U1 snRNA. Only loop 1 of U5 snRNA is shown. Lines indicate Watson-Crick, dots G-U wobble, stars non-canonical, and dotted lines putative nucleotide interactions. c, Putative location of the U1 snRNP. To gain insights into U1 snRNP location relative to U2 snRNP and tri-snRNP, we combined genetic, biochemical, and structural observations. The U1 snRNP likely binds between the human SF3a subunit SF3A1 (yeast Prp21), the Prp28 binding site, Brr2, and the U6 ACAGAGA stem. In B complex, the U1 snRNP may be destabilised due to a steric clash with Brr2, that is likely to be repositioned compared to the pre-B complex as in the human tri-snRNP structure. In humans, the U1 snRNP may be further destabilised by a loss of A complex-specific proteins. Brr2 repositioning may therefore serve as a checkpoint to signal the release of U1 snRNA from pre-mRNA. d, RNA secondary structure diagrams of regions modelled in B and Bact complex spliceosomes, using UBC4 pre-mRNA. The pre-mRNA substrate in Bact (ref. 21) is a mixture of cellular pre-mRNAs and its sequence is replaced by that of UBC4. The consensus nucleotides at the 5’SS and branch point sequence in yeast are shown in bold. Only loop 1 of U5 snRNA is shown. Lines indicate Watson-Crick, dots G-U wobble, stars non-canonical, and dotted lines putative nucleotide interactions. Highlighted are the branch point adenosine (BP), pre-mRNA 5’- and 3’-exons, and the U6 ACAGAGA box.
Extended Data Figure 8
Extended Data Figure 8. Compositional and conformational changes during spliceosome activation.
a, List of RNA and protein components in B and Bact complex spliceosomes. During spliceosome activation 22 proteins join the spliceosome, whereas 24 proteins (or 41 including the U1 snRNP) and U1 and U4 snRNA are released. The U1 snRNP is indicated with a dashed line due to its substoichiometric binding in B complex. RES complex proteins were not modelled in B complex, however, weak density is visible at the same binding site as in Bact (ref.20,21), consistent with mass spectrometry (ref. and data not shown). b, Movement of the Prp8 RNase H (Prp8RH) domain between B and Bact complex spliceosomes. In B complex (left) regions of Prp3, Prp6, and Snu66 (residues 148-236) contact the Prp8RH domain and its β-hairpin (red). The Prp8 large domain (Prp8L) is shown as a surface and subunits are coloured as in Fig. 1. An arrow indicates the movement of the Prp8RH domain to its Bact position (right; PDB ID 5GM6), where it is stabilised by Hsh155, Prp45 (yellow), and Cwc22 (dark violet). B and Bact models were aligned on the Prp8L domain. c, Movements of the Prp8 switch loop and N-terminal domain between B and Bact complex spliceosomes. In B complex (left) an unassigned peptide (orange) binds the Prp8 switch loop, stabilizing it on the Prp8L domain. The Prp8 N-terminal domain (Prp8N) is shown as a surface (magenta) and binds the U6 snRNA 5’-stem. The Prp8 Endonuclease (Prp8EN) domain is labelled. Arrows indicate the movements required to transition to Bact (PDB ID 5GM6). The unassigned peptide is released in Bact (right) and Cwc21 (yellow) and Cwc22 (dark violet) bind in its stead to stabilise the new position of Prp8 switch loop and the loaded pre-RNA 5’-exon (light orange) in the exon channel. The re-positioned Prp8N domain completes this channel. B and Bact models were aligned on the Prp8L domain. d, Movements of U2 3’ domain/SF3a subcomplexes between B and Bact complex spliceosomes. In B complex (left) the U2 3’ domain/SF3a subcomplexes are flexibly linked to SF3b and assume several positions relative to SF3b (compare Extended Data Fig. 4a). For comparison to Bact, the model for U2 3’ domain/SF3a (light green/grey) was rigid-body fitted into a low-pass filtered cryo-EM density of yeast Bact (ref.20) (EMD-4099). This indicated that in Bact (right) U2 3’ domain/SF3a are repositioned due to binding of NTC proteins Syf1 and Clf1 (yellow arch), to avoid a steric clash. The NTC subunits Syf1 and Clf1 may thus be positioned in Bact to bind the U2 3’ domain after the release of SF3a, during conversion to B* (Extended Data Fig. 8d). This repositioning is distinct from U2 3’ domain/SF3a conformations that are sampled in B complex. B and Bact models of the U2 snRNP were aligned on SF3b subunit Rse1. e, Movements of SF3b subunit Hsh155 and pre-mRNA between B and Bact complex spliceosomes. B and Bact (PDB ID 5GM6) models were aligned on Hsh155, revealing small conformational changes in Hsh155 HEAT repeats, possibly due to extended interaction of Hsh155 with Prp8, Snu17, and Prp45 (grey arches) in Bact. The U2–pre-mRNA branch helix is bound in the same manner in B and Bact complex spliceosomes. However, nucleotides downstream of the branch point (BP, magenta) are bound differently, possibly due to movements in Hsh155. f, Structural differences between B and Bact complex spliceosomes suggest a model for activation. The ATP-dependent helicase Brr2 is positioned in B complex (panel 1) and unwinds the U4/U6 duplex to release U4 snRNA and U4/U6 and B complex proteins (panel 2). Their removal enables movements in Brr2, U2 and U5 snRNPs, and U6 snRNA to facilitate the loading of pre-mRNA, and formation of the U2/U6 catalytic centre (panel 3). This intermediate is subsequently stabilised by NTC, NTR, splicing factors and Bact complex proteins to form Bact (ref.21) (panel 4; PDB ID 5GM6). U5 snRNP (blue; U5 snRNA, light grey), U4/U6 di-snRNP (light yellow; U4 snRNA, yellow; U6 snRNA, red), U2 snRNP (U2 3’ domain, light green; SF3a, olive; SF3b, dark green), B complex proteins (shades of magenta), NTC, NTR and splicing factors (light yellow), and Bact complex proteins (shades of salmon) are indicated. The Bact position of U2 snRNP 3’ domain/SF3a was modelled as in Fig. 5. B and Bact spliceosomes were aligned on their Prp8L domain. Spliceosome activation intermediates are modelled.
Extended Data Figure 9
Extended Data Figure 9. Data collection, refinement statistics, and structure validation.
a, Cryo-EM data collection and refinement statistics of the B complex structure. Different regions of the composite B complex structure were refined into B1, B4, B5, B6, and B7 maps as described (see Methods). b, FSC between local cryo-EM map regions and corresponding regions of the refined coordinate models. Note that the FSC curve for the B-specific proteins correlates with the local resolution in this subregion of the B7 density (4.0-5Å, Extended Data Fig. 3d), below the nominal resolution (4.0 Å).
Figure 1
Figure 1. B complex structure at near-atomic resolution.
Two orthogonal views of the B complex structure. Subunits are coloured according to snRNP identity (U2, green; U4, yellow; U5, blue; U6, red; Dib1, Prp6 and Snu66, shades of yellow). B complex proteins in shades of magenta (Spp381, magenta; Prp38, light magenta; Snu23, violet).
Figure 2
Figure 2. U2 snRNP architecture and interactions with the intron.
a, Organisation of the U2 snRNP with subunits coloured as in Fig. 1, except for Prp9 (orange), Prp11 (yellow), Prp21 (light orange), Cus1 (dark blue), Hsh49 (light blue), Rds3 (grey), and the branch point (BP) adenosine (magenta). The thumbnail highlights the U2 snRNP subcomplexes. The RES complex location (dashed brown ellipse) is indicated based on its Bact location,. The non-essential 940-nucleotide insertion in yeast U2 snRNA is disordered. A loop in the Prp11 Zn-finger (ZnF) domain is disordered in B complex, but folds over the pre-mRNA 5’SS in Bact (ref.21). b, SF3a/b proteins chaperone U2 snRNA elements and the pre-mRNA intron. The SF3a Prp9 subunit ‘wedge helix’ separates the intron from U2 snRNA, guiding it towards Hsh49 RRM1. Pre-mRNA nucleotides at position –12 and –17 from the branch point (BP) adenosine and its 3’-direction (black arrow) are indicated. Colours as in a.
Figure 3
Figure 3. U2 snRNP and tri-snRNP interfaces.
a, Overview of the B complex structure, showing interface A and transient interface B. The U2 snRNP (coloured as in Fig. 1) was positioned relative to tri-snRNP using a subset of particles (map B2) (see Methods). Tri-snRNP is shown as a surface (grey), except for Prp3 (yellow), Prp4 (light orange), the LSm ring (salmon) and Brr2 (pale cyan except for N-terminal and C-terminal RecA-1 and RecA-2 lobes shown in shades of blue and violet). b, Interface A. The U2 snRNP binds tri-snRNP via U2/U6 helix II and SF3b subunit Hsh155 HEAT repeats H11-13, which bind the putative Prp3 N-terminal region. The nucleotides that form the active site U2/U6 helix I in Bact are disordered (dashed green line). The black triangle indicates the region of Prp3 helix α4 that bends with different U2 snRNP positions. See Extended Data Fig. 5. c, Transient Interface B. SF3b subunits Cus1 and Rse1 BPB contact Brr2 in a subset of cryo-EM particles (see Extended Data Fig. 5a; Methods). Colours as in a.
Figure 4
Figure 4. B complex proteins stabilise Brr2 and U6 snRNA.
B complex protein interactions within the pre-catalytic B complex. The extended structures of B complex proteins Spp381 (magenta), Prp38 (light magenta), and Snu23 (violet) bind the Prp8 N-terminal (Prp8N) domain and contact Prp8 Jab1/MPN, Brr2 C-WH, N-HLH, and N-RecA-2 domains to position Brr2 on U4 snRNA. The Snu23 Zn-finger (ZnF) and Prp38 N-terminus stabilise the U6 ACAGAGA stem, which may enable tethering of the putative pre-mRNA 5’SS at its tip (3’-direction, black arrow).
Figure 5
Figure 5. Changes in the RNA network during spliceosome activation.
B and Bact complexes with RNA models superimposed on transparent surfaces of spliceosome proteins. Proteins are coloured as in Fig. 1, and the two structures are aligned with their U5 snRNP foot domain (black outline). The U2 3’ domain and SF3a proteins are modelled based on a low-pass filtered Bact cryo-EM density (EMD-4099, see Methods) onto the Bact model (PDB ID 5GM6). Internal stem loop, ISL; Stem loop, SL.
Figure 6
Figure 6. Model for spliceosome activation from B to Bact complex.
The ATP-dependent activity of Brr2 results in release of U4 snRNA, U4/U6, and tri-snRNP-specifc proteins (transition I), followed by U6 Internal stem loop (ISL) folding and U6 ACAGAGA stem unfolding (II), formation of U2/U6 helix I, ACAGAGA helix, the 5’-exon–U5 loop I basepairs (III), and the binding of the NTC, NTR and Bact complex proteins (IV). Proposed activation intermediates are shown in a grey box. See also Extended Data Figs 7d and 8.

Similar articles

Cited by

References

    1. Will CL, Lührmann R. Spliceosome structure and function. Cold Spring Harb Perspect Biol. 2011;3:a003707. - PMC - PubMed
    1. Boesler C, et al. A spliceosome intermediate with loosely associated tri-snRNP accumulates in the absence of Prp28 ATPase activity. Nat Commun. 2016;7:11997. - PMC - PubMed
    1. Staley JP, Guthrie C. An RNA switch at the 5′ splice site requires ATP and the DEAD box protein Prp28p. Mol Cell. 1999;3:55–64. - PubMed
    1. Lesser CF, Guthrie C. Mutations in U6 snRNA that alter splice site specificity: implications for the active site. Science. 1993;262:1982–1988. - PubMed
    1. Lybarger S, et al. Elevated levels of a U4/U6.U5 snRNP-associated protein, Spp381p, rescue a mutant defective in spliceosome maturation. Mol Cell Biol. 1999;19:577–584. - PMC - PubMed

Publication types

MeSH terms