. 2017 May 17;94(4):759-773.e8.
doi: 10.1016/j.neuron.2017.04.043.

Diverse Requirements for Microglial Survival, Specification, and Function Revealed by Defined-Medium Cultures

Affiliations

Diverse Requirements for Microglial Survival, Specification, and Function Revealed by Defined-Medium Cultures

Christopher J Bohlen et al. Neuron. .

Abstract

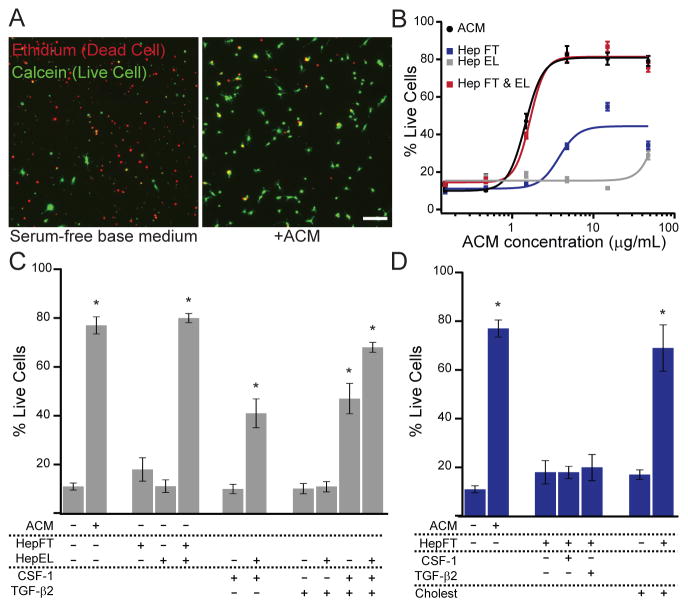
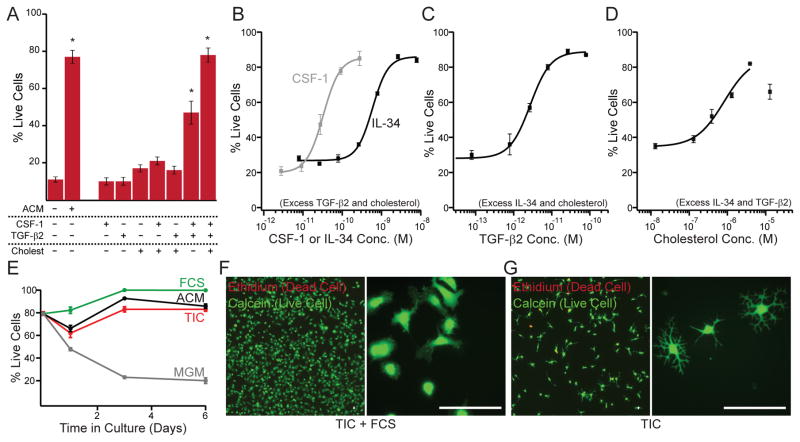
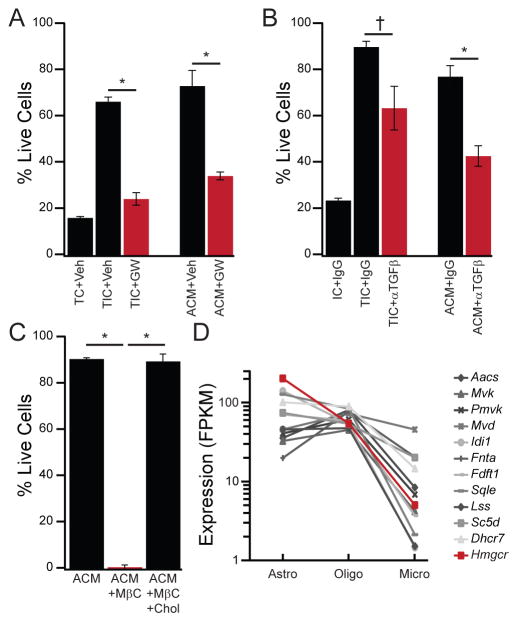
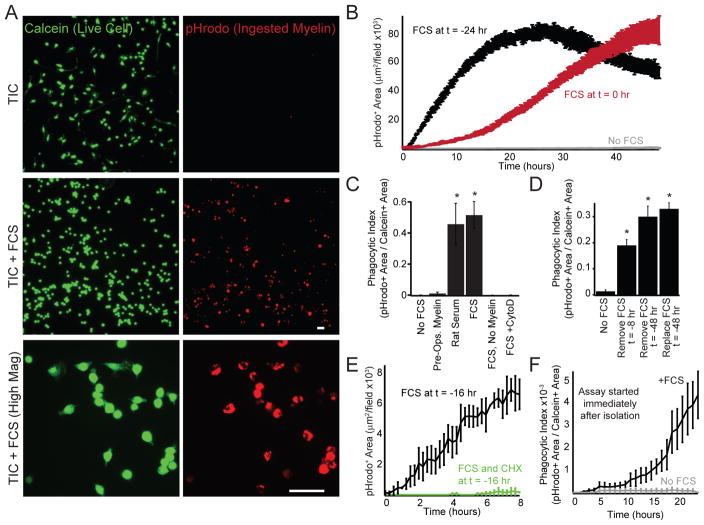
Microglia, the resident macrophages of the CNS, engage in various CNS-specific functions that are critical for development and health. To better study microglia and the properties that distinguish them from other tissue macrophage populations, we have optimized serum-free culture conditions to permit robust survival of highly ramified adult microglia under defined-medium conditions. We find that astrocyte-derived factors prevent microglial death ex vivo and that this activity results from three primary components, CSF-1/IL-34, TGF-β2, and cholesterol. Using microglial cultures that have never been exposed to serum, we demonstrate a dramatic and lasting change in phagocytic capacity after serum exposure. Finally, we find that mature microglia rapidly lose signature gene expression after isolation, and that this loss can be reversed by engrafting cells back into an intact CNS environment. These data indicate that the specialized gene expression profile of mature microglia requires continuous instructive signaling from the intact CNS.

Keywords: CSF1R; TGF-β; astrocyte; cholesterol; inflammation; maturation; microglia; neurodegeneration; phagocytosis; transplant.


Figures

Figure 1
Figure 1. Multiple astrocyte-secreted factors support microglial survival
(A) Serum-free rat primary microglia cultured in basal medium or astrocyte conditioned medium (ACM, 20 μg/mL) for 5 days. ACM improved survival, as assessed by accumulation of calcein (green) and exclusion of ethidium dimers (red). (B) Dose-response curves of fractionated ACM. Survival activity of unfractionated ACM (black) was not fully recovered in either heparin column flowthrough (Hep FT, blue) or eluate (Hep EL, gray) fractions. Recovered activity with combined fractions (red) indicates multiple active components. Doses represent complete ACM protein concentration or equivalent volume of each fraction. Lines represent Hill equation fits. (C) Survival activity of the Hep EL fraction can be complemented by CSF-1 and TGF-β2. (D) Survival activity of the Hep FT fraction can be complemented by free cholesterol. Some data replotted from (C). Averages are mean ± sem. Scale bars = 80 μm. * P < 0.001 one-way ANOVA across all groups in the panel with Dunnett’s comparison to the leftmost (no additive) condition.
Figure 2
Figure 2. The combination of TGF-β, CSF-1/IL-34, and cholesterol supports survival of ramified microglia in defined medium
(A) The combination of CSF-1 (10 ng/mL), TGF-β2 (2 ng/mL), and cholesterol (1.5 μg/mL) facilitates survival of primary rat microglia as well as ACM (20 μg/mL). Individual components or pairwise combinations were not sufficient for robust survival (5 div). Some bars are replotted from Fig. 1C for clarity. (B) Dose-response analysis of CSF-1 and IL-34 when supplemented with TGF-β2 (2 ng/mL) and cholesterol (1.5 μg/mL). (C) Dose-response analysis of TGF-β2 when supplemented with IL-34 (100 ng/mL) and cholesterol (1.5 μg/mL). (D) Dose-response analysis of cholesterol when supplemented with IL-34 (100 ng/mL) and TGF-β2 (2 ng/mL). Lines in (B–D) describe Hill equation fits. (E) Time course of microglial survival in base medium (MGM, gray), ACM (black), TIC (red) or TIC+10%FCS (green). (F, G) Calcein/ethidium-labeled microglia grown in TIC supplemented with 10% FCS (F) or TIC alone (G) illustrate serum-induced proliferation (low magnification, left) and altered morphology (high magnification, right). Averages are mean ± sem. Scale bars = 40 μm. * P < 0.001 one-way ANOVA across all groups with Dunnett’s comparison to no additive condition.
Figure 3
Figure 3. CSF-1/IL-34, TGF-β, and cholesterol are necessary for ACM survival activity
(A) The CSF1R antagonist GW2580 (10 μM, red), but not vehicle (Veh, black), reduced survival of primary rat microglia in both TIC and ACM. (B) The pan-TGF-β neutralizing antibody 1D11 (5 μg/mL), but not IgG control, partially reversed survival in TIC or ACM (20 μg/mL). (C) The cholesterol-chelating agent methyl-β-cyclodextrin (MβC, 5 mM) eliminated ACM survival activity, but not if it was pre-saturated with cholesterol (MβC+ chol). (D) Abundance of cholesterol biosynthesis machinery mRNA transcripts from published RNA-seq datasets (Zhang et al., 2014) expressed as fragments per kilobase per million reads mapped (FPKM) illustrates lower levels in microglia (Micro) as compared to astrocytes (Astro) and mature oligodendrocytes (Oligo). The rate-limiting enzyme in cholesterol biosynthesis (Hmgcr) is highlighted in red. Averages are mean ± sem. * P < 0.005, † P < 0.05 Student’s t-test.
Figure 4
Figure 4. Serum exposure unlocks latent phagocytic potential in serum-free microglial cultures
(A) Phagocytosis (3 hr) of pHrodo-labeled myelin debris (red) by primary rat microglia (5 div in TIC) with (middle, bottom) or without (top) exposure to serum (10% FCS, 24 hr). (B) pHrodo signal monitored over two days. Microglia (5 div in TIC) exposed to 10% FCS for 24 hours before addition of myelin (black) cleared all of the provided myelin. Cells only exposed to 10% FCS when myelin was added (red) were initially less phagocytic than cells pre-exposed to serum, but gradually acquired robust phagocytic capacity. Cells unexposed to serum (gray) showed minimal myelin uptake. (C) Serum-free cultured microglia (5 div in TIC) do not phagocytose myelin pre-opsonized with serum (Pre-Ops. Myelin, 4 hr). Pre-exposure of microglia (24 hr) to adolescent rat serum or fetal calf serum facilitates phagocytosis. Minimal pHrodo signal was observed in the absence of myelin or in the presence of the actin-polymerization inhibitor cytochalasin D (CytoD, 10 μM). Phagocytic index was calculated as the ratio of pHrodo+ area to calcein+ area. (D) 8 or 48 hr after removal of FCS (10%, 24 hr exposure), microglia phagocytose myelin (4 hr) as efficiently as cells continuously maintained with serum. (E) Microglia (5 div in TIC) supplemented with serum before adding myelin (10% FCS at t = −16 hr) or with serum and the translational inhibitor cycloheximide (40 μM, FCS and CHX at t = −16 hr) show that serum-evoked changes in phagocytosis requires new protein synthesis. (F) Microglia (0 div in TIC) do not phagocytose myelin immediately after plating, although phagocytosis gradually increases in cells exposed to 10% FCS. Averages are mean ± sem. Scale bars = 10 μm. * P < 0.001 one-way ANOVA with Dunnett’s comparison to no FCS.
Figure 5
Figure 5. Effects of serum exposure on microglial gene expression
(A–C) Volcano plots summarizing changes in microglial gene expression (P21, 8 div in TIC) after 1, 3, or 5 days of serum exposure as measured by RNA-seq. Values in the upper corners denote the number of genes upregulated (red) or downregulated (blue) after serum exposure at each time point passing a 4-fold cutoff at P<0.01. Individual genes showing pronounced changes are labeled. (D) KEGG pathways enriched after serum exposure among upregulated (red, left) or downregulated (blue, right) genes. Enrichment was measured using GSEA, and the false-discovery-rate q-value (FDR) is plotted, with larger bars indicating higher confidence of enrichment. Pathways involving proliferation, amino acid metabolism, and complement are upregulated after serum exposure, whereas cytokine pathways and lipid-modifying pathways are downregulated.
Figure 6
Figure 6. Transcriptional profiling indicates microglial de-differentiation in culture
(A) Volcano plots summarizing changes in microglial gene expression (P21, 8 div in TIC) compared to freshly isolated cells. Values in the upper corners denote the number of genes upregulated (red) or downregulated (blue) in cultured cells (4-fold cutoff at P < 0.01). (B) GSEA comparison of culture-induced gene changes with developmental or inflammatory gene changes. The nominal enrichment score (NES) for each comparison is shown, with positive values (red) indicating enrichment among genes upregulated in culture and negative values (blue) indicating enrichment among genes downregulated in culture. Cultured microglia upregulate genes associated with microglia in neurodegeneration (ALS or AD mouse models) peripheral inflammation (LPS) and early development (developmentally downregulated genes, Dev Dwn), but they downregulate genes associated with maturation (developmentally upregulated genes, Dev Up). *Both FDR q-value and nominal P-value < 0.001. (C) Overlap between genes changing in inflammation/development and genes upregulated (red) or downregulated (blue) in culture. Percent overlap denotes the fraction of genes in each developmental or inflammation gene list that are also up- or down-regulated in culture. Culture-induced gene expression changes partially recapitulate inflammatory changes and demonstrate an inverse relationship to developmental changes. *P < 0.001 hypergeometric distribution. (D, E) QPCR shows rapid but transient upregulation of canonical activation markers accompanied by rapid and sustained downregulation of microglial signature genes over the first 5 days in culture (P19–P21, in TIC). (F) Log2 fold-changes in RNA-seq FPKM values measured for cultured microglia relative to freshly isolated cells for 88 genes that are both upregulated developmentally and preferentially expressed by microglia over other tissue macrophages. The majority of microglial signature genes are downregulated (blue), not upregulated (red) in culture. Averages are mean ± sem.
Figure 7
Figure 7. Re-introduction into the CSF1R−/− CNS rescues microglial character
(A) Schematic showing experimental paradigm, left to right: isolation of microglia by magnetic bead separation, culture for 4 hours in TIC + 5% FCS, intracranial injection into CSF1R−/−pups (P0 to P2), 2 weeks incubation in vivo, analysis of engrafted cells. (B) Cultured mouse microglia demonstrate loss of signature gene expression by 4 hours that is sustained at 6 days. (C) Cultured microglia (blue) show reduced immunoreactivity to Tmem119 after 4 hours (left) or 16 hours (right) in culture compared to acutely purified cells (black) by flow cytometry. (D) FACS histograms of CD11b+CD45Lo gated cells from microglia-injected CSF1R−/− brains or WT controls showing that engrafted microglia show near-WT levels of Tmem119 immunoreactivity two weeks after injection. (E) The geometric mean florescence intensity for Tmem119 immunostaining rapidly decreases in culture, but returns to WT levels in cells cultured for 16 hr then re-engrafted. (F) Engrafted brains have Tmem119 immunopositive ramified microglia, whereas non-engrafted CSF1R−/− brains lack these cells. Averages are mean ± sem. Scale bar = 50 μm. * P < 0.001 one-way ANOVA with Dunnett’s comparison to 0 hr.

Similar articles

Cited by

References

    1. Afgan E, Baker D, van den Beek M, Blankenberg D, Bouvier D, Cech M, Chilton J, Clements D, Coraor N, Eberhard C, et al. The Galaxy platform for accessible, reproducible and collaborative biomedical analyses: 2016 update. Nucleic Acids Res. 2016;44:W3–W10. - PMC - PubMed
    1. Ajami B, Bennett JL, Krieger C, Tetzlaff W, Rossi FM. Local self-renewal can sustain CNS microglia maintenance and function throughout adult life. Nat Neurosci. 2007;10:1538–1543. - PubMed
    1. Barres BA, Schmid R, Sendnter M, Raff MC. Multiple extracellular signals are required for long-term oligodendrocyte survival. Development. 1993;118:283–295. - PubMed
    1. Bennett ML, Bennett FC, Liddelow SA, Ajami B, Zamanian JL, Fernhoff NB, Mulinyawe SB, Bohlen CJ, Adil A, Tucker A, et al. New tools for studying microglia in the mouse and human CNS. Proc Natl Acad Sci U S A. 2016;113:E1738–1746. - PMC - PubMed
    1. Brown GC, Neher JJ. Microglial phagocytosis of live neurons. Nat Rev Neurosci. 2014;15:209–216. - PubMed

MeSH terms