. 2017 May 18;66(4):546-557.e3.
doi: 10.1016/j.molcel.2017.04.016. Epub 2017 May 11.

RNA Pol II Dynamics Modulate Co-transcriptional Chromatin Modification, CTD Phosphorylation, and Transcriptional Direction

Affiliations

RNA Pol II Dynamics Modulate Co-transcriptional Chromatin Modification, CTD Phosphorylation, and Transcriptional Direction

Nova Fong et al. Mol Cell. .

Abstract

Eukaryotic genes are marked by conserved post-translational modifications on the RNA pol II C-terminal domain (CTD) and the chromatin template. How the 5'-3' profiles of these marks are established is poorly understood. Using pol II mutants in human cells, we found that slow transcription repositioned specific co-transcriptionally deposited chromatin modifications; histone H3 lysine 36 trimethyl (H3K36me3) shifted within genes toward 5' ends, and histone H3 lysine 4 dimethyl (H3K4me2) extended farther upstream of start sites. Slow transcription also evoked a hyperphosphorylation of CTD Ser2 residues at 5' ends of genes that is conserved in yeast. We propose a "dwell time in the target zone" model to explain the effects of transcriptional dynamics on the establishment of co-transcriptionally deposited protein modifications. Promoter-proximal Ser2 phosphorylation is associated with a longer pol II dwell time at start sites and reduced transcriptional polarity because of strongly enhanced divergent antisense transcription at promoters. These results demonstrate that pol II dynamics help govern the decision between sense and divergent antisense transcription.

Keywords: H3K4me2; K3K36me3; antisense transcription; bidirectional transcription; histone methylation; kinetic coupling; pol II CTD S2 phosphorylation; pol II dynamics; transcription elongation rate.


Figures

Figure 1
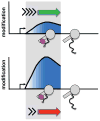
Figure 1. The “dwell-time in the target zone” model
The “dwell-time in the target zone” model for establishment of profiles of co-transcriptionally deposited post-translational modifications (PTM). Diagram shows pol II (grey) that is associated with a post-translational modifier (pink) in the “target zone” (shaded). Y axis shows the amount of a PTM deposited by a “writer” of modifications in the “target zone” when transcription is fast (green arrow, short dwell-time) or slow (red arrow, long dwell-time). Note that activity of an “eraser” of PTMs associated with the TEC could also be affected by dwell-time.
Figure 2
Figure 2. Slow elongation repositions H3K36me3 toward 5′ ends
A. Metaplots of mean relative frequency of H3K36me3 ChIP signals at 5′ ends of human genes in WT (two independent experiments) and the R749H slow mutant. 100 bp bins are shown for the region from −1.5kb to +5.0 kb relative to the TSS for a set of well-expressed genes in HEK293 cells separated by 2kb (Brannan et al., 2012). Replicate experiments are shown in Fig. S1A–D. P-values (lower panel) were calculated using Welch’s two sample t-test. The horizontal dotted line indicates a p-value of 0.05. B–E. UCSC genome browser shots of H3K36me3 ChIP signals in WT, and the R749H slow mutant. Note the 5′ shift in the profiles of H3K36me3 in the R749H slow mutant (arrows).
Figure 3
Figure 3. Slow pol II prolongs dwell-time and elevates CTD Ser2 phosphorylation near start sites
A. Metaplots of mean relative frequency of CTD Ser2-P ChIP signals for over 5000 genes in cells expressing WT Amr pol II and the R749H and H1108Y slow mutants. 100 base bins are shown in flanking regions from −1.5kb to +0.5kb relative to the TSS and from −0.5kb to +3.5kb relative to the poly (A) site. Gene body regions between +500 relative to the TSS and −500 relative to the poly (A) site are divided into 20 variable length bins. Note the peaks of Ser2-P at the TSS in both slow mutants (red arrow). Biological replicates are shown in Fig. S3. B. Metaplots of Ser2-P ChIP signals normalized to total pol II (log2) in cells expressing WT, R749H and H1108Y pol II. Note elevated Ser2-P/total pol II in 5′ regions in both slow mutants. C. Prolonged dwell time of R749H pol II relative to WT at promoters. Total pol II occupancy was measured by ChIP in cells treated with α-amanitin (42hr) and then with the initiation inhibitor triptolide (10 μM) for 0, 10, 20, 40 and 80 minutes. Q-PCR values were normalized to the tRNA MET gene as an internal control (see START Methods) and to t=0. SEM is shown for >5 PCR reactions from two biological replicates. D–I. Anti-Pol II CTD Ser2-P ChIP-seq shows novel 5′ peaks (arrows) in the slow R749H and H1108Y pol II mutants. UCSC genome browser screen shots are shown. See also Fig. S3.
Figure 4
Figure 4. Slow elongation repositions CTD Ser2-P toward 5′ ends in yeast
A. Metaplots of mean ChIP signals for Ser2-P normalized to total pol II (log2) in biological replicate ChIP-seq experiments with isogenic WT (DY103) and slow rpb2-10 mutant (DY105) strains at over 3000 ORFs >1kb long. 100 base bins are shown in 5′ and 3′ flanking regions and gene body regions are divided into 20 variable length bins. Note the 5′ shift in Ser2-P in rpb2-10 relative to WT (arrow). B. Metaplots of mean relative frequency of Ser2-P ChIP signals at intergenic snoRNAs in WT and rpb2-10. Note the 5′ shift in Ser2-P in rpb2-10 (arrow). C–E. 5′ shifting of Ser2-P (arrows) in the slow rpb2-10 mutant relative to isogenic WT. UCSC genome browser screen shots of anti-Ser2-P ChIP signals are shown for overlaid tracks of WT (grey) and rpb2-10 (red). F–H. 5′ shifting of Ser2-P (arrows) in the slow rpb2-10 and rpb1 N488D (GRY3038) mutants (red) relative to isogenic WT strains (grey).
Figure 5
Figure 5. Elevated divergent antisense transcription in a slow pol II funnel domain mutant
A. Anti-pol II total Nascent Elongating Transcript sequencing (anti-pol II tNET-seq). Isolated nuclei are digested with DNAse I, lysed and used to immunoprecipitate RNA pol II (blue circles) along with nascent transcripts (red). Precipitated RNA was processed into random primed strand-specific libraries (see STAR Methods). B, C. Integrated genomics viewer (IGV) screen shots of anti Ser2-P ChIP-seq and sense and antisense anti-pol II tNET-seq reads. Note that high 5′ CTD-Ser2-P in R749H (blue arrows) is associated with increased divergent antisense transcription (red arrows). Sense and antisense tNET-seq tracks are scaled equivalently for WT and R749H samples to accurately reflect changes in the amount of divergent versus sense transcription. Read numbers are not normalized, and differ between experiments. D–E. Metaplots of mean anti-pol II tNET-seq sense and antisense reads/75bp bin from 3 replicate experiments in WT and R749H slow mutant in over 5000 well expressed genes separated by 2 kb (D) and in a subset of genes (Table S1) with elevated 5′ Ser2-P (E). Note increased divergent antisense transcription in R749H (arrows), which is more pronounced among genes with elevated 5′ Ser2-P. F. Metaplots of mean anti-pol II tNET-seq antisense reads/200bp bin (n=3) at genes with 5′ Ser2 hyperphosphorylation in the R749H slow mutant (Table S1). Note that high level antisense transcription in the slow mutant extends many kilobases. G. Metaplots as in D of H3K4me2 ChIP signals in WT and the R749H slow mutant. Note that slow transcription is associated with a shift in H3K4me2 upstream and downstream of the TSS (red arrows). Similar results were observed for genes with elevated DI in R749H. See Fig. S2D–G.
Figure 6
Figure 6. Elevated divergent antisense transcription in a slow pol II trigger loop mutant
A, B. Metaplots of mean anti-pol II tNET-seq sense and antisense reads from WT (n=3) and H1108Y (n=2) slow mutant at over 4000 well expressed genes separated by 2 kb, and genes with 5′ Ser2 hyperphosphorylation (Table S1) as in Fig. 5D. Note increased divergent antisense transcription (red arrows) in H1108Y. C–E. IGV screen shots of anti-pol II tNET-seq sense and antisense reads in WT and R749H and H1108Y slow mutants and in Fig. 5B. Note elevated antisense transcription relative to WT in both slow mutants (arrows).
Figure 7
Figure 7. Divergent antisense transcription correlated with high 5′ CTD Ser2 phosphorylation
A. Scatter plot comparing the divergence index (DI, see STAR Methods) between WT and R749H. Genes analyzed are separated by >5kb upstream and downstream and have elevated Ser2-P at their 5′ ends in R749H (Table S1) and those with altered values (n=3, FDR <.05, t-test) are shown as red and blue points. Note the majority of genes with increased 5′ Ser2-P show increased DI in the slow mutant (red dots). B. Genes with high 5′ Ser2-P in the R749H slow mutant (n=344) are enriched for elevated (2X increase, FDR<.05, n=3) divergence index (DI) relative to all genes scored in the DI analysis (n= 2940, see STAR Methods). P-value calculated by ChiSq. C. IGV screen shots of anti-Ser2-P tNET-seq sense and antisense nascent RNA reads as in Fig. 5B. Note increased divergent antisense transcription by Ser2 phosphorylated pol II in the R749H slow mutant relative to WT (arrows). D, E. Metaplots of mean coverage of anti-Ser2-P tNET-seq sense and antisense reads as in Fig. 5D for a group of highly expressed genes separated by 2kb (C) and those with 5′ Ser2 hyperphosphorylation in R749H (Table S1). Note elevated levels of promoter proximal sense transcription (blue arrows) and divergent antisense transcription (red arrows) by Ser2 phosphorylated pol II in the slow R749H mutant. F. Model showing WT and slow mutant pol II at the transcription start site. The slow mutant has increased dwell time (stopwatch), CTD Ser2 phosphorylation and divergent antisense transcription relative to WT.

Similar articles

Cited by

References

    1. Aebi M, Weissman C. Precision and orderliness in splicing. Trends in Genetics. 1987;3:102–107.
    1. Ahn SH, Kim M, Buratowski S. Phosphorylation of serine 2 within the RNA polymerase II C-terminal domain couples transcription and 3′ end processing. Mol Cell. 2004;13:67–76. - PubMed
    1. Almada AE, Wu X, Kriz AJ, Burge CB, Sharp PA. Promoter directionality is controlled by U1 snRNP and polyadenylation signals. Nature. 2013;499:360–363. - PMC - PubMed
    1. Anders S, Pyl PT, Huber W. HTSeq--a Python framework to work with high-throughput sequencing data. Bioinformatics. 2015;31:166–169. - PMC - PubMed
    1. Bentley DL. Coupling mRNA processing with transcription in time and space. Nat Rev Genet. 2014;15:163–175. - PMC - PubMed

MeSH terms