. 2017 Aug 3;130(5):567-580.
doi: 10.1182/blood-2016-11-751099. Epub 2017 May 12.

Platelet microparticles infiltrating solid tumors transfer miRNAs that suppress tumor growth

Affiliations

Platelet microparticles infiltrating solid tumors transfer miRNAs that suppress tumor growth

James V Michael et al. Blood. .

Abstract

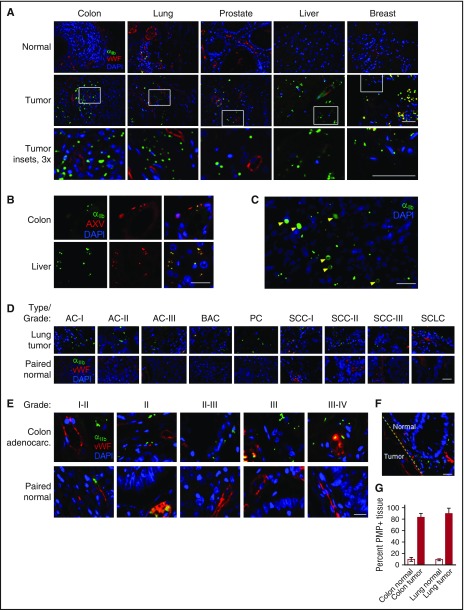
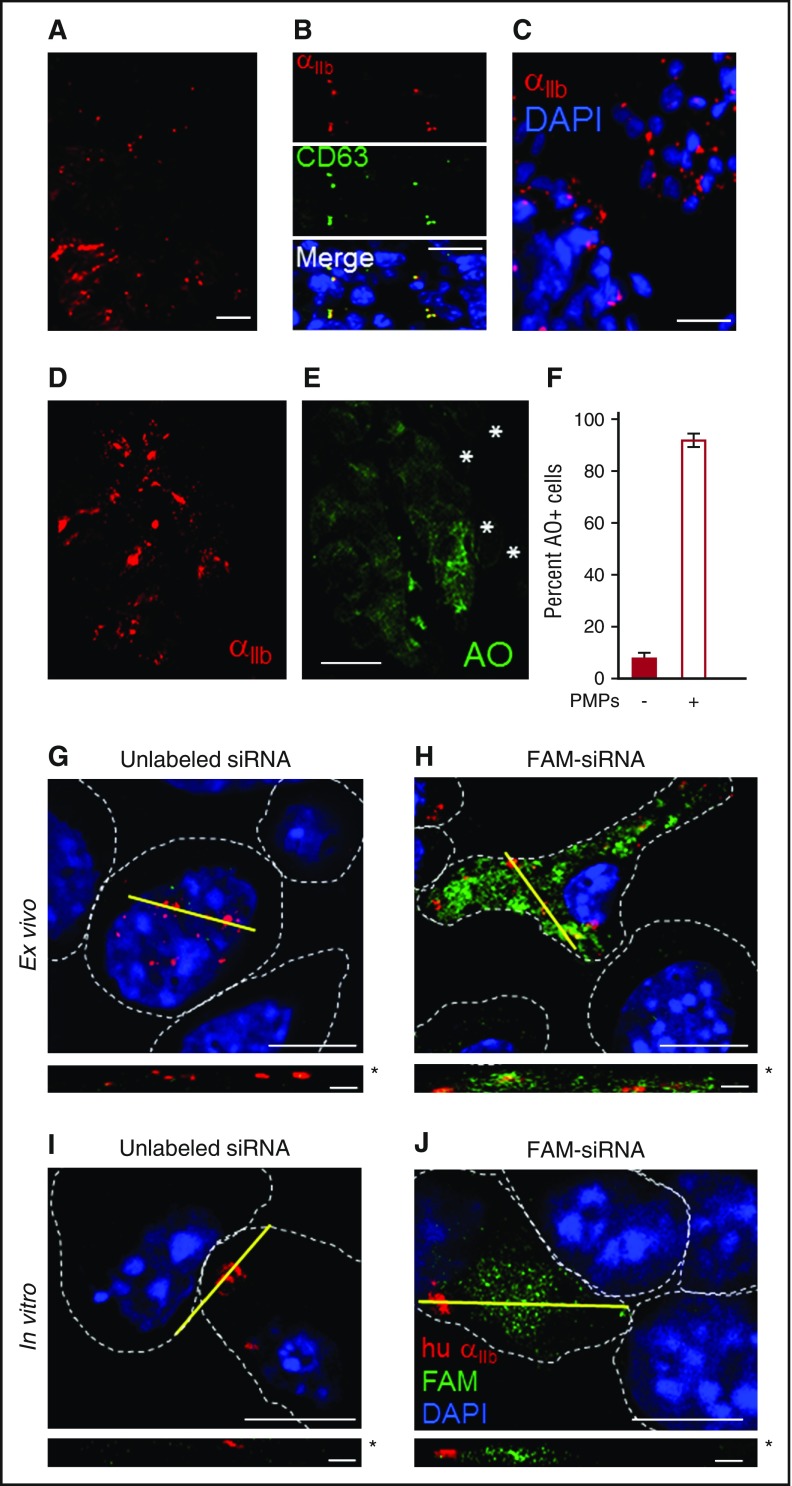
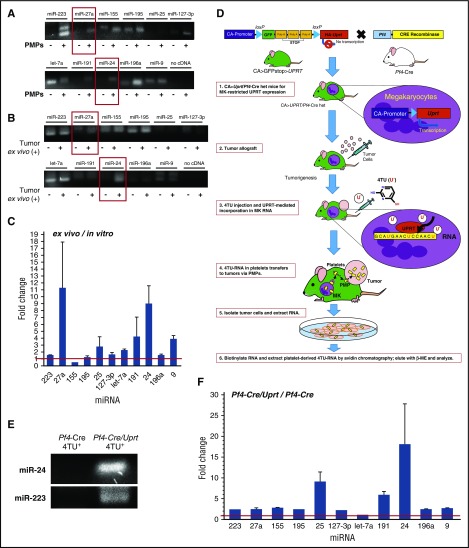
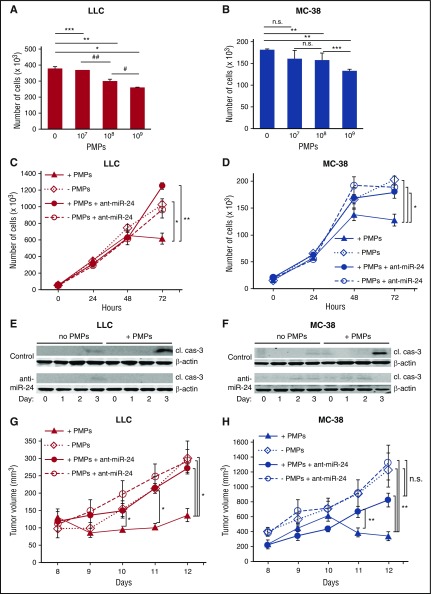
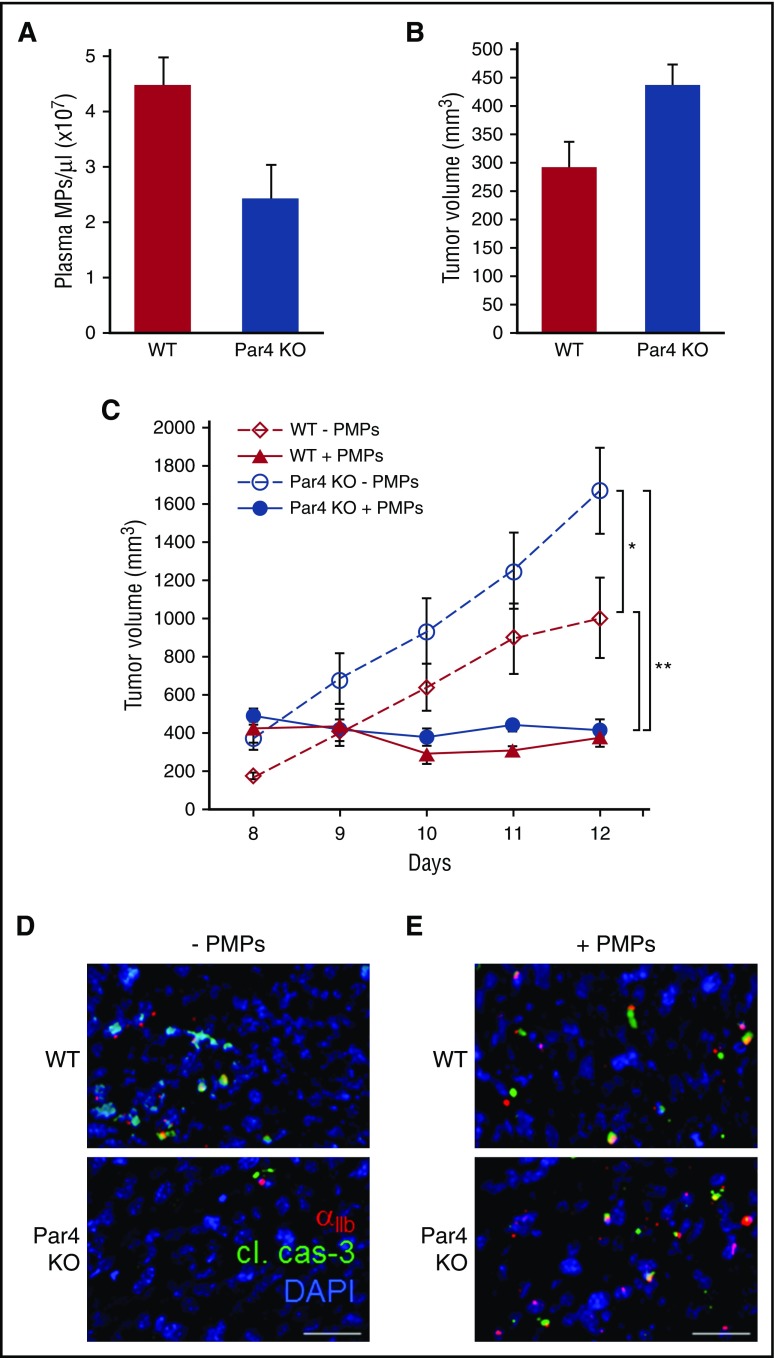
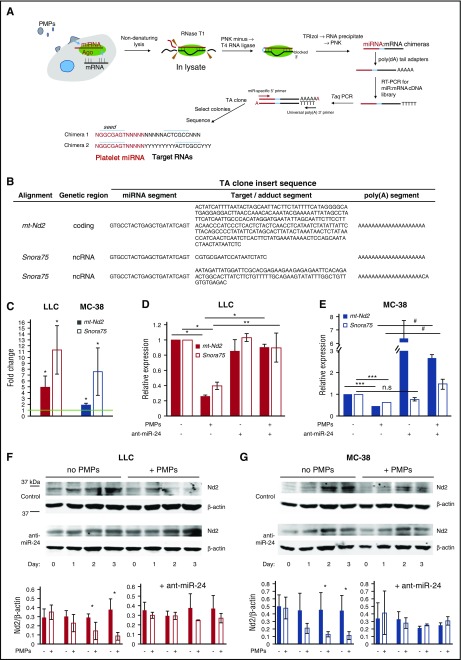
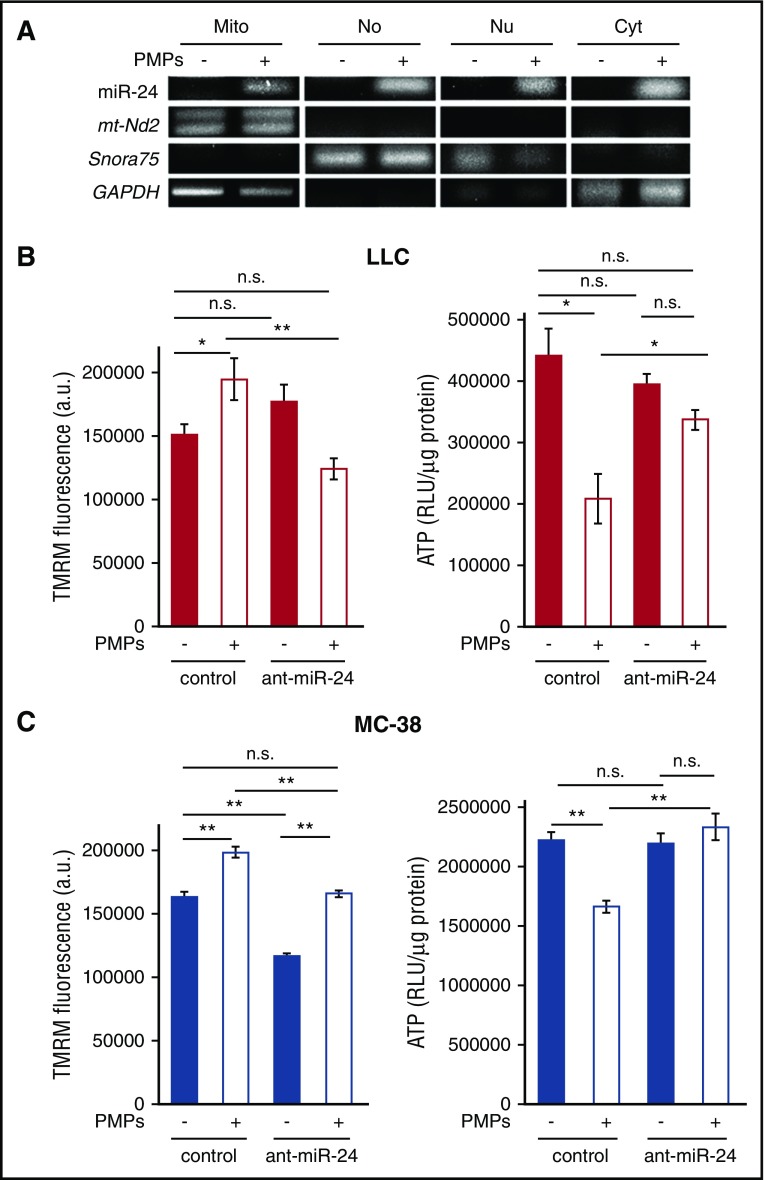
Platelet-derived microparticles (PMPs) are associated with enhancement of metastasis and poor cancer outcomes. Circulating PMPs transfer platelet microRNAs (miRNAs) to vascular cells. Solid tumor vasculature is highly permeable, allowing the possibility of PMP-tumor cell interaction. Here, we show that PMPs infiltrate solid tumors in humans and mice and transfer platelet-derived RNA, including miRNAs, to tumor cells in vivo and in vitro, resulting in tumor cell apoptosis. MiR-24 was a major species in this transfer. PMP transfusion inhibited growth of both lung and colon carcinoma ectopic tumors, whereas blockade of miR-24 in tumor cells accelerated tumor growth in vivo, and prevented tumor growth inhibition by PMPs. Conversely, Par4-deleted mice, which had reduced circulating microparticles (MPs), supported accelerated tumor growth which was halted by PMP transfusion. PMP targeting was associated with tumor cell apoptosis in vivo. We identified direct RNA targets of platelet-derived miR-24 in tumor cells, which included mitochondrial mt-Nd2, and Snora75, a noncoding small nucleolar RNA. These RNAs were suppressed in PMP-treated tumor cells, resulting in mitochondrial dysfunction and growth inhibition, in an miR-24-dependent manner. Thus, platelet-derived miRNAs transfer in vivo to tumor cells in solid tumors via infiltrating MPs, regulate tumor cell gene expression, and modulate tumor progression. These findings provide novel insight into mechanisms of horizontal RNA transfer and add multiple layers to the regulatory roles of miRNAs and PMPs in tumor progression. Plasma MP-mediated transfer of regulatory RNAs and modulation of gene expression may be a common feature with important outcomes in contexts of enhanced vascular permeability.


Conflict of interest statement

Conflict-of-interest disclosure: The authors declare no competing financial interests.

Figures

Figure 1.
Figure 1.
PMP infiltration in solid tumors in human patients. (A) Tissue microarray slides containing 5-μm sections from the indicated human tumors and uninvolved adjacent tissue (“Normal”) were stained with the indicated antibodies and 4′,6-diamidino-2-phenylindole (DAPI). Colon, grade I-II colon carcinoma; lung, grade II lung squamous cell carcinoma; prostate, grade II prostate adenocarcinoma; liver, grade II-III hepatocellular carcinoma; breast, grade II-III invasive ductal carcinoma. αIIb integrin, green; VWF, red; DAPI, blue. Bottom row, center area insets, original magnification ×3. Bars, 50 μm (n = 4). (B) Representative images from panel A, showing counterstain with fluorescein isothiocyanate (FITC)-Annexin V (AXV; shown as red). αIIb integrin, green; DAPI, blue. Merged images with DAPI shown to the right; αIIb integrin/Annexin V overlap appears as yellow. VWF staining was omitted from the merged images for clarity. (C) A section of human lung adenocarcinoma, grade II was incubated with 103 freshly isolated murine platelets for 15 minutes before being fixed and stained as indicated. Yellow arrowheads indicate ectopic intact platelets. (D) Representative images from human lung cancer array with paired uninvolved tissue, stained as in panel A. (E) Representative images from human colon cancer array with paired uninvolved tissue. Note that some αIIb integrin-positive platelets can be seen within VWF-labeled blood vessels. (F) Representative image of colon adenocarcinoma, grade III, including adjacent normal tissue, showing PMP infiltration in the uninvolved tissue adjacent to the tumor border (indicated with a dotted line). Bars (B-F), 25 μm. (G) Percentage of PMP+ tissues from total assayed tissues for colon adenocarcinomas and lung cancers, and adjacent uninvolved tissue, shown ± standard error of the mean (SEM) (n = 3). Colon, P < .01; lung, P < .004. AC, adenocarcinoma; BAC, bronchioalveolar carcinoma; PC, papillary carcinoma; SCC, squamous cell carcinoma; SCLC, small cell lung cancer.
Figure 2.
Figure 2.
PMP infiltration in solid tumor allografts and RNA transfer in mice. (A) Immunohistochemistry (IHC) in a 5-μm section from LLC tumor allograft, 21 days. αIIb integrin, red. (B) IHC in a 5-μm section from LLC tumor allograft, 21 days. αIIb integrin, red (top); CD63, green (middle); DAPI, blue (shown in merged image, bottom). αIIb integrin/CD63 overlap appears in some areas in the merged image as yellow. (C) Tumor cells from a resected LLC tumor at 21 days, isolated as described in supplemental Methods. αIIb integrin, red; DAPI, blue. (D-E) Tumor cells from resected LLC allograft 24 hours after transfusion of AO-labeled platelets. (D) αIIb integrin, red; (E) AO, green. Bars (A-E), 10 μm. *PMP cells. (F) Percentage of cells with cytosolic AO staining, shown ± SEM (n = 3, >100 cells each). (G) Human platelets were transfected with unlabeled siRNA and transfused into mice bearing 20-day LLC tumors. After 24 hours, tumors were resected, digested, cleared of vascular cells with α-CD31 beads, and tumor cells were captured on fibronectin-coated coverslips. (H) Tumor cells ex vivo as in panel G, from mice transfused with human platelets transfected with FAM-siRNA. (I) LLC cells, treated in vitro with PMPs derived from human platelets 48 hours after platelet transfection with unlabeled siRNA. (J) Cells treated as in panel I with PMPs derived from human platelets transfected with FAM-siRNA. (H-J) Human αIIb integrin, red; FAM, green; DAPI, blue. Dashed white lines indicate cell borders as determined from accompanying brightfield images (not shown). Yellow lines indicate x–y plane of z-section. Corresponding z-sections are shown below, minus DAPI stain. Bars (G-J), 7.5 μm; z-stack bars, 1 μm. Asterisks in panels G-J denote apical side of z-section.
Figure 3.
Figure 3.
PMP transfer of platelet miRNAs to tumor cells in solid tumors. (A) Total RNA extracted from LLC cells posttrypsinization, untreated (−) or exposed to PMPs for 16 hours (+), was subjected to poly(dA) tailing, cDNA synthesis, and PCR with the indicated miRNAs as 5′ forward primers, and poly(dT) universal 3′ reverse primers. (B) Total RNA extracted from tumor cells isolated from resected LLC tumors, or from LLCs maintained in culture, was subjected to poly(dA) tailing, cDNA synthesis, and PCR with the indicated miRNAs as 5′ forward primers, and poly(dT) universal 3′ reverse primers. −, LLCs maintained in culture; +, LLCs ex vivo from resected tumors. The red boxes indicate undetectable levels of miR-27a and miR-24 in LLC cells maintained in culture, compared with a band corresponding to each miRNA from LLC cells treated with PMPs (A) or from resected tumors (B). “no cDNA” samples used miR-24 oligonucleotides. (C) qRT-PCR using 5′ forward primers matching indicated miRNAs paired with poly(dT) universal 3′ reverse primers on cDNA from poly(A)-tailed RNA from LLC cells isolated from resected tumors, fold change over expression in LLCs in culture, shown ± SEM. miRNA primers were for 5p arms unless otherwise indicated. P < .05 for each (n = 4). Red line denotes parity. (D) Pf4-Cre/Uprt mice and 4TU RNA labeling, biotinylation, and isolation. (1) CA>GFPstop>Uprt mice and Pf4-Cre mice crossing to generate CA>Uprt/Pf4-Cre heterozygotes, which express UPRT selectively in megakaryocytes (MKs) (> and blue triangle, loxP site). (2) Tumor seeding in the het mice and (3) 4TU (U′) injection for selective incorporation in MK RNA. (4) 4TU-RNA transfers from the MK platelet progeny to tumors via PMPs. (5) Tumor resection and tumor cell isolation by fluorescence-activated cell sorting (FACS), followed by RNA extraction. (6) Platelet-derived 4TU-RNA labeling with N-[6-(Biotinamido)hexyl]-3′-(2′-pyridyldithio)propionamide (HPDP-biotin) added to the total tumor cell RNA, and isolation by affinity chromatography with avidin beads for further analysis. (E) PCR using miR-24 or miR-223 forward and poly(dT) reverse primers on avidin bead eluates from biotinylated RNA from tumor cells from 21-day tumors in 4TU-treated Pf4-Cre+/− (Pf4-Cre) and CA>HA-Uprt+/−Pf4-Cre+/− (Pf4-Cre/Uprt) mice. (F) qRT-PCR from panel E, showing fold change ± SEM in tumor cells extracted from Pf4-Cre/Uprt vs Pf4-Cre mice. Red line denotes parity. Let-7a fold change = 1.2 ± 0.02. P < .03 for each (n = 8). β-ME, β-mercaptoethanol.
Figure 4.
Figure 4.
PMPs induce tumor cell apoptosis and inhibit tumor growth via miR-24. (A) The indicated number of PMPs collected from freshly isolated human platelets was coincubated with 5 × 10⁴ LLC cells every 24 hours. Cells were counted at 60 hours (n = 8). (B) MC-38 cells, treated as assessed as in panel A (n = 3). (A-B) *P < .0007; **P < .001; ***P < .05; #P < .02; ##P < .01. (C) A total of 5 × 10⁴ LLC cells were transfected and treated every 24 hours with 109 freshly isolated PMPs as indicated, and counted daily (n = 5). (D) MC-38 cells transfected, treated, and analyzed as in panel C. (C-D): *P < .03; **P < .04 (n = 3). (E) LLC cells treated as in panel C were harvested and lysates were processed for western blotting with antibodies to cleaved caspase-3 (cl. cas-3) and β-actin. (F) Lysates of MC-38 cells treated as in panel D were processed for western blotting as in panel E (n = 5) for panels E-F. (G) A total of 1 × 10⁶ LLCs were transfected as indicated, and after 18 hours were seeded as allografts by bolus injection into the flanks of WT mice. Beginning at day 8, 1 × 10¹⁰ PMPs freshly isolated from human platelets were counted and transfused daily by tail vein injection. Tumor volumes were measured daily with calipers (n = 6). *P < .02. (H) MC-38 cells were transfected and implanted, followed by PMP transfusion, and tumor growth was monitored as in panel G. **P < .003 (n = 6). All plots, shown ± SEM. n.s., not significant.
Figure 5.
Figure 5.
Plasma MPs and tumor growth in Par4 KO mice. (A) Plasma MPs from WT and Par4 KO mice were analyzed by nanoparticle tracking, and are shown ± SEM (n = 6); P < .03. (B) A total of 1 × 10⁶ LLC cells were seeded in the flanks of WT and Par4 KO mice, and tumor volumes were measured 8 days after seeding, shown ± SEM (n = 6); P < .03. (C) LLC tumors were seeded as in panel B, and 1 × 10¹⁰ freshly isolated PMPs were transfused in the tail vein every 24 hours beginning at day 8 as indicated. Tumor volumes were measured daily, and are shown ± SEM (n = 6); *P < .03; **P < .002. (D) Tumors from panel C were resected, fixed, and processed for IHC with antibodies to murine CD41 (αIIb integrin, red) to label endogenous PMPs, and cleaved caspase-3 (green); DAPI stain is shown in blue. (E) Tumor sections from panel C stained with antibodies to human CD41 (αIIb integrin, red) to label transfused PMPs, cleaved caspase-3 (cl. cas-3, green), and DAPI (blue). Bars, 15 μm.
Figure 6.
Figure 6.
RNA targets of PMP-derived miR-24. (A) Schematic for low-throughput miRNA target identification. PMP-treated cells were lysed posttrypsinization by suspension in hyposmotic buffer followed by sonication. Whole-cell extracts were treated with RNase T1, 3′ end blocking with PNK minus lacking 3′ phosphatase activity, followed by T4 RNA ligase. RNA extracted from these samples with TRIzol was tagged with poly(dA) tails and subjected to first-strand cDNA synthesis, followed by conventional PCR with Taq polymerase using miRNA-specific 5′ primers and poly(dT) 3′ primer, direct cloning of unsorted PCR products into the pCR2.1 (TA) vector, and transformation of the DNA ligation reactions into E coli. Colonies were selected and plasmid DNA preparations were analyzed by conventional sequencing. (B) miR-24:target RNA adduct clones. TA clones with inserts matching unique sequences are shown. The insert sequences are separated in the table into the apparent miRNA segment, the cognate target/adduct segment, and the poly(A) segment. (C) mt-Nd2 and Snora75 RNA enrichment in RISC complexes following tumor cell exposure to PMPs. Shown are qPCR ratios for mt-Nd2 and Snora75 RNA content in Ago2 immunoprecipitate (IP) fractions from LLC (left) or MC-38 cells (right) treated with PMPs, relative to IP fractions from untreated cells. *P < .05 (n = 3). (D) LLC cells were transfected with 25 μg of phosphorothioate, LNA 8-nt control or antagomiR-24 (ant-miR-24), 24 hours prior to PMP exposure. RNA was isolated from cells 16 hours after exposure to PMPs or blank media. qRT-PCR was performed using 100-bp PCR fragments of each transcript, and relative expression levels were quantified using GAPDH as a housekeeping gene control, normalized to target RNA expression in untreated cells, shown as 1. *P < .001; **P < .05 (n = 7). (E) MC-38 cells treated and analyzed as in panel D. ***P < .01; #P < .02 (n = 5). All histograms, shown ± SEM. (F-G) Western blotting with α-mt-Nd2 antibodies (Nd2) of lysates of cells treated with PMPs for up to 3 days. β-actin was used as a loading control. Densitometry results are shown for Nd2/β-actin ratios, ± SEM for 3 independent experiments. *P < .05, all others n.s.
Figure 7.
Figure 7.
PMP-transferred miR-24 inhibits mitochondrial function in tumor cells. (A) cDNA from RNA isolated from mitochondria (Mito), nucleolar (No), nuclear (Nu), and postmitochondria (Cyto) fractions of untreated and PMP-treated LLC cells (−/+) was subject to PCR for the indicated genes. (B) Mitochondrial membrane potential (TMRM, left) and ATP levels (right) were assessed in LLC cells ± PMPs and antagomiR-24 as indicated. (C) TMRM (left) and ATP (right) in MC-38 cells, treated as in panel B. *P < .01; **P < .0001 (n = 3). All histograms, shown ± SEM. RLU, relative luminescence unit.

Comment in

Similar articles

Cited by

References

    1. Gasic GJ, Gasic TB, Stewart CC. Antimetastatic effects associated with platelet reduction. Proc Natl Acad Sci USA. 1968;61:46-52. - PMC - PubMed
    1. Camerer E, Qazi AA, Duong DN, Cornelissen I, Advincula R, Coughlin SR. Platelets, protease-activated receptors, and fibrinogen in hematogenous metastasis. Blood. 2004;104(2):397-401. - PubMed
    1. Kim YJ, Borsig L, Varki NM, Varki A. P-selectin deficiency attenuates tumor growth and metastasis. Proc Natl Acad Sci USA. 1998;95(16):9325-9330. - PMC - PubMed
    1. Labelle M, Begum S, Hynes RO. Platelets guide the formation of early metastatic niches. Proc Natl Acad Sci USA. 2014;111(30):E3053-E3061. - PMC - PubMed
    1. Gay LJ, Felding-Habermann B. Platelets alter tumor cell attributes to propel metastasis: programming in transit. Cancer Cell. 2011;20(5):553-554. - PubMed

Publication types

MeSH terms