Habitual coffee consumption and genetic predisposition to obesity: gene-diet interaction analyses in three US prospective studies
- PMID: 28486942
- PMCID: PMC5424298
- DOI: 10.1186/s12916-017-0862-0
Habitual coffee consumption and genetic predisposition to obesity: gene-diet interaction analyses in three US prospective studies
Abstract
Background: Whether habitual coffee consumption interacts with the genetic predisposition to obesity in relation to body mass index (BMI) and obesity is unknown.
Methods: We analyzed the interactions between genetic predisposition and habitual coffee consumption in relation to BMI and obesity risk in 5116 men from the Health Professionals Follow-up Study (HPFS), in 9841 women from the Nurses' Health Study (NHS), and in 5648 women from the Women's Health Initiative (WHI). The genetic risk score was calculated based on 77 BMI-associated loci. Coffee consumption was examined prospectively in relation to BMI.
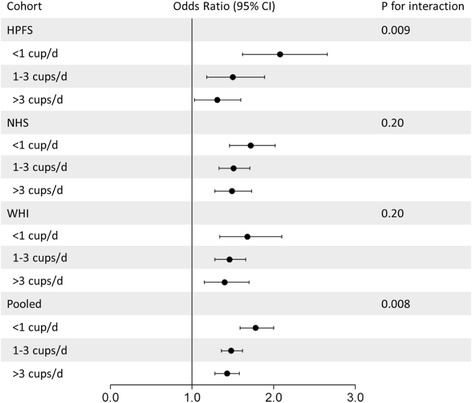
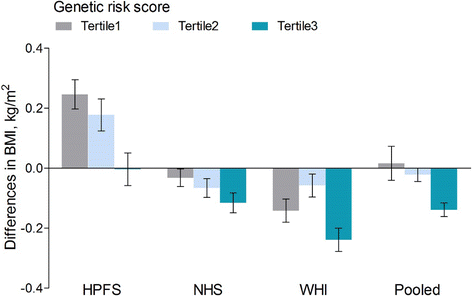
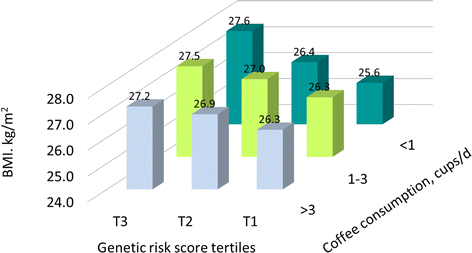
Results: The genetic association with BMI was attenuated among participants with higher consumption of coffee than among those with lower consumption in the HPFS (P interaction = 0.023) and NHS (P interaction = 0.039); similar results were replicated in the WHI (P interaction = 0.044). In the combined data of all cohorts, differences in BMI per increment of 10-risk allele were 1.38 (standard error (SE), 0.28), 1.02 (SE, 0.10), and 0.95 (SE, 0.12) kg/m2 for coffee consumption of < 1, 1-3 and > 3 cup(s)/day, respectively (P interaction < 0.001). Such interaction was partly due to slightly higher BMI with higher coffee consumption among participants at lower genetic risk and slightly lower BMI with higher coffee consumption among those at higher genetic risk. Each increment of 10-risk allele was associated with 78% (95% confidence interval (CI), 59-99%), 48% (95% CI, 36-62%), and 43% (95% CI, 28-59%) increased risk for obesity across these subgroups of coffee consumption (P interaction = 0.008). From another perspective, differences in BMI per increment of 1 cup/day coffee consumption were 0.02 (SE, 0.09), -0.02 (SE, 0.04), and -0.14 (SE, 0.04) kg/m2 across tertiles of the genetic risk score.
Conclusions: Higher coffee consumption might attenuate the genetic associations with BMI and obesity risk, and individuals with greater genetic predisposition to obesity appeared to have lower BMI associated with higher coffee consumption.
Keywords: Body mass index; Coffee; Gene-diet interaction; Genetic predisposition; Obesity.
Figures


Similar articles
-
Fried food consumption, genetic risk, and body mass index: gene-diet interaction analysis in three US cohort studies.BMJ. 2014 Mar 19;348:g1610. doi: 10.1136/bmj.g1610. BMJ. 2014. PMID: 24646652 Free PMC article.
-
Habitual consumption of long-chain n-3 PUFAs and fish attenuates genetically associated long-term weight gain.Am J Clin Nutr. 2019 Mar 1;109(3):665-673. doi: 10.1093/ajcn/nqy238. Am J Clin Nutr. 2019. PMID: 30629107 Free PMC article. Clinical Trial.
-
Sugar-sweetened beverages and genetic risk of obesity.N Engl J Med. 2012 Oct 11;367(15):1387-96. doi: 10.1056/NEJMoa1203039. Epub 2012 Sep 21. N Engl J Med. 2012. PMID: 22998338 Free PMC article.
-
Obesity and eating behavior from the perspective of twin and genetic research.Neurosci Biobehav Rev. 2020 Feb;109:150-165. doi: 10.1016/j.neubiorev.2019.12.012. Neurosci Biobehav Rev. 2020. PMID: 31959301 Review.
-
Interplay between diet and genetic susceptibility in obesity and related traits.Front Med. 2018 Dec;12(6):601-607. doi: 10.1007/s11684-018-0648-6. Epub 2018 Nov 9. Front Med. 2018. PMID: 30413949 Review.
Cited by
-
The "Virtual Digital Twins" Concept in Precision Nutrition.Adv Nutr. 2020 Nov 16;11(6):1405-1413. doi: 10.1093/advances/nmaa089. Adv Nutr. 2020. PMID: 32770212 Free PMC article.
-
Physical Activity Might Reduce the Adverse Impacts of the FTO Gene Variant rs3751812 on the Body Mass Index of Adults in Taiwan.Genes (Basel). 2019 May 9;10(5):354. doi: 10.3390/genes10050354. Genes (Basel). 2019. PMID: 31075924 Free PMC article. Review.
-
Genome-wide association studies of coffee intake in UK/US participants of European ancestry uncover cohort-specific genetic associations.Neuropsychopharmacology. 2024 Sep;49(10):1609-1618. doi: 10.1038/s41386-024-01870-x. Epub 2024 Jun 11. Neuropsychopharmacology. 2024. PMID: 38858598
-
In the context of the triple burden of malnutrition: A systematic review of gene-diet interactions and nutritional status.Crit Rev Food Sci Nutr. 2024;64(11):3235-3263. doi: 10.1080/10408398.2022.2131727. Epub 2022 Oct 12. Crit Rev Food Sci Nutr. 2024. PMID: 36222100 Free PMC article.
-
Polygenic risk for obesity and its interaction with lifestyle and sociodemographic factors in European children and adolescents.Int J Obes (Lond). 2021 Jun;45(6):1321-1330. doi: 10.1038/s41366-021-00795-5. Epub 2021 Mar 22. Int J Obes (Lond). 2021. PMID: 33753884 Free PMC article.
References
-
- Lopez-Garcia E, van Dam RM, Rajpathak S, Willett WC, Manson JE, Hu FB. Changes in caffeine intake and long-term weight change in men and women. Am J Clin Nutr. 2006;83:674–80. - PubMed
MeSH terms
Substances
Grants and funding
- R01 DK078616/DK/NIDDK NIH HHS/United States
- HHSN268201100001I/HL/NHLBI NIH HHS/United States
- R01 CA118553/CA/NCI NIH HHS/United States
- U01 HG004728/HG/NHGRI NIH HHS/United States
- HHSN268201100004I/HL/NHLBI NIH HHS/United States
- UL1 TR001863/TR/NCATS NIH HHS/United States
- HHSN268201100046C/HL/NHLBI NIH HHS/United States
- R01 DK091718/DK/NIDDK NIH HHS/United States
- HHSN268201100003C/WH/WHI NIH HHS/United States
- R21 HL126024/HL/NHLBI NIH HHS/United States
- HHSN271201100004C/AG/NIA NIH HHS/United States
- R01 EY022305/EY/NEI NIH HHS/United States
- R01 HL034594/HL/NHLBI NIH HHS/United States
- UM1 CA186107/CA/NCI NIH HHS/United States
- R01 EY015473/EY/NEI NIH HHS/United States
- HHSN268201100002C/WH/WHI NIH HHS/United States
- U01 DK078616/DK/NIDDK NIH HHS/United States
- R01 DK100383/DK/NIDDK NIH HHS/United States
- R01 HL071981/HL/NHLBI NIH HHS/United States
- UM1 CA167552/CA/NCI NIH HHS/United States
- R01 CA049449/CA/NCI NIH HHS/United States
- HHSN268201100002I/HL/NHLBI NIH HHS/United States
- U01 CA049449/CA/NCI NIH HHS/United States
- HHSN268201100001C/WH/WHI NIH HHS/United States
- HHSN268201100004C/WH/WHI NIH HHS/United States
LinkOut - more resources
Full Text Sources
Other Literature Sources
Medical

