Different phosphoisoforms of RNA polymerase II engage the Rtt103 termination factor in a structurally analogous manner
- PMID: 28465432
- PMCID: PMC5441780
- DOI: 10.1073/pnas.1700128114
Different phosphoisoforms of RNA polymerase II engage the Rtt103 termination factor in a structurally analogous manner
Abstract
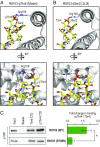
The carboxyl-terminal domain (CTD) of the largest subunit of RNA polymerase II (Pol II) orchestrates dynamic recruitment of specific cellular machines during different stages of transcription. Signature phosphorylation patterns of Y1S2P3T4S5P6S7 heptapeptide repeats of the CTD engage specific "readers." Whereas phospho-Ser5 and phospho-Ser2 marks are ubiquitous, phospho-Thr4 is reported to only impact specific genes. Here, we identify a role for phospho-Thr4 in transcription termination at noncoding small nucleolar RNA (snoRNA) genes. Quantitative proteomics reveals an interactome of known readers as well as protein complexes that were not known to rely on Thr4 for association with Pol II. The data indicate a key role for Thr4 in engaging the machinery used for transcription elongation and termination. We focus on Rtt103, a protein that binds phospho-Ser2 and phospho-Thr4 marks and facilitates transcription termination at protein-coding genes. To elucidate how Rtt103 engages two distinct CTD modifications that are differentially enriched at noncoding genes, we relied on NMR analysis of Rtt103 in complex with phospho-Thr4- or phospho-Ser2-bearing CTD peptides. The structural data reveal that Rtt103 interacts with phospho-Thr4 in a manner analogous to its interaction with phospho-Ser2-modified CTD. The same set of hydrogen bonds involving either the oxygen on phospho-Thr4 and the hydroxyl on Ser2, or the phosphate on Ser2 and the Thr4 hydroxyl, can be formed by rotation of an arginine side chain, leaving the intermolecular interface otherwise unperturbed. This economy of design enables Rtt103 to engage Pol II at distinct sets of genes with differentially enriched CTD marks.
Keywords: CTD code; CTD interactome; NMR; noncoding RNA; phosphothreonine.
Conflict of interest statement
Conflict of interest statement: A.Z.A. is the sole member of VistaMotif, LLC and founder of the nonprofit WINStep Forward.
Figures


Similar articles
-
Noncanonical CTD kinases regulate RNA polymerase II in a gene-class-specific manner.Nat Chem Biol. 2019 Feb;15(2):123-131. doi: 10.1038/s41589-018-0194-1. Epub 2018 Dec 31. Nat Chem Biol. 2019. PMID: 30598543 Free PMC article.
-
The role of Ctk1 kinase in termination of small non-coding RNAs.PLoS One. 2013 Dec 4;8(12):e80495. doi: 10.1371/journal.pone.0080495. eCollection 2013. PLoS One. 2013. PMID: 24324601 Free PMC article.
-
Structural insight into recognition of phosphorylated threonine-4 of RNA polymerase II C-terminal domain by Rtt103p.EMBO Rep. 2017 Jun;18(6):906-913. doi: 10.15252/embr.201643723. Epub 2017 May 2. EMBO Rep. 2017. PMID: 28468956 Free PMC article.
-
Dynamic phosphorylation patterns of RNA polymerase II CTD during transcription.Biochim Biophys Acta. 2013 Jan;1829(1):55-62. doi: 10.1016/j.bbagrm.2012.08.013. Epub 2012 Sep 7. Biochim Biophys Acta. 2013. PMID: 22982363 Review.
-
Tyrosine-1 and threonine-4 phosphorylation marks complete the RNA polymerase II CTD phospho-code.RNA Biol. 2012 Sep;9(9):1144-6. doi: 10.4161/rna.21726. Epub 2012 Sep 1. RNA Biol. 2012. PMID: 22960391 Free PMC article. Review.
Cited by
-
The nucleosome DNA entry-exit site is important for transcription termination and prevention of pervasive transcription.Elife. 2020 Aug 26;9:e57757. doi: 10.7554/eLife.57757. Elife. 2020. PMID: 32845241 Free PMC article.
-
Transcription termination complex, Rtt103-Rai1-Rat1, regulates sub-telomeric transcripts in Saccharomyces cerevisiae.RNA Biol. 2023 Jan;20(1):95-108. doi: 10.1080/15476286.2023.2192552. RNA Biol. 2023. PMID: 36974034 Free PMC article.
-
Simplicity is the Ultimate Sophistication-Crosstalk of Post-translational Modifications on the RNA Polymerase II.J Mol Biol. 2021 Jul 9;433(14):166912. doi: 10.1016/j.jmb.2021.166912. Epub 2021 Mar 5. J Mol Biol. 2021. PMID: 33676925 Free PMC article. Review.
-
Writing a wrong: Coupled RNA polymerase II transcription and RNA quality control.Wiley Interdiscip Rev RNA. 2019 Jul;10(4):e1529. doi: 10.1002/wrna.1529. Epub 2019 Mar 7. Wiley Interdiscip Rev RNA. 2019. PMID: 30848101 Free PMC article. Review.
-
RNA-Mediated Regulation of Meiosis in Budding Yeast.Noncoding RNA. 2022 Nov 15;8(6):77. doi: 10.3390/ncrna8060077. Noncoding RNA. 2022. PMID: 36412912 Free PMC article. Review.
References
-
- Eick D, Geyer M. The RNA polymerase II carboxy-terminal domain (CTD) code. Chem Rev. 2013;113:8456–8490. - PubMed
-
- Zaborowska J, Egloff S, Murphy S. The pol II CTD: New twists in the tail. Nat Struct Mol Biol. 2016;23:771–777. - PubMed
-
- Phatnani HP, Greenleaf AL. Phosphorylation and functions of the RNA polymerase II CTD. Genes Dev. 2006;20:2922–2936. - PubMed
Publication types
MeSH terms
Substances
Grants and funding
LinkOut - more resources
Full Text Sources
Other Literature Sources
Molecular Biology Databases

