

Zika virus infection reprograms global transcription of host cells to allow sustained infection
- PMID: 28442752
- PMCID: PMC5457678
- DOI: 10.1038/emi.2017.9
Zika virus infection reprograms global transcription of host cells to allow sustained infection
Abstract
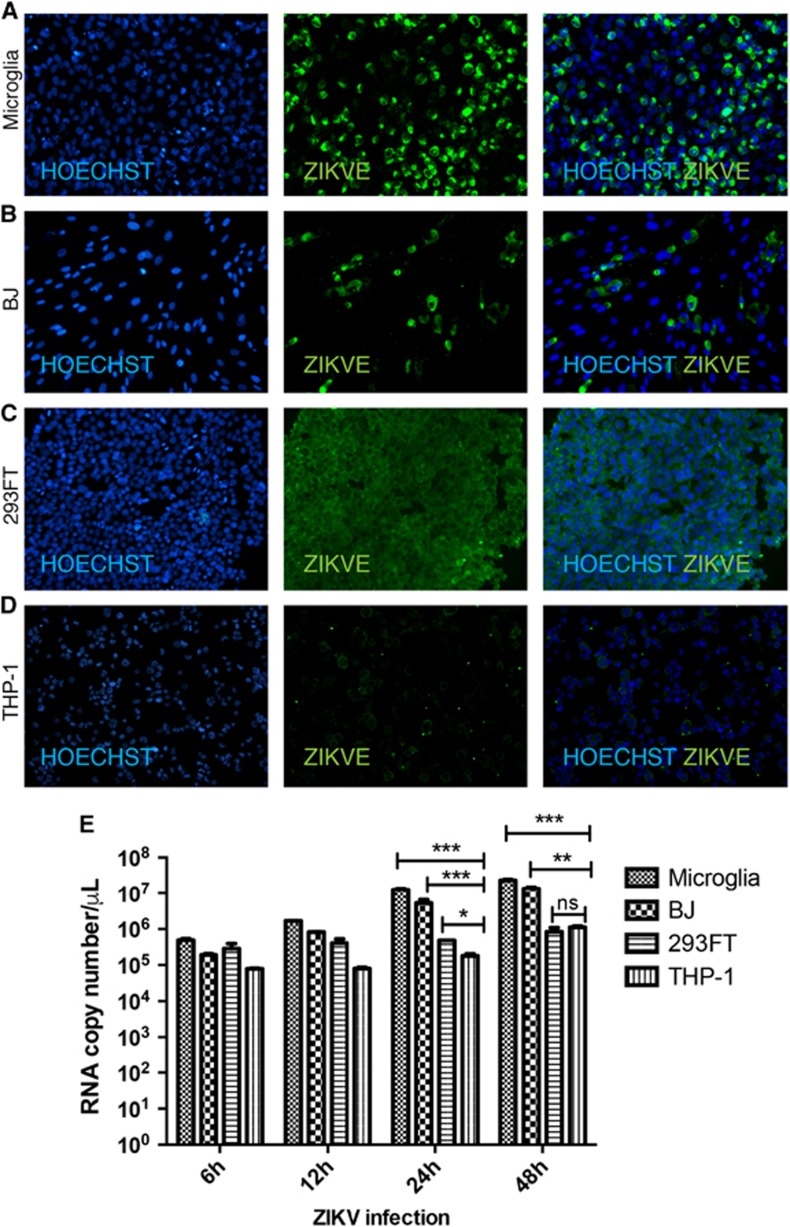
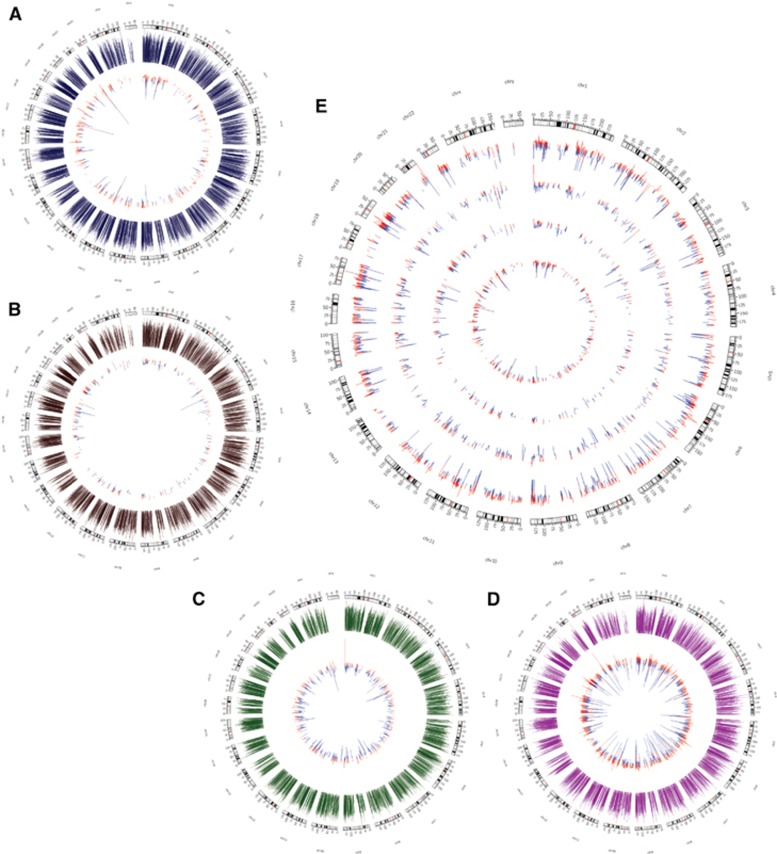
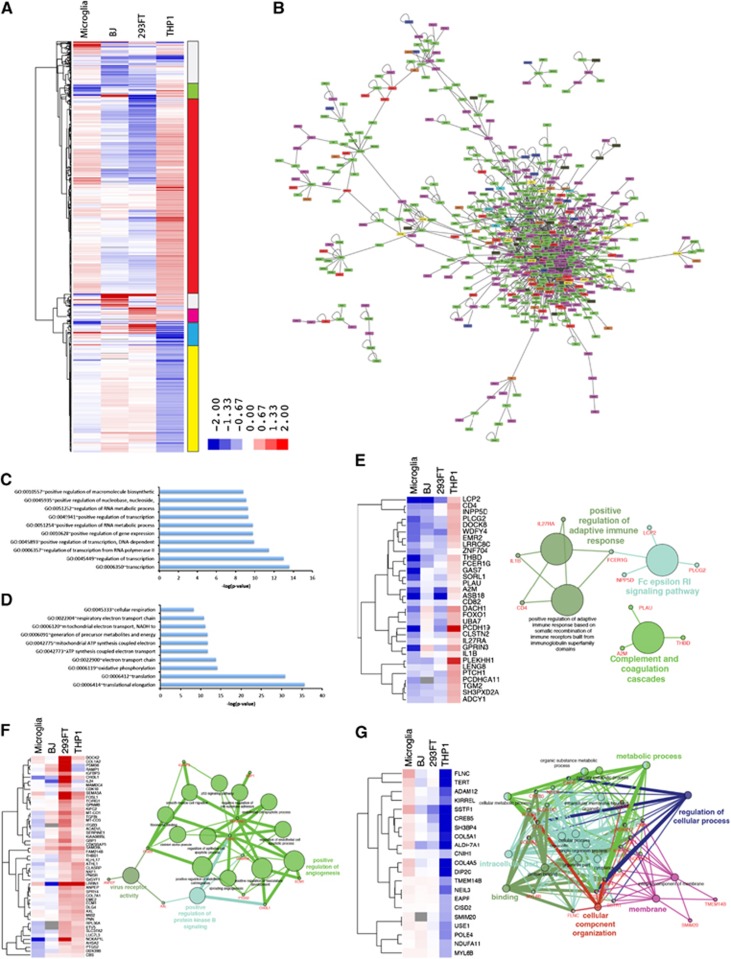
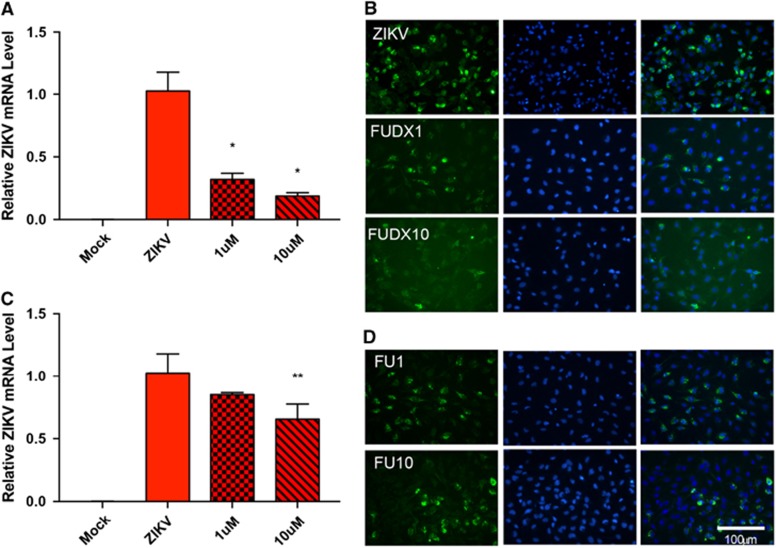
Zika virus (ZIKV) is an emerging virus causally linked to neurological disorders, including congenital microcephaly and Guillain-Barré syndrome. There are currently no targeted therapies for ZIKV infection. To identify novel antiviral targets and to elucidate the mechanisms by which ZIKV exploits the host cell machinery to support sustained replication, we analyzed the transcriptomic landscape of human microglia, fibroblast, embryonic kidney and monocyte-derived macrophage cell lines before and after ZIKV infection. The four cell types differed in their susceptibility to ZIKV infection, consistent with differences in their expression of viral response genes before infection. Clustering and network analyses of genes differentially expressed after ZIKV infection revealed changes related to the adaptive immune system, angiogenesis and host metabolic processes that are conducive to sustained viral production. Genes related to the adaptive immune response were downregulated in microglia cells, suggesting that ZIKV effectively evades the immune response after reaching the central nervous system. Like other viruses, ZIKV diverts host cell resources and reprograms the metabolic machinery to support RNA metabolism, ATP production and glycolysis. Consistent with these transcriptomic analyses, nucleoside metabolic inhibitors abrogated ZIKV replication in microglia cells.
Figures

Similar articles
-
Quantitative Proteomic Analysis of Mosquito C6/36 Cells Reveals Host Proteins Involved in Zika Virus Infection.J Virol. 2017 May 26;91(12):e00554-17. doi: 10.1128/JVI.00554-17. Print 2017 Jun 15. J Virol. 2017. PMID: 28404849 Free PMC article.
-
Development and Characterization of Recombinant Virus Generated from a New World Zika Virus Infectious Clone.J Virol. 2016 Dec 16;91(1):e01765-16. doi: 10.1128/JVI.01765-16. Print 2017 Jan 1. J Virol. 2016. PMID: 27795432 Free PMC article.
-
ZIKV infection effects changes in gene splicing, isoform composition and lncRNA expression in human neural progenitor cells.Virol J. 2017 Nov 7;14(1):217. doi: 10.1186/s12985-017-0882-6. Virol J. 2017. PMID: 29116029 Free PMC article.
-
Zika Virus: Emergence, Phylogenetics, Challenges, and Opportunities.ACS Infect Dis. 2016 Nov 11;2(11):763-772. doi: 10.1021/acsinfecdis.6b00161. Epub 2016 Oct 12. ACS Infect Dis. 2016. PMID: 27704772 Review.
-
Functional RNA during Zika virus infection.Virus Res. 2018 Aug 2;254:41-53. doi: 10.1016/j.virusres.2017.08.015. Epub 2017 Aug 31. Virus Res. 2018. PMID: 28864425 Review.
Cited by
-
Iminosugars With Endoplasmic Reticulum α-Glucosidase Inhibitor Activity Inhibit ZIKV Replication and Reverse Cytopathogenicity in vitro.Front Microbiol. 2020 Apr 7;11:531. doi: 10.3389/fmicb.2020.00531. eCollection 2020. Front Microbiol. 2020. PMID: 32373079 Free PMC article.
-
Zika virus depletes neural stem cells and evades selective autophagy by suppressing the Fanconi anemia protein FANCC.EMBO Rep. 2020 Dec 3;21(12):e49183. doi: 10.15252/embr.201949183. Epub 2020 Oct 19. EMBO Rep. 2020. PMID: 33073500 Free PMC article.
-
Zika Virus and the Metabolism of Neuronal Cells.Mol Neurobiol. 2019 Apr;56(4):2551-2557. doi: 10.1007/s12035-018-1263-x. Epub 2018 Jul 24. Mol Neurobiol. 2019. PMID: 30043260 Free PMC article. Review.
-
The potential contribution of impaired brain glucose metabolism to congenital Zika syndrome.J Anat. 2019 Sep;235(3):468-480. doi: 10.1111/joa.12959. Epub 2019 Feb 21. J Anat. 2019. PMID: 30793304 Free PMC article. Review.
-
Zika Virus: What Have We Learnt Since the Start of the Recent Epidemic?Front Microbiol. 2017 Aug 22;8:1554. doi: 10.3389/fmicb.2017.01554. eCollection 2017. Front Microbiol. 2017. PMID: 28878742 Free PMC article. Review.
References
-
- D'Ortenzio E, Matheron S, de Lamballerie X et al. Evidence of sexual transmission of Zika virus. N Engl J Med 2016; 374: 2195–2198. - PubMed
-
- Moreira J, Lamas CC, Siqueira A. Sexual transmission of Zika virus: implications for clinical care and public health policy. Clin Infect Dis 2016; 63: 141–142. - PubMed
-
- Dick GW, Kitchen SF, Haddow AJ. Zika virus. I. Isolations and serological specificity. Trans R Soc Trop Med Hyg 1952; 46: 509–520. - PubMed
MeSH terms
Substances
Grants and funding
LinkOut - more resources
Full Text Sources
Other Literature Sources
Medical
Molecular Biology Databases