. 2017 Jun 15;37(13):e00626-16.
doi: 10.1128/MCB.00626-16. Print 2017 Jul 1.

A Kinase-Independent Role for Cyclin-Dependent Kinase 19 in p53 Response

Affiliations

A Kinase-Independent Role for Cyclin-Dependent Kinase 19 in p53 Response

K Audrey Audetat et al. Mol Cell Biol. .

Abstract

The human Mediator complex regulates RNA polymerase II transcription genome-wide. A general factor that regulates Mediator function is the four-subunit kinase module, which contains either cyclin-dependent kinase 8 (CDK8) or CDK19. Whereas CDK8 is linked to specific signaling cascades and oncogenesis, the cellular roles of its paralog, CDK19, are poorly studied. We discovered that osteosarcoma cells (SJSA) are naturally depleted of CDK8 protein. Whereas stable CDK19 knockdown was tolerated in SJSA cells, proliferation was reduced. Notably, proliferation defects were rescued upon the reexpression of wild-type or kinase-dead CDK19. Comparative RNA sequencing analyses showed reduced expression of mitotic genes and activation of genes associated with cholesterol metabolism and the p53 pathway in CDK19 knockdown cells. SJSA cells treated with 5-fluorouracil, which induces metabolic and genotoxic stress and activates p53, further implicated CDK19 in p53 target gene expression. To better probe the p53 response, SJSA cells (shCDK19 versus shCTRL) were treated with the p53 activator nutlin-3. Remarkably, CDK19 was required for SJSA cells to return to a proliferative state after nutlin-3 treatment, and this effect was kinase independent. These results implicate CDK19 as a regulator of p53 stress responses and suggest a role for CDK19 in cellular resistance to nutlin-3.

Keywords: 5-FU; 5-fluorouracil; CDK19; CDK8; Mediator kinase; RNA-Seq; SJSA; cholesterol; cortistatin A; drug resistance; nutlin; nutlin-3; osteosarcoma; p53; stress; transcription.


Figures

FIG 1
FIG 1
SJSA cells lack CDK8 protein but retain CDK19. (A) Western analysis of multiple cancer cell lines from a variety of tissue types. CDK19 levels vary among cell types, whereas CDK8 is consistently expressed, except in SJSA cells. (B and C) Western (B) and qRT-PCR (C) analyses showing the levels of CDK19 protein and mRNA in control knockdown (shCTRL) or CDK19 knockdown (shCDK19) SJSA cells. (D) Western data confirming that CDK8 protein levels are not induced upon CDK19 knockdown.
FIG 2
FIG 2
SJSA cell growth is inhibited upon CDK19 knockdown but rescued with WT or kinase-dead CDK19. (A) Growth curve of shCTRL and shCDK19 SJSA cells under normal growth conditions. (B) Western blot showing expression levels of CDK19 proteins following transfection with indicated plasmids. (C and D) Transient expression of wild-type CDK19 (C) or kinase-dead CDK19 (D; D151A or D173A) rescues the lowered growth rate of shCDK19 cells.
FIG 3
FIG 3
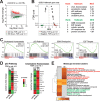
Gene expression (RNA-Seq) changes due to CDK19 knockdown affect the p53 pathway, mitosis, and cholesterol homeostasis. (A) MA plot comparing control and CDK19 knockdown SJSA cells. (B) Plot of false discovery rate (FDR) versus the normalized enrichment score (NES) based upon GSEA from RNA-Seq data (shCDK19 versus shCTRL). The dashed line represents the 0.1 FDR cutoff. Note that the p53 pathway and cholesterol homeostasis are positively enriched in CDK19 knockdown cells, whereas gene sets associated with mitosis are negatively enriched. The top five ranked positively and negatively enriched gene sets are shown on the right. (C) GSEA plots for selected hallmark gene sets, with black bars indicating gene sets represented among all genes ranked by log2-fold change (shCDK19 versus shCTRL). (D) Heat maps showing average expression, calculated from the reads per kilobase per million (RPKM), of the p53 pathway and cholesterol homeostasis genes; only genes meeting an FDR q < 0.1 threshold are shown. (E) Heat map of Metascape-enriched clusters. Each cluster contains multiple gene sets to eliminate redundancy. Analysis used genes meeting an FDR q < 0.1 threshold.
FIG 4
FIG 4
SJSA transcriptional response to 5-FU. (A) MA plot comparing RNA-Seq data from shCTRL SJSA cells after 5-FU treatment (versus DMSO control). (B) Plot of FDR versus the normalized enrichment score (NES) based upon GSEA from RNA-Seq data (shCTRL cells, 5-FU versus DMSO). The dashed line represents 0.1 FDR cutoff. As expected, stress response (e.g., p53 pathway) gene sets are enriched, whereas proliferative gene sets (e.g., G2/M checkpoint) are reduced in 5-FU treated cells. (C) Top five ranked positively and negatively enriched gene sets and GSEA plots for p53 pathway and E2F targets.
FIG 5
FIG 5
Transcriptional response to 5-FU is dampened in CDK19 knockdown cells. (A) MA plot comparing RNA-Seq data from shCDK19 SJSA cells after 5-FU treatment (versus DMSO control). Compared to shCTRL cells (Fig. 4A), the shCDK19 cells show an overall decreased transcriptional response. (B) Plot of FDR versus the NES based upon GSEA from RNA-Seq data (shCDK19 cells, 5-FU versus DMSO). The dashed line represents 0.1 FDR cutoff. The top five ranked positively and negatively enriched gene sets are shown at right. (C) GSEA plots for p53 pathway and E2F targets. (D) Western blot showing expression levels of CDK19 and p53 in the control and CDK19 knockdown SJSA cells after 5-FU treatment.
FIG 6
FIG 6
Differential p53 pathway activation in shCDK19 cells. (A) Heat maps showing average expression (calculated from the RPKM) of p53 pathway genes under conditions tested in this study; only genes meeting an FDR q < 0.1 threshold are shown. (B) Heat map of Metascape-enriched clusters (each cluster contains multiple gene sets to eliminate redundancy) in 5-FU-treated cells (shCDK19 or shCTRL), separated by up- or downregulated. Analysis used genes meeting an FDR q < 0.1 threshold. (C) Venn diagram showing overlap of differentially expressed genes in shCTRL versus shCDK19 cells upon 5-FU treatment (i.e., shCTRL data from Fig. 4A and shCDK19 data from Fig. 5A).
FIG 7
FIG 7
CDK19 knockdown sensitizes SJSA cells to nutlin-3. (A) Western blot data showing stabilization of p53 protein in nutlin-3-treated cells; p21, PUMA, and cleaved caspase-3 also induced in nutlin-treated shCTRL or shCDK19 cells. (B) qRT-PCR analyses confirm that nutlin-3 induces p53 target gene expression and reveal that, as suggested in 5-FU-treated cells, induction of select p53 targets is diminished in shCDK19 cells. (C) Cell proliferation following 24 h of nutlin-3 treatment (shCTRL or shCDK19). Whereas shCTRL cells recover to a proliferative state, shCDK19 cells do not (inset: cell counts immediately after nutlin-3 treatment). (D and E) Rescue expression of WT CDK19 (D) or kinase-dead versions of CDK19 (E) reestablish cell proliferation after nutlin-3 treatment, indicating that the physical presence of CDK19 is important for SJSA cells to return to a proliferative state following nutlin-3 treatment. (F) The Mediator kinase inhibitor CA, which inhibits both CDK8 and CDK19 (5), does not negatively affect SJSA cell recovery following nutlin-3 treatment, further implicating the CDK19 protein, not its kinase activity per se, as the underlying cause for the nutlin sensitivity.
FIG 8
FIG 8
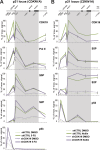
CDK19 associates with p53 target gene CDKN1A; knockdown does not notably affect Pol II or p53 occupancy. (A) ChIP data comparing DMSO- and 5-FU-treated cells. A scheme of the p21 locus is shown at the top. Numbers indicate primer positions used for gene tiling. Positions are given as the distance from the transcription start site. Proteins probed by ChIP are shown at the upper right of each plot. The key for each experiment is shown at the bottom. (B) ChIP data comparing DMSO- and nutlin-treated cells (6 h treatment). The scheme of the p21 locus is shown at the top. Numbers indicate primer positions used for gene tiling. Positions are given as the distance from the transcription start site. Proteins probed by ChIP are shown at the upper right of each plot. The key for each experiment is shown at bottom.
FIG 9
FIG 9
Analysis of cholesterol in shCTRL versus shCDK19 cells. (A) Total cholesterol levels in each cell line. (B) Supplementation of culture media with MVA and MVAP, which are cholesterol biosynthesis intermediates, did not affect cell recovery after treatment with nutlin-3.
FIG 10
FIG 10
CDK8 can rescue growth defects in shCDK19 cells. (A) Western blot showing expression levels of CDK8 after transfection with empty vector or CDK8 expression plasmids. (B) Expression of CDK8 rescues the lowered growth rate of shCDK19 cells. (C) Expression of CDK8 rescues the proliferation defect in shCDK19 cells treated with nutlin-3. A low transfection efficiency (estimated to be ∼24%) likely contributes to the inability of the rescue to match shCTRL cells.

Similar articles

Cited by

References

    1. Allen BL, Taatjes DJ. 2015. The Mediator complex: a central integrator of transcription. Nat Rev Mol Cell Biol 16:155–166. doi:10.1038/nrm3951. - DOI - PMC - PubMed
    1. Daniels DL, Ford M, Schwinn MK, Benink H, Galbraith MD, Amunugama R, Jones R, Allen D, Okazaki N, Yamakawa H, Miki F, Nagase T, Espinosa JM, Urh M. 2013. Mutual exclusivity of MED12/MED12L, MED13/13L, and CDK8/19 paralogs revealed within the CDK-Mediator kinase module. J Proteomics Bioinform S2:004.
    1. Galbraith MD, Allen MA, Bensard CL, Wang X, Schwinn MK, Qin B, Long HW, Daniels DL, Hahn WC, Dowell RD, Espinosa JM. 2013. HIF1A employs CDK8-mediator to stimulate RNAPII elongation in response to hypoxia. Cell 153:1327–1339. doi:10.1016/j.cell.2013.04.048. - DOI - PMC - PubMed
    1. Kagey M, Newman J, Bilodeau S, Zhan Y, Van Berkum N, Orlando DA, Ebmeier CC, Goossens J, Rahl P, Levine S, Taatjes DJ, Dekker J, Young RA. 2010. Mediator and Cohesin connect gene expression and chromatin architecture. Nature 467:430–435. doi:10.1038/nature09380. - DOI - PMC - PubMed
    1. Pelish HE, Liau BB, Nitulescu II, Tangpeerachaikul A, Poss ZC, Da Silva DH, Caruso BT, Arefolov A, Fadeyi O, Christie AL, Du K, Banka D, Schneider EV, Jestel A, Zou G, Si C, Ebmeier CC, Bronson RT, Krivtsov AV, Myers AG, Kohl NE, Kung AL, Armstrong SA, Lemieux ME, Taatjes DJ, Shair MD. 2015. Mediator kinase inhibition further activates super-enhancer-associated genes in AML. Nature 526:273–276. doi:10.1038/nature14904. - DOI - PMC - PubMed

Publication types

MeSH terms