. 2017 May 9;8(19):31329-31346.
doi: 10.18632/oncotarget.15455.

Mitochondrial VDAC1-based peptides: Attacking oncogenic properties in glioblastoma

Affiliations

Mitochondrial VDAC1-based peptides: Attacking oncogenic properties in glioblastoma

Anna Shteinfer-Kuzmine et al. Oncotarget. .

Abstract

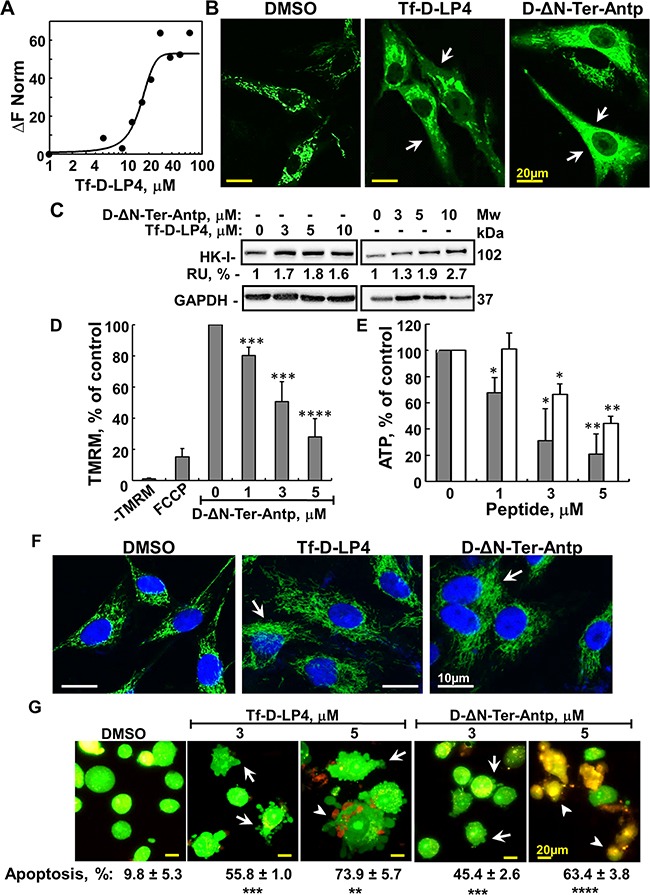
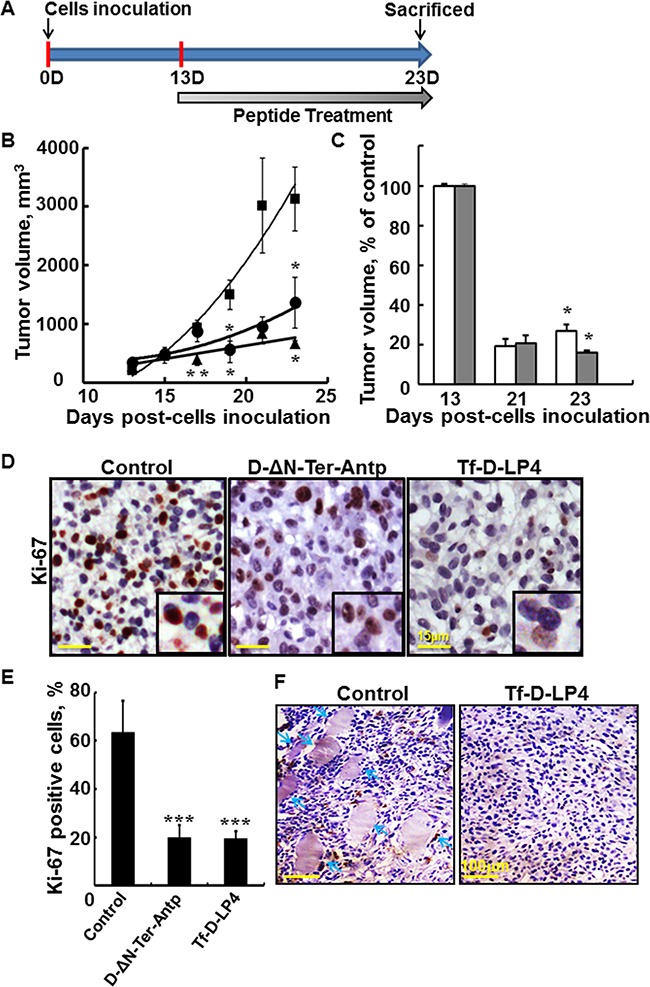
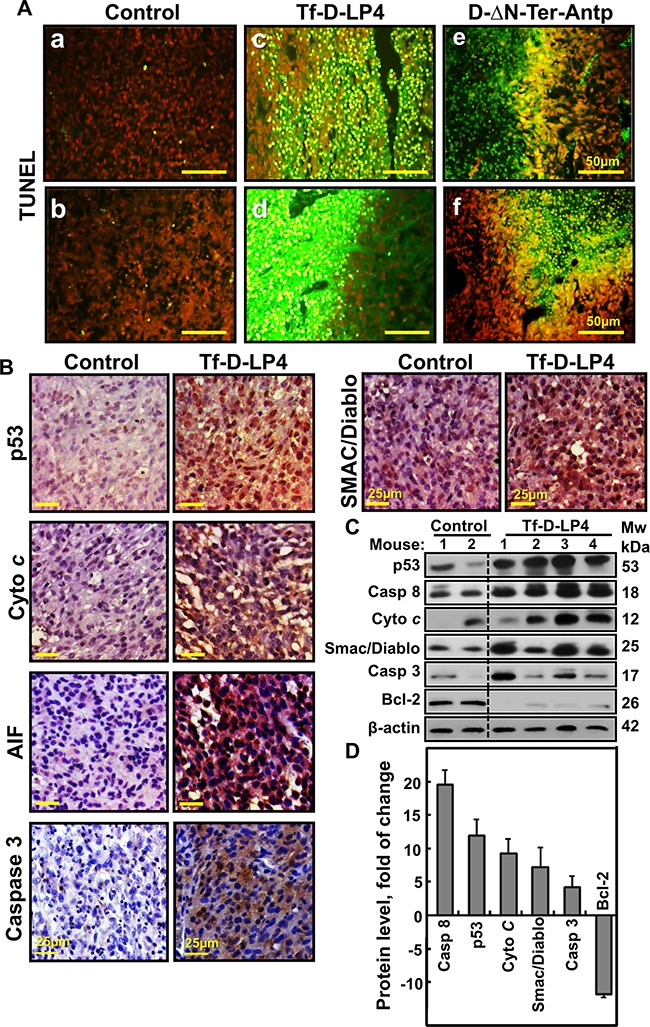
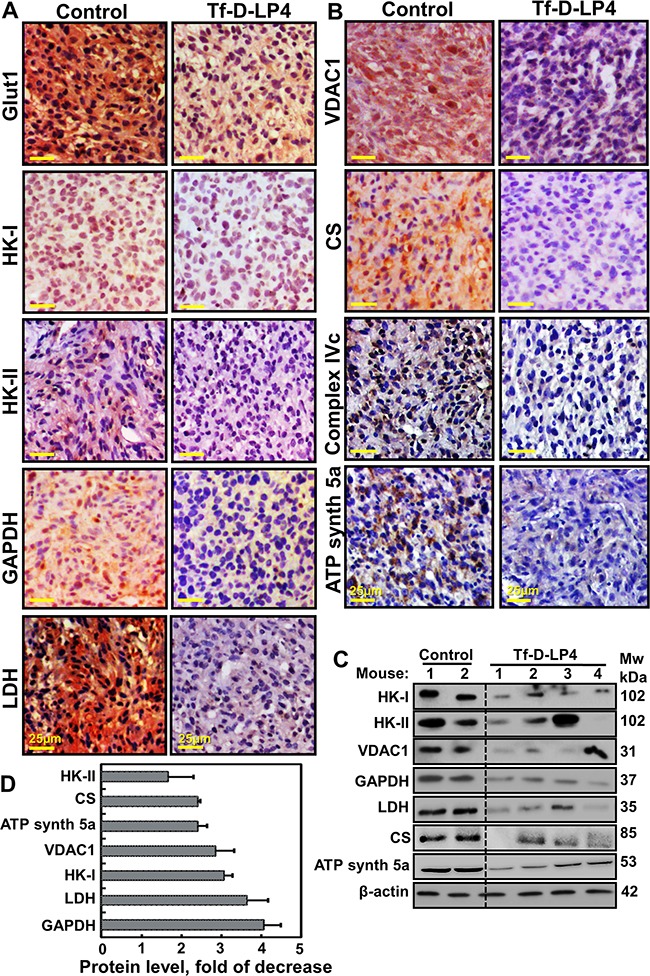
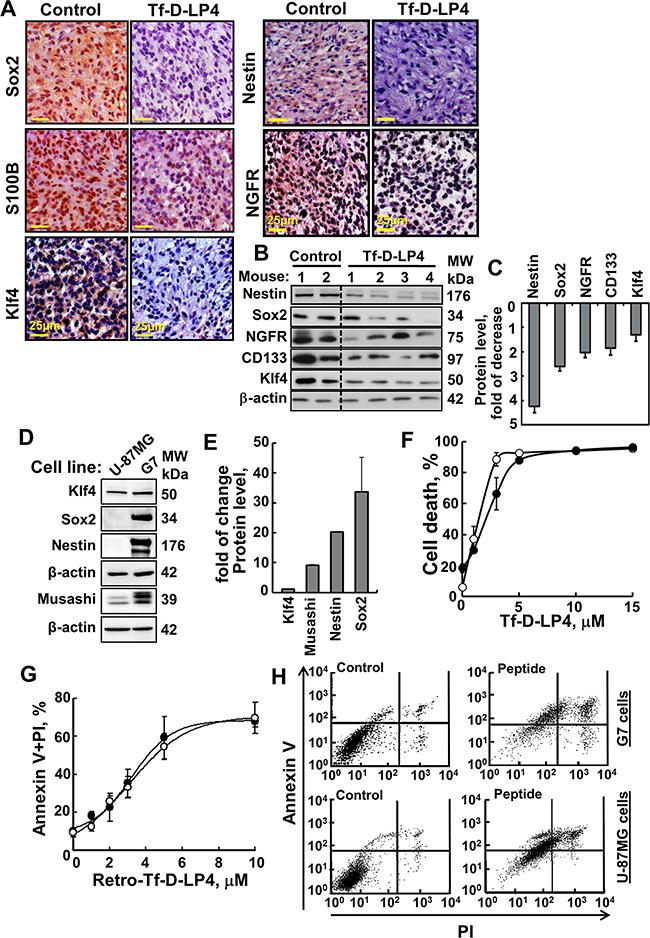
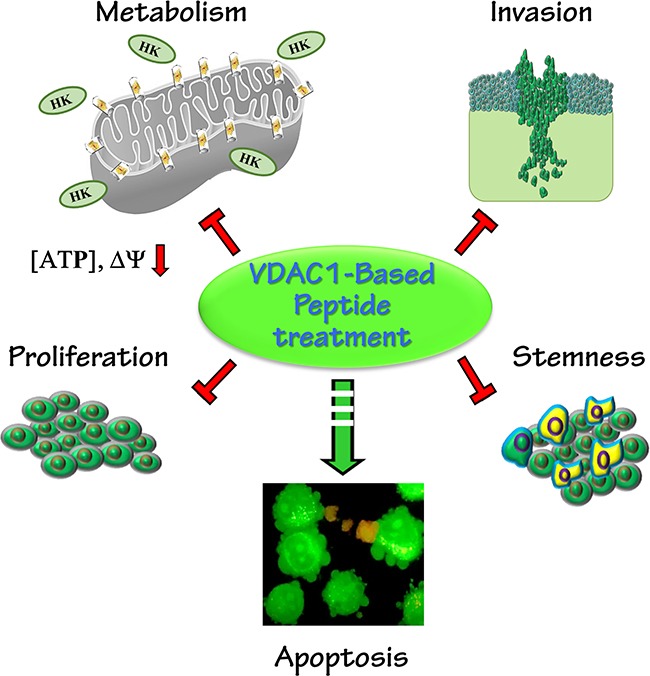
Glioblastoma multiforme (GBM), a primary brain malignancy characterized by high morbidity, invasiveness, proliferation, relapse and mortality, is resistant to chemo- and radiotherapies and lacks effective treatment. GBM tumors undergo metabolic reprograming and develop anti-apoptotic defenses. We targeted GBM with a peptide derived from the mitochondrial protein voltage-dependent anion channel 1 (VDAC1), a key component of cell energy, metabolism and apoptosis regulation. VDAC1-based cell-penetrating peptides perturbed cell energy and metabolic homeostasis and induced apoptosis in several GBM and GBM-derived stem cell lines. We found that the peptides simultaneously attacked several oncogenic properties of human U-87MG cells introduced into sub-cutaneous xenograft mouse model, inhibiting tumor growth, invasion, and cellular metabolism, stemness and inducing apoptosis. Peptide-treated tumors showed decreased expression of all tested metabolism-related enzymes and transporters, and elevated levels of apoptotic proteins, such as p53, cytochrome c and caspases. Retro-Tf-D-LP4, containing the human transferrin receptor (TfR)-recognition sequence, crossed the blood-brain barrier (BBB) via the TfR that is highly expressed in the BBB to strongly inhibit tumor growth in an intracranial xenograft mouse model. In summary, the VDAC1-based peptides tested here offer a potentially affordable and innovative new conceptual therapeutic paradigm that might overcome GBM stemness and invasiveness and reduce relapse rates.

Keywords: VDAC1; apoptosis; glioblastoma; mitochondria; peptides.


Conflict of interest statement

CONFLICTS OF INTEREST

The authors declare no competing financial interests.

Figures

Figure 1
Figure 1. VDAC1-based peptides induce dramatic cell death of several brain tumor-derived cell lines but to lesser extent in primary brain cells
A. IHC staining of VDAC1 of human normal brain (n=13) or glioblastoma (n=41) in tissue array slides (Biomax), as described in Materials and methods available online in Supplemental information. Percentages of sections stained at the intensity indicated are shown. B. Schematic illustration of D-ΔN-Ter-Antp (left) and Tf-D-LP4 (right) peptides. The VDAC1-derived sequences Δ(1-14)N-terminus and LP4 are in green and pink, respectively. The cell-penetrating peptides Antp and Tf are in orange and blue, respectively. The loop shape of LP4 stabilized by a tryptophan zipper is in purple. The amino acids of Δ(1-14)N-terminus, LP4 and Antp are in the D configuration. The sequences of D-LP4 and Retro-D-LP4 are presented below. C. Immunoblot analysis of VDAC1, HK-I, Bcl-2 and Transferrin receptor (TfR) expression in brain tumor-derived cell lines using specific antibodies, as described in Materials and methods available online in Supplemental information. D-G. D-ΔN-Ter-Antp, Tf-D-LP4 and Retro-Tf-D-LP4 peptides effectively induce cell death of human brain tumor-derived cell lines. Cells (U-251MG (D), U-118MG (E), U-87MG (F), LN-18 (G)) were incubated with the Tf-D-LP4 (○), D-ΔN-Ter-Antp (·) or Retro-Tf-D-LP4 (Δ) peptide in the appropriate serum-free growth medium for 6 h at 37°C. Cells were harvested, washed twice with PBS and cell death was analyzed by propidium iodide (PI) staining and flow cytometry. H. IC50 values (μM) for pepdide inducing cell death as derived from D-G. The results shown correspond to means ± SD (n=3). I-K. Retro-Tf-D-LP4, Tf-D-LP4 and D-ΔN-Ter-Antp peptides induced cell death to a lesser extent in primary brain cells (PBCs), as compared to U-87MG cells. U-87MG cells (grey bars) and primary brain cells (white bars) were incubated with the indicated concentrations of Retro-Tf-D-LP4 (I), Tf-D-LP4 (J) or D-ΔN-Ter-Antp (K) peptide in the appropriate serum-free growth medium for 6 h at 37°C. Cells were harvested, washed twice with PBS and cell death was analyzed by PI staining and flow cytometry. L. Immunoblot analysis of VDAC1 and HK-I expression levels in U-87MG cells and PBCs using specific antibodies was carried out as described in the Materials and Methods section available online in Supplemental Information. The levels of VDAC1 and HK-I in PBCs are presented relative to levels in U-87MG cells and relative to β-actin levels.
Figure 2
Figure 2. Mode of action of VDAC1-based peptides – interacting with- and detaching HK, releasing Cyto c, decreasing ATP level and inducing apoptosis
A. Purified HK-II was fluorescently labeled using the NanoTemper protein-labeling Kit BLUE. HK-II (100 nM) was incubated with Tf-D-LP4 (1- 100 μM for 20 min). Then, 3-5 μl of the samples were loaded into MST-grade glass capillaries and thermophoresis was measured using a Monolith-NT115 apparatus, as described in Materials and methods available online in Supplemental information. A Kd of 16 μM was determined for HK-II. B. Tf-D-LP4 and D-ΔN-Ter-Antp induce HK-I-GFP detachment. U-87MG cells (1×10⁵/ml) were transfected with pEGFP-HK-I and after 24 h, incubated with Tf-D-LP4 or with D-ΔN-Ter-Antp (7μM) for 3 h in serum-free medium. The final DMSO concentration in control and peptide-treated cells was 0.07%. Fixed cells were visualized using confocal microscopy (Olympus 1×81), as described in Materials and Methods available online in Supplemental information. Arrows indicate cells with diffusion of HK-I-GFP. C. For HK detachment, U-87MG cells were incubated with or without the indicated concentration of Tf-D-LP4 and D-ΔN-Ter-Antp for 3 h, treated with digitonin (0.02%) and HK in the cytosolic fraction was analyzed by immunoblotting, as described in Materials and Methods available online in Supplemental information. Anti-GAPDH antibodies were used to verify the cytosolic extracts. The levels of HK in the supernatants were quantified and are presented as relative units. D. D-ΔN-Ter-Antp induces mitochondrial inner membrane depolarization analyzed as described in Materials and Methods available online in Supplemental information. U-87MG cells were incubated for 3 h with the indicated concentrations of D-ΔN-Ter-Antp or with FCCP (1 h, 25 μM). Cells then were analyzed for Δψ using TMRM. Δψ is presented as percentage of control. Results = mean ± SE (n=3) (*** p≤0.001, ****p ≤0.0001). E. D-ΔN-Ter-Antp (grey bars) and Tf-D-LP4 (white bars) reduce cellular ATP levels assayed as described in Materials and Methods available online in Supplemental information. Cellular ATP levels are presented as percentage of control. Results = mean ± SE (n=2 or 3) (* p≤0.05, ** p≤0.01). F. Tf-D-LP4 and D-ΔN-Ter-Antp induce Cyto c release. U-87MG cells were incubated with Tf-D-LP4 or with D-ΔN-Ter-Antp (10 μM) for 3 h in serum-free medium. Release of Cyto c from the mitochondria was analyzed by immunostaining using anti-Cyto c antibodies and confocal microscopy (Olympus 1×81) as described in Materials and Methods available online in Supplemental information. Arrows indicate cells showing diffusion of Cyto c. G. Tf-D-LP4 and D-ΔN-Ter-Antp induce apoptotic cell death. U-87MG cells were treated with the indicated concentrations of Tf-D-LP4 and D-ΔN-Ter-Antp for 3 h and then stained with acridine orange and ethidium bromide (100μg/ml). Arrows and arrowheads indicate cells with membrane blebbing (early apoptotic state) and late apoptotic states, respectively. Quantification of apoptosis in control and peptide's treated cells are presented bellow the images. Results = mean ± SE (n=3) (** p≤0.01, *** p≤0.001, **** p≤0.0001).
Figure 3
Figure 3. VDAC1-based peptides inhibit tumor growth, cell proliferation, and invasion in a glioblastoma xenograft mice model
A. Graphical representation of the xenograft experiment protocol used. U-87MG cells (3×10⁶/mouse) were inoculated into male nude mice as described in Materials and Methods available online in Supplemental information. B, C. Tf-D-LP4 and D-ΔN-Ter-Antp inhibit tumor growth. B. On day 13, when tumor volume was 100-130 mm3, mice were sub-divided into 3 matched groups (5 mice per group), and injected every two days with DMSO (■, control, 0.26%), D-ΔN-Ter-Antp, (·, 20 μM) or Tf-D-LP4 (▲, 20 μM). The calculated average tumor volumes are presented as means ± SE (n=5) (* p≤0.05, ** p≤0.01). C. The volume of peptide-treated tumors is presented as % of control for each indicated time. Results = mean ± SE (n=5) (* p≤0.05, ** p≤0.001). D. Tf-D-LP4 and D-ΔN-Ter-Antp peptides decrease cell proliferation. Representative sections from PBS/DMSO, Tf-D-LP4 and D-ΔN-Ter-Antp peptide-TTs were immunostained for Ki-67, hematoxylin-stained and visualized by light microscopy. E. Quantitative analysis of Ki-67 positive cells. Results = mean ± SE (n=5) (*** p<0.001). F. H&E staining of control and peptide-treated U-87MG tumors showing representative sections with arrows pointing to muscle, indicative of tumor invasion.
Figure 4
Figure 4. Tumor treatment with VDAC1-based peptide induced apoptosis and modified the expression of apoptosis-related proteins
A. TUNEL staining on paraffin-embedded sections cut from (a, b) PBS/DMSO-, and (c, d) Tf-D-LP4 or (e, f) D-ΔN-Ter-Antp peptide-TTs from dissected mouse xenografts. Red color indicates PI nuclear staining and green color TUNEL staining. B. Representative sections from PBS/DMSO- and peptide-TTs IHC stained for p53, Cyto c, AIF, Caspase 3 and Smac/Diablo and then hematoxylin-stained and visualized by microscopy. C. Tissue lysates obtained from controls and several Tf-D-LP4-TTs were immunoblotted for p53, Caspase 8, Cyto c, Smac/Diablo, Caspase 3 and Bcl-2. D. Quantitative analysis of immunoblots is shown (n=2-4).
Figure 5
Figure 5. VDAC1-based peptide-treated tumors show marked changes in the expression of energy- and metabolism-related enzymes
Dissected tumors were subjected to immunohistochemistry as described in Experimental Procedures. A, B. Representative sections from PBS/DMSO- and Tf-D-LP4-TTs were IHC stained for Glut-1, HK-I, HK-II, GAPDH, LDH, VDAC1, CS, Complex IVc and ATP synthase 5a are presented. Sections were also hematoxylin-stained and visualized by microscopy. C. Tissue lysates obtained from controls and several Tf-D-LP4-TTs were immunoblotted for HK-I, HK-II, VDAC1, GAPDH, LDH, CS, and ATP synthase 5a. D. Quantitative analysis of immunoblots is shown (n=2-4).
Figure 6
Figure 6. VDAC1-based peptide treatment modifies the expression of GSCs and effectively induces cell death of stem cells cell line G7
A. Representative sections from PBS/DMSO- and Tf-D-LP4-TTs subjected to IHC staining of Sox2, S100B, Klf4, Nestin and NGFR as described in Experimental Procedures are presented. Sections were also hematoxylin-stained and visualized by microscopy. B. Tissue lysates obtained from controls and several TF-D-LP4-TTs were immunoblotted for Nestin, Sox2, NGFR, CD133, and Klf4. C. Quantitative analysis of immunoblots is shown (n=2-4). D. Immunoblot analysis of, Klf4, Sox2, Nestin and Musashi expression in U-87MG and G7 cell lines, using specific antibodies. E. Quantitative analysis of immunoblots. F. Tf-D-LP4 peptide effectively induces cell death of G7 stem cells. G7 (·) and U-87MG cells (○) (2×10⁵/ml) were incubated for 6 h with DMSO (0.15%) or Tf-D-LP4 peptide in serum-free growth medium at 37°C and then analyzed for cell death using PI staining and flow cytometry. G-H. Retro-Tf-D-LP4 peptide induces apoptosis of U-87MG and the stem cell G7 cell line. G. G7 (·) and U-87MG cells (○) (2×10⁵) were incubated for 3 h with the DMSO (0.15%) or with the indicated concentration of Retro-Tf-D-LP4 peptide in serum-free growth medium at 37°C and then subjected to FITC-Annexin V/PI staining and flow cytometry analysis. H. Representative FACS analysis of DMSO- (left) and 5 μM of Retro-Tf-D-LP4- (right) treated G7 or U-87MG cells.
Figure 7
Figure 7. Free- and PLGA-encapsulated peptide induces cell death in U-87MG cells and reduces tumor volume in a U-87MG intracranial glioblastoma mouse model
A. Structure of PLGA and its degradation products, glycolic acid and lactic acid. B. U-87MG cells (2×10⁵) were incubated for 12 h with the indicated concentrations of DMSO, Retro-Tf-D-LP4 peptide (Pep), or Retro-Tf-D-LP4 encapsulated in PLGA nanoparticles (PLGA-Pep). Samples of Retro-Tf-D-LP4 encapsulated in PLGA nanoparticles were centrifuged (15000g, 5 min) to separate the supernatant (Sup), containing free peptide, and the pellet, containing encapsulated Retro-Tf-D-LP4 peptide. Cell death was analyzed by PI staining and FACS analysis. C. Graphical representation of the orthotopic animal experiment. D. MRI imaging of brains 29 days post-intravenal treatment start with DMSO (1.05%), Retro-Tf-D-LP4 (10 mg/kg) encapsulated in PLGA nanoparticles or Tf-D-Retro-LP4 peptide (10 mg/Kg), as described in Materials and Methods available online in Supplemental information. E. Calculated tumor volumes after 20 (dark grey bars) and 29 (light grey bars) days post-treatment start. Results = mean ± SE (n = 6) (* p<0.05, *** p<0.001). F. Kaplan-Meier survival curves showing statistically significant differences in survival curves between the PBS/DMSO and Retro-Tf-D-LP4 treated mice. Cumulative Kaplan-Meier survival curves of control mice (red line), Retro-Tf-D-LP4 peptide (10mg/kg) encapsulated in PGLA nanoparticles (black line, ** p=0.006) or Retro-Tf-D-LP4 peptide (10 mg/kg, pink line, *** p=0.0003). The arrow indicates the end of the peptide treatment (day 46).
Figure 8
Figure 8. A schematic presentation of a VDAC1-based peptide inducing reversal of a tumor's oncogenic properties
Tumor treatment with VDAC1-based peptides resulted in attacks on hallmarks of cancer and reversal of oncogenic properties. These included mitochondrial dysfunction, decreased energy and metabolite generation, arrested cell proliferation, induction of apoptosis, and inhibition of invasion and stemness.

Similar articles

Cited by

References

    1. Louis DN, Ohgaki H, Wiestler OD, Cavenee WK, Burger PC, Jouvet A, Scheithauer BW, Kleihues P. The 2007 WHO classification of tumours of the central nervous system. Acta Neuropathol. 2007;114:97–109. - PMC - PubMed
    1. Meacham CE, Morrison SJ. Tumour heterogeneity and cancer cell plasticity. Nature. 2013;501:328–337. - PMC - PubMed
    1. Singh SK, Hawkins C, Clarke ID, Squire JA, Bayani J, Hide T, Henkelman RM, Cusimano MD, Dirks PB. Identification of human brain tumour initiating cells. Nature. 2004;432:396–401. - PubMed
    1. Gilbert MR, Dignam JJ, Armstrong TS, Wefel JS, Blumenthal DT, Vogelbaum MA, Colman H, Chakravarti A, Pugh S, Won M, Jeraj R, Brown PD, Jaeckle KA, et al. A randomized trial of bevacizumab for newly diagnosed glioblastoma. N Engl J Med. 2014;370:699–708. - PMC - PubMed
    1. Hanahan D, Weinberg RA. Hallmarks of cancer: the next generation. Cell. 2011;144:646–674. - PubMed

MeSH terms