Inferring modulators of genetic interactions with epistatic nested effects models
- PMID: 28406896
- PMCID: PMC5407847
- DOI: 10.1371/journal.pcbi.1005496
Inferring modulators of genetic interactions with epistatic nested effects models
Abstract
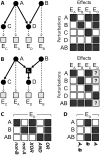
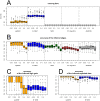
Maps of genetic interactions can dissect functional redundancies in cellular networks. Gene expression profiles as high-dimensional molecular readouts of combinatorial perturbations provide a detailed view of genetic interactions, but can be hard to interpret if different gene sets respond in different ways (called mixed epistasis). Here we test the hypothesis that mixed epistasis between a gene pair can be explained by the action of a third gene that modulates the interaction. We have extended the framework of Nested Effects Models (NEMs), a type of graphical model specifically tailored to analyze high-dimensional gene perturbation data, to incorporate logical functions that describe interactions between regulators on downstream genes and proteins. We benchmark our approach in the controlled setting of a simulation study and show high accuracy in inferring the correct model. In an application to data from deletion mutants of kinases and phosphatases in S. cerevisiae we show that epistatic NEMs can point to modulators of genetic interactions. Our approach is implemented in the R-package 'epiNEM' available from https://github.com/cbg-ethz/epiNEM and https://bioconductor.org/packages/epiNEM/.
Conflict of interest statement
The authors have declared that no competing interests exist.
Figures


Similar articles
-
Prevalent positive epistasis in Escherichia coli and Saccharomyces cerevisiae metabolic networks.Nat Genet. 2010 Mar;42(3):272-6. doi: 10.1038/ng.524. Epub 2010 Jan 24. Nat Genet. 2010. PMID: 20101242 Free PMC article.
-
Modular epistasis and the compensatory evolution of gene deletion mutants.PLoS Genet. 2019 Feb 15;15(2):e1007958. doi: 10.1371/journal.pgen.1007958. eCollection 2019 Feb. PLoS Genet. 2019. PMID: 30768593 Free PMC article.
-
Identification of response-modulated genetic interactions by sensitivity-based epistatic analysis.BMC Genomics. 2010 Sep 10;11:493. doi: 10.1186/1471-2164-11-493. BMC Genomics. 2010. PMID: 20831804 Free PMC article.
-
A systems-biology approach to modular genetic complexity.Chaos. 2010 Jun;20(2):026102. doi: 10.1063/1.3455183. Chaos. 2010. PMID: 20590331 Free PMC article. Review.
-
Systems-level approaches for identifying and analyzing genetic interaction networks in Escherichia coli and extensions to other prokaryotes.Mol Biosyst. 2009 Dec;5(12):1439-55. doi: 10.1039/B907407d. Epub 2009 Jul 31. Mol Biosyst. 2009. PMID: 19763343 Review.
Cited by
-
Extending the lymphoblastoid cell line model for drug combination pharmacogenomics.Pharmacogenomics. 2021 Jun;22(9):543-551. doi: 10.2217/pgs-2020-0160. Epub 2021 May 28. Pharmacogenomics. 2021. PMID: 34044623 Free PMC article. Review.
-
The ability of transcription factors to differentially regulate gene expression is a crucial component of the mechanism underlying inversion, a frequently observed genetic interaction pattern.PLoS Comput Biol. 2019 May 13;15(5):e1007061. doi: 10.1371/journal.pcbi.1007061. eCollection 2019 May. PLoS Comput Biol. 2019. PMID: 31083661 Free PMC article.
-
Hierarchy of TGFβ/SMAD, Hippo/YAP/TAZ, and Wnt/β-catenin signaling in melanoma phenotype switching.Life Sci Alliance. 2021 Nov 24;5(2):e202101010. doi: 10.26508/lsa.202101010. Print 2022 Feb. Life Sci Alliance. 2021. PMID: 34819356 Free PMC article.
-
Single cell network analysis with a mixture of Nested Effects Models.Bioinformatics. 2018 Sep 1;34(17):i964-i971. doi: 10.1093/bioinformatics/bty602. Bioinformatics. 2018. PMID: 30423100 Free PMC article.
-
Bioinformatics challenges and perspectives when studying the effect of epigenetic modifications on alternative splicing.Philos Trans R Soc Lond B Biol Sci. 2018 Jun 5;373(1748):20170073. doi: 10.1098/rstb.2017.0073. Philos Trans R Soc Lond B Biol Sci. 2018. PMID: 29685977 Free PMC article. Review.
References
-
- Beerenwinkel N, Pachter L, Sturmfels B. Epistasis and Shapes of Fitness Landscapes. Statistica Sinica. 2007;17:1317–1342. Available from: http://www3.stat.sinica.edu.tw/statistica/oldpdf/A17n43.pdf.
MeSH terms
Grants and funding
LinkOut - more resources
Full Text Sources
Other Literature Sources
Molecular Biology Databases
Research Materials
Miscellaneous

