. 2017 Apr 6;2(7):e90777.
doi: 10.1172/jci.insight.90777.

Inhibition of neuronal ferroptosis protects hemorrhagic brain

Affiliations

Inhibition of neuronal ferroptosis protects hemorrhagic brain

Qian Li et al. JCI Insight. .

Abstract

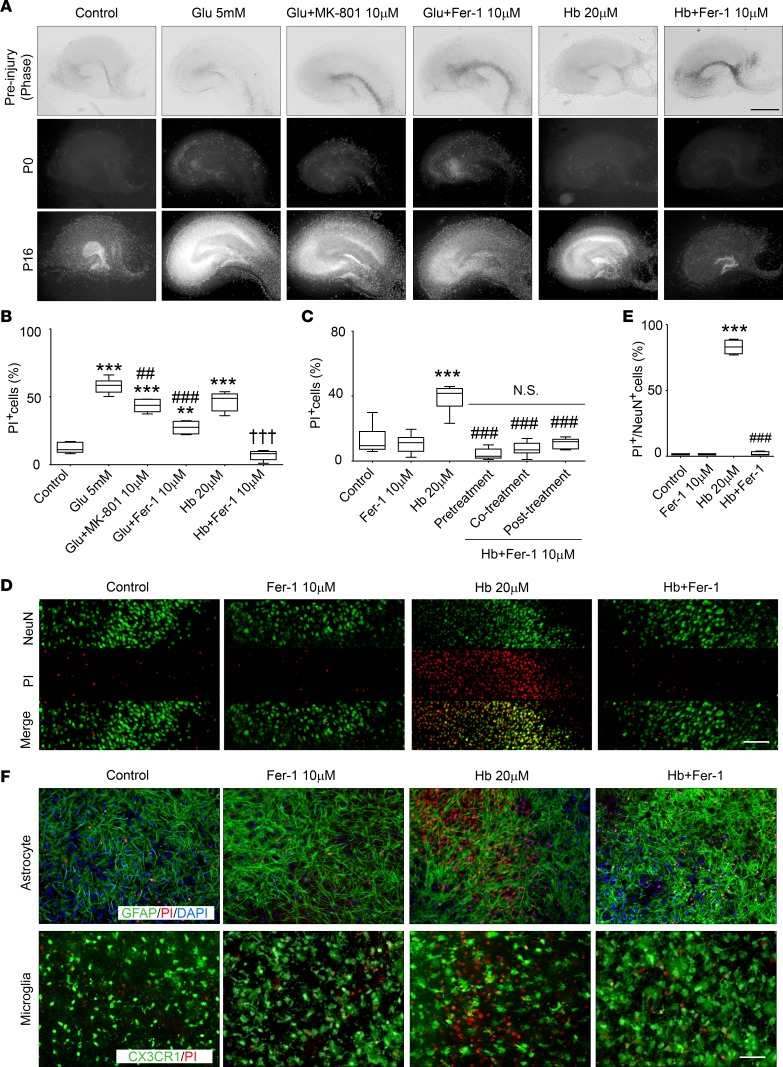
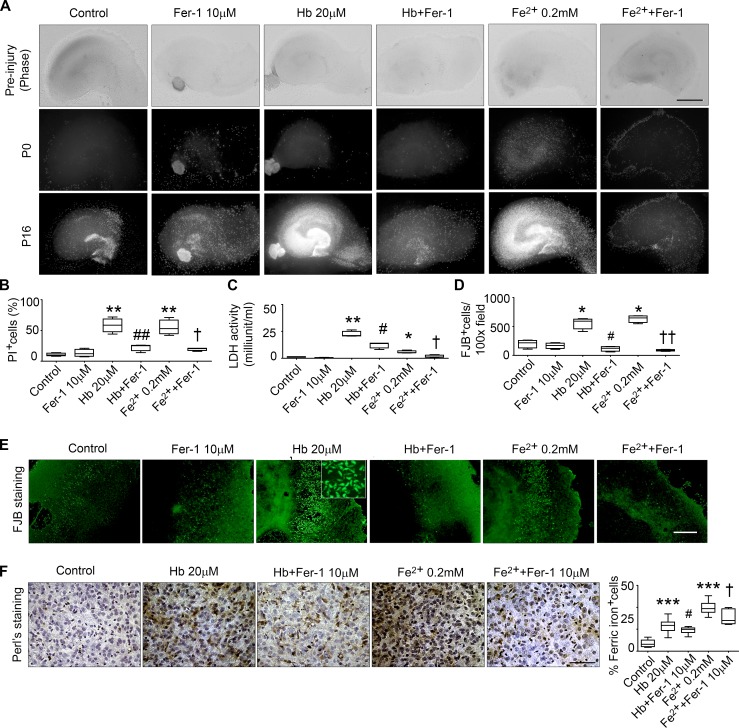
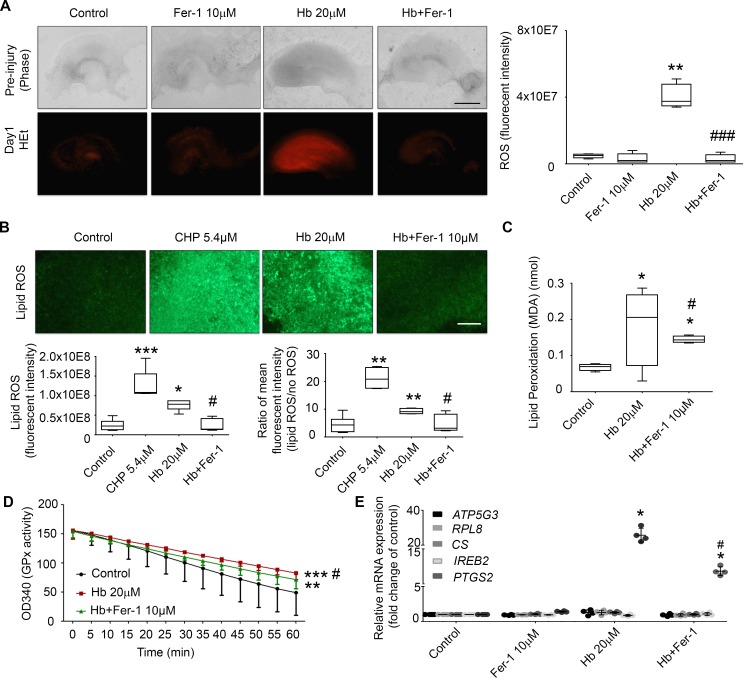
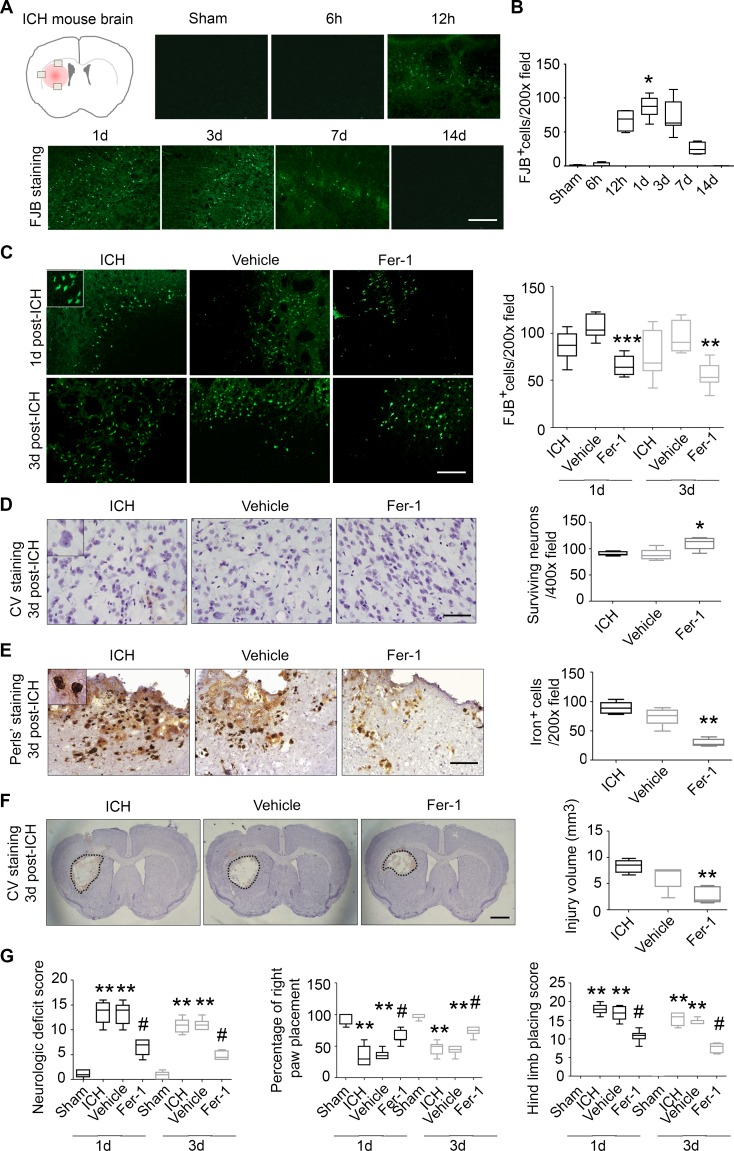
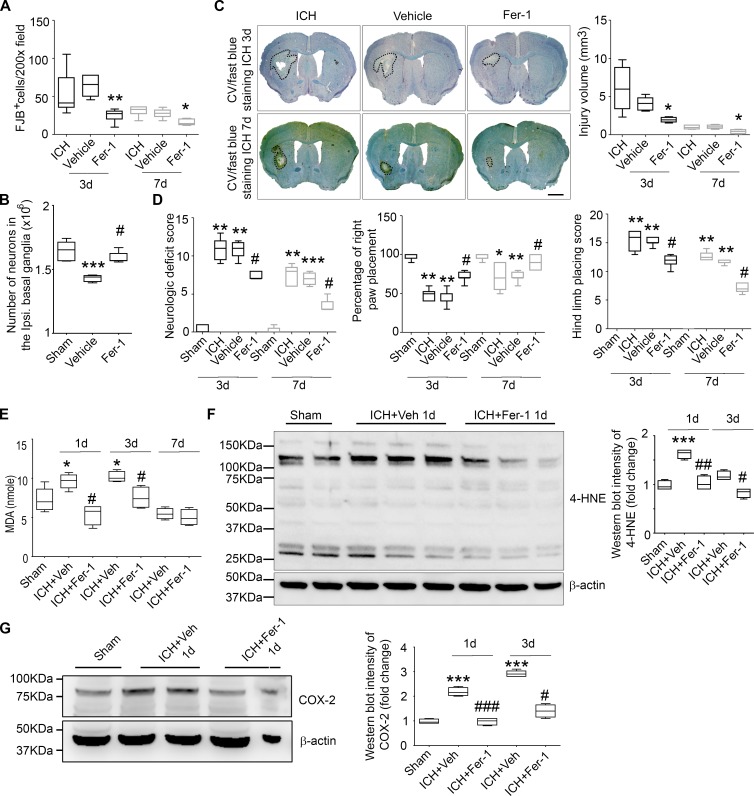
Intracerebral hemorrhage (ICH) causes high mortality and morbidity, but our knowledge of post-ICH neuronal death and related mechanisms is limited. In this study, we first demonstrated that ferroptosis, a newly identified form of cell death, occurs in the collagenase-induced ICH model in mice. We found that administration of ferrostatin-1, a specific inhibitor of ferroptosis, prevented neuronal death and reduced iron deposition induced by hemoglobin in organotypic hippocampal slice cultures (OHSCs). Mice treated with ferrostatin-1 after ICH exhibited marked brain protection and improved neurologic function. Additionally, we found that ferrostatin-1 reduced lipid reactive oxygen species production and attenuated the increased expression level of PTGS2 and its gene product cyclooxygenase-2 ex vivo and in vivo. Moreover, ferrostatin-1 in combination with other inhibitors that target different forms of cell death prevented hemoglobin-induced cell death in OHSCs and human induced pluripotent stem cell-derived neurons better than any inhibitor alone. These results indicate that ferroptosis contributes to neuronal death after ICH, that administration of ferrostatin-1 protects hemorrhagic brain, and that cyclooxygenase-2 could be a biomarker of ferroptosis. The insights gained from this study will advance our knowledge of the post-ICH cell death cascade and be essential for future preclinical studies.


Conflict of interest statement

Conflict of interest: The authors have declared that no conflict of interest exists.

Figures

Figure 1
Figure 1. Fer-1 inhibits Hb-induced neuronal death in OHSCs.
(A and B) Organotypic hippocampal slice cultures (OHSCs) were treated under the conditions shown for 16 hours. The glutamate antagonist MK-801 or ferrostatin-1 (Fer-1) was added 30 minutes before glutamate (Glu) or hemoglobin (Hb). Slices were stained with propidium iodide (PI). Representative images (A) and percentage of PI+ cells (B) are shown. **P < 0.01, ***P < 0.001 versus control; ##P < 0.01, ###P < 0.001 versus Glu; †††P < 0.001 versus Hb. (C) OHSCs were treated as described in A. Fer-1 was added before (pretreatment), with (cotreatment), or after (posttreatment) Hb. PI+ cells were quantified. ***P < 0.001 versus control; ###P < 0.001 versus Hb; N.S., not significant. (D and E) OHSCs were treated as indicated, with coapplication of Fer-1 and Hb. Slices were stained with PI, fixed, and immunostained with NeuN antibodies. Representative images (D) and percentage of PI+/NeuN+ cells (E) are shown. ***P < 0.001 versus control; ###P < 0.001 versus Hb. (F) Slices (prepared from CX3CR1GFP/+ pups) were treated as described in D. Slices were fixed or further stained for glial fibrillary acidic protein (GFAP, prepared from C57BL/6 pups) after PI staining. Results are presented as box-and-whisker plots (the middle horizontal line within the box represents the median, boxes extend from the 25th to the 75th percentile, and the whiskers represent 95% confidence intervals). One-way ANOVA followed by Dunn’s multiple comparison post test was used. n = 8–14 slices. Results are from at least 3 independent experiments. Scale bars: 1 mm (A), 50 μm (D and F).
Figure 2
Figure 2. Fer-1 inhibits ferrous iron–induced neuronal death in OHSCs.
(AC) Organotypic hippocampal slice cultures (OHSCs) were treated with 10 μM ferrostatin-1 (Fer-1), 20 μM hemoglobin (Hb) plus vehicle, Hb with Fer-1 (cotreatment), 0.2 mM FeCl2 plus vehicle (Fe2+), FeCl2 with Fer-1 (cotreatment), or vehicle for 16 hours. Then they were stained with propidium iodide (PI) (A), and the percentage of PI+ cells was calculated (B). (C) Culture medium was collected and concentrated for use in the lactate dehydrogenase (LDH) assay. (D and E) OHSCs were treated as described in AC, fixed, and stained with Fluoro-Jade B (FJB). Quantification of FJB+ cells (D) and representative images from the CA1 region (E) are shown. (F) OHSCs were treated as described in A for 3 days. Slices were fixed and stained with Perls’ stain. Representative images and quantification of iron-positive cells are shown. *P < 0.05, **P < 0.01, ***P < 0.001 versus control; #P < 0.05, ##P < 0.01 versus Hb; †P < 0.05, ††P < 0.01 versus Fe2+. Results are presented as box-and-whisker plots (the middle horizontal line within the box represents the median, boxes extend from the 25th to the 75th percentile, and the whiskers represent 95% confidence intervals). One-way ANOVA followed by Dunn’s multiple comparison post test was used. Results are from at least 3 independent experiments. Scale bars: 1 mm (A), 0.5 mm (E), 50 μm (F).
Figure 3
Figure 3. Fer-1 reduces Hb-induced lipid ROS and ameliorates glutathione peroxidase (GPx) activity reduction in OHSCs.
Organotypic hippocampal slice cultures (OHSCs) were treated with 10 μM ferrostatin-1 (Fer-1) and 20 μM hemoglobin (Hb) alone or in combination for 16 hours. (A) ROS were measured by quantifying fluorescence intensity after incubation with hydroethidine (HEt). Representative images and quantification are shown. **P < 0.01 versus control; ###P < 0.001 versus Hb. (B) Lipid ROS were measured with BODIPY 581/591 C11 reagent, and images were taken under a fluorescence microscope. Slices were then lysed and fluorescence intensity measured on a microplate reader. Cumene hydroperoxide (CHP) treatment was used as a positive control. Representative images and quantification are shown. *P < 0.05, **P < 0.01, ***P < 0.001 versus control; #P < 0.05 versus Hb. (C) Lipid ROS were measured with a malondialdehyde (MDA) assay. *P < 0.05 versus control; #P < 0.05 versus Hb. (D) GPx activity was measured with a GPx assay kit. **P < 0.01, ***P < 0.001 versus control; #P < 0.05 versus Hb. (E) mRNA was extracted from the OHSCs, and reverse transcriptase real-time PCR was carried out with different primers. GAPDH was used as an internal control, and results are shown as fold change of control. *P < 0.05 versus control; #P < 0.05 versus Hb. Results are represented as box-and-whisker plots (AC; the middle horizontal line within the box represents the median, boxes extend from the 25th to the 75th percentile, and the whiskers represent 95% confidence intervals) or mean ± SD (D and E). Statistical tests used were 1-way ANOVA followed by Dunn’s multiple comparison post test (AC, and E) and repeated measurement followed by Tukey’s multiple comparison (D). Results are from at least 3 independent experiments. Scale bars: 1 mm (A), 100 μm (B).
Figure 4
Figure 4. In situ administration of Fer-1 reduces degenerating neurons and neurologic deficit in vivo.
(A and B) Male C57BL/6 mice (6–8 weeks old) underwent collagenase injection or sham procedure. Brain sections were stained with Fluoro-Jade B (FJB) at indicated times. (A) Field of interest and representative images of intracerebral hemorrhage (ICH) mouse brain. (B) Quantification of FJB+ cells. *P < 0.05 versus all other time points. Sham, 6 hours, 12 hours, 7 days, and 14 days: n = 8; 1 day: n = 10; 3 days: n = 12. (CG) Mice were injected with collagenase followed by ferrostatin-1 (Fer-1) or vehicle in situ. Brains were collected and frozen sectioned at 1 and 3 days. (C) Sections were stained with FJB, and quantification is shown. **P < 0.01, ***P < 0.001 versus vehicle at the same time point. (D) Cresyl violet (CV) was used to stain surviving neurons at day 3. Representative images and quantification are shown. *P < 0.05 versus vehicle. (E) Perls’ staining and quantification of iron-positive cells. **P < 0.01 versus vehicle. (F) Brain sections were stained with CV and lesion volume calculated. **P < 0.01 versus vehicle. (G) Neurologic deficit score, right front paw placement, and hind limb placing scores. **P < 0.01 versus sham at the same time point; #P < 0.05 versus vehicle at the same time point. Results are shown as box-and-whisker plots (the middle horizontal line within the box represents the median, boxes extend from the 25th to the 75th percentile, and the whiskers represent 95% confidence intervals). One-way ANOVA followed by Dunn’s multiple comparison post test was used. For CG, sham and vehicle: n = 8; ICH and Fer-1: n = 10. Scale bars: 50 μm (A and D), 100 μm (C and E), 1 mm (F). Original magnification of insets: ×400 (C), ×600 (D and E).
Figure 5
Figure 5. Intracerebroventricular administration of Fer-1 reduces degenerating neurons, neurologic deficit, and lipid ROS and inhibits COX-2 expression in vivo.
Male C57BL/6 mice (6–8 weeks old) underwent collagenase injection or sham procedure. Ferrostatin-1 (Fer-1) or vehicle was injected through the left ventricle 2 hours after collagenase. (A) Brain slices were stained with Fluoro-Jade B (FJB), and quantification is shown. *P < 0.05, **P < 0.01 versus corresponding vehicle. (B) Brain slices were stained with Cresyl violet (CV), and stereological quantification of the surviving neurons in the ipsilateral striatum is shown. ***P < 0.001 versus sham; #P < 0.05 versus vehicle. (C) Lesion volume was calculated after CV/Luxol fast blue staining. *P < 0.05 versus corresponding vehicle. Scale bar: 1 mm. (D) Neurologic deficit score, right front paw placement, and hind limb placing scores. *P < 0.05, **P < 0.01, ***P < 0.001 versus corresponding sham; #P < 0.05 versus corresponding vehicle. (EG) Four-millimeter tissue slices were collected from the hematoma core and perihematoma region of intracerebral hemorrhage (ICH) and sham animals. Tissue was homogenized for the malondialdehyde (MDA) assay (E) and Western blotting (F and G). β-Actin served as a loading control. Protein expression was normalized to β-actin and expressed as fold change of sham. *P < 0.05, ***P < 0.001 versus sham; #P < 0.05, ##P < 0.01, ###P < 0.001 versus corresponding vehicle. Results are shown as box-and-whisker plots (the middle horizontal line within the box represents the median, boxes extend from the 25th to the 75th percentile, and the whiskers represent 95% confidence intervals). Statistical tests used were 1-way ANOVA followed by Dunn’s multiple comparison post test (AD) and 1-way ANOVA followed by Bonferroni post hoc analysis (DF). For AD, sham and vehicle: n = 8; ICH and Fer-1: n = 10. For EG, sham, vehicle, and Fer-1: n = 5.
Figure 6
Figure 6. Inhibiting multiple forms of cell death optimizes neuronal rescue in vitro.
(AC) Male C57BL/6 mice (6–8 weeks old) underwent collagenase injection or sham procedure. Brain slices were stained with 2% uranyl acetate and lead citrate. (A) Ultrastructure of neuron somas and axons. n, nuclei; c, cytoplasm; m, mitochondria. Red arrows show representative mitochondria in somas and axons. ICH, intracerebral hemorrhage. (B) Mitochondrial area frequency in somas and axons. Arrows indicate increased frequency of shrunken mitochondria in ICH groups. (C) Ultrastructure of (a) a healthy neuronal soma and (b) normal axon in sham group; (c) arrows indicate chromatin condensation in 2 cells undergoing apoptosis; (d, g) double arrows indicate organelle swelling in a cell undergoing necrosis with classical nuclear membrane rupture; (e, f) arrowhead indicates formation of double-membrane vesicles in a cell undergoing autophagy. n = 3 per time point. Number of soma mitochondria, sham: n = 272; ICH 3 days: n = 414; ICH 6 days: n = 312. Number of axon mitochondria, sham: n = 152; ICH 3 days: n = 306; ICH 6 days: n = 296. (D and E) Organotypic hippocampal slice cultures were treated as indicated for 16 hours (D) or 48 hours (E) before cell death was measured by propidium iodide (PI) staining. **P < 0.01, ***P < 0.001 versus control; #P < 0.05, ##P < 0.01, ###P < 0.001 versus hemoglobin (Hb). (FH) Human induced pluripotent stem cell–derived neurons were treated as indicated for 16 hours before cell viability/death was measured with the MTT assay (F) or PI staining (H). MAP2 staining shows the morphology of Hb-injured neurons (G). *P < 0.05, **P < 0.01, ***P < 0.001 versus control; #P < 0.05, ##P < 0.01, ###P < 0.001 versus Hb. Results are shown as bar graphs or box-and-whisker plots (the middle horizontal line within the box represents the median, boxes extend from the 25th to the 75th percentile, and the whiskers represent 95% confidence intervals). n = 3 independent experiments; 1-way ANOVA with Bonferroni post hoc analysis. Scale bars: (A) upper panel, 2 μm and bottom panel, 500 nm; (C) 2 μm; (G) left panel, 100 μm and right panel, 50 μm. Original magnification for insets (A and G), ×600.

Similar articles

Cited by

References

    1. Donnan GA, Hankey GJ, Davis SM. Intracerebral haemorrhage: a need for more data and new research directions. Lancet Neurol. 2010;9(2):133–134. doi: 10.1016/S1474-4422(10)70001-6. - DOI - PubMed
    1. Wang J. Preclinical and clinical research on inflammation after intracerebral hemorrhage. Prog Neurobiol. 2010;92(4):463–477. doi: 10.1016/j.pneurobio.2010.08.001. - DOI - PMC - PubMed
    1. Wang J, Dore S. Inflammation after intracerebral hemorrhage. J Cereb Blood Flow Metab. 2007;27(5):894–908. doi: 10.1038/sj.jcbfm.9600403. - DOI - PubMed
    1. Wasserman JK, Schlichter LC. Neuron death and inflammation in a rat model of intracerebral hemorrhage: effects of delayed minocycline treatment. Brain Res. 2007;1136(1):208–218. - PubMed
    1. Xi G, Keep RF, Hoff JT. Mechanisms of brain injury after intracerebral haemorrhage. Lancet Neurol. 2006;5(1):53–63. doi: 10.1016/S1474-4422(05)70283-0. - DOI - PubMed

Publication types

MeSH terms