Bone Marrow Adipose Tissue Deficiency Increases Disuse-Induced Bone Loss in Male Mice
- PMID: 28402337
- PMCID: PMC5389344
- DOI: 10.1038/srep46325
Bone Marrow Adipose Tissue Deficiency Increases Disuse-Induced Bone Loss in Male Mice
Abstract
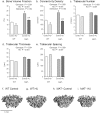
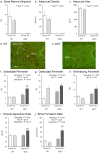
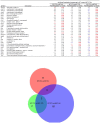
Bone marrow adipose tissue (MAT) is negatively associated with bone mass. Since osteoblasts and adipocytes are derived from the same precursor cells, adipocyte differentiation may occur at the expense of osteoblast differentiation. We used MAT-deficient KitW/W-v (MAT-) mice to determine if absence of MAT reduced bone loss in hindlimb-unloaded (HU) mice. Male MAT- and wild-type (WT) mice were randomly assigned to a baseline, control or HU group (n = 10 mice/group) within each genotype and HU groups unloaded for 2 weeks. Femurs were evaluated using micro-computed tomography, histomorphometry and targeted gene profiling. MAT- mice had a greater reduction in bone volume fraction after HU than did WT mice. HU MAT- mice had elevated cancellous bone formation and resorption compared to other treatment groups as well as a unique profile of differentially expressed genes. Adoptive transfer of WT bone marrow-derived hematopoietic stem cells reconstituted c-kit but not MAT in KitW/W-v mice. The MAT- WT → KitW/W-v mice lost cancellous bone following 2 weeks of HU. In summary, results from this study suggest that MAT deficiency was not protective, and was associated with exaggerated disuse-induced cancellous bone loss.
Conflict of interest statement
The authors declare no competing financial interests.
Figures


Similar articles
-
CCAAT/enhancer binding protein β-deficiency enhances type 1 diabetic bone phenotype by increasing marrow adiposity and bone resorption.Am J Physiol Regul Integr Comp Physiol. 2011 May;300(5):R1250-60. doi: 10.1152/ajpregu.00764.2010. Epub 2011 Feb 23. Am J Physiol Regul Integr Comp Physiol. 2011. PMID: 21346244 Free PMC article.
-
MURF1 deficiency suppresses unloading-induced effects on osteoblasts and osteoclasts to lead to bone loss.J Cell Biochem. 2011 Dec;112(12):3525-30. doi: 10.1002/jcb.23327. J Cell Biochem. 2011. PMID: 21866567
-
Hypothalamic Leptin Gene Therapy Reduces Bone Marrow Adiposity in ob/ob Mice Fed Regular and High-Fat Diets.Front Endocrinol (Lausanne). 2016 Aug 16;7:110. doi: 10.3389/fendo.2016.00110. eCollection 2016. Front Endocrinol (Lausanne). 2016. PMID: 27579023 Free PMC article.
-
The relationship between bone marrow adipose tissue and bone metabolism in postmenopausal osteoporosis.Cytokine Growth Factor Rev. 2020 Apr;52:88-98. doi: 10.1016/j.cytogfr.2020.02.003. Epub 2020 Feb 10. Cytokine Growth Factor Rev. 2020. PMID: 32081538 Review.
-
Metabolic Coupling Between Bone Marrow Adipose Tissue and Hematopoiesis.Curr Osteoporos Rep. 2018 Apr;16(2):95-104. doi: 10.1007/s11914-018-0422-3. Curr Osteoporos Rep. 2018. PMID: 29492879 Free PMC article. Review.
Cited by
-
Leptin and environmental temperature as determinants of bone marrow adiposity in female mice.Front Endocrinol (Lausanne). 2022 Oct 6;13:959743. doi: 10.3389/fendo.2022.959743. eCollection 2022. Front Endocrinol (Lausanne). 2022. PMID: 36277726 Free PMC article.
-
Voluntary Chronic Heavy Alcohol Consumption in Male Rhesus Macaques Suppresses Cancellous Bone Formation and Increases Bone Marrow Adiposity.Alcohol Clin Exp Res. 2019 Dec;43(12):2494-2503. doi: 10.1111/acer.14202. Epub 2019 Oct 17. Alcohol Clin Exp Res. 2019. PMID: 31557335 Free PMC article.
-
Brown adipose tissue but not tibia exhibits a dramatic response to acute reduction in environmental temperature in growing male mice.Bone Rep. 2023 Aug 8;19:101706. doi: 10.1016/j.bonr.2023.101706. eCollection 2023 Dec. Bone Rep. 2023. PMID: 37637756 Free PMC article.
-
MarrowQuant Across Aging and Aplasia: A Digital Pathology Workflow for Quantification of Bone Marrow Compartments in Histological Sections.Front Endocrinol (Lausanne). 2020 Sep 24;11:480. doi: 10.3389/fendo.2020.00480. eCollection 2020. Front Endocrinol (Lausanne). 2020. PMID: 33071956 Free PMC article.
-
Bone Marrow Adipose Tissue Is Not Required for Reconstitution of the Immune System Following Irradiation in Male Mice.Int J Mol Sci. 2024 Feb 6;25(4):1980. doi: 10.3390/ijms25041980. Int J Mol Sci. 2024. PMID: 38396660 Free PMC article.
References
-
- Sibonga J. et al.. Adaptation of the Skeletal System During Long-Duration Spaceflight. Clinical Reviews in Bone and Mineral Metabolism 5, 249–261 (2007).
-
- Smith S. M. et al.. Bone Metabolism and Renal Stone Risk During International Space Station Missions. Bone 81, 712–720 (2015). - PubMed
-
- Smith S. M. et al.. Benefits for Bone from Resistance Exercise and Nutrition in Long-Duration Spaceflight: Evidence from Biochemistry and Densitometry. J Bone Miner Res 27, 1896–1906 (2012). - PubMed
-
- Rodriguez J. P., Garat S., Gajardo H., Pino A. M. & Seitz G. Abnormal Osteogenesis in Osteoporotic Patients Is Reflected by Altered Mesenchymal Stem Cells Dynamics. J Cell Biochem 75, 414–423 (1999). - PubMed
Publication types
MeSH terms
LinkOut - more resources
Full Text Sources
Other Literature Sources

