

Hypoxia-enhanced adhesion of red blood cells in microscale flow
- PMID: 28387057
- PMCID: PMC5679205
- DOI: 10.1111/micc.12374
Hypoxia-enhanced adhesion of red blood cells in microscale flow
Abstract
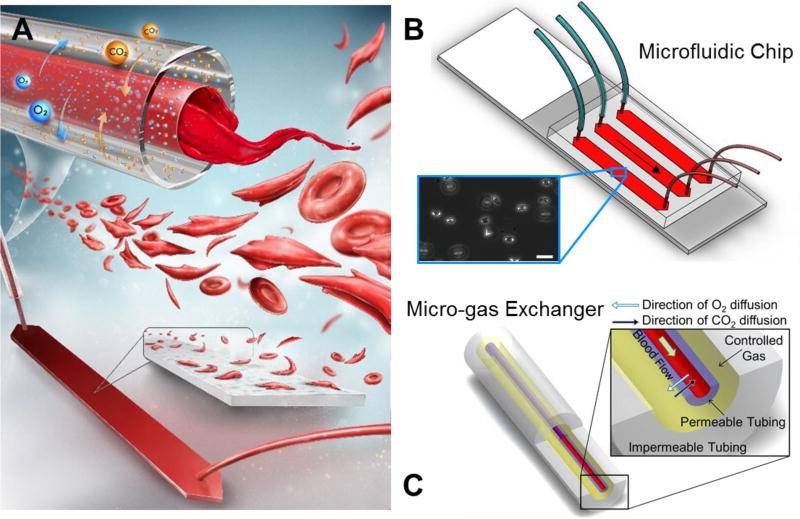
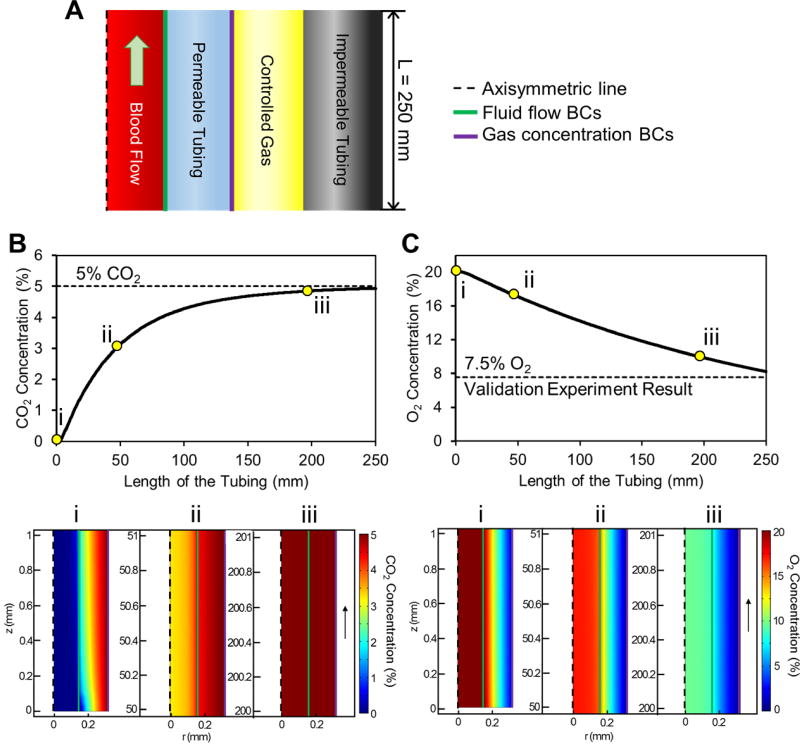
Objectives: The advancement of microfluidic technology has facilitated the simulation of physiological conditions of the microcirculation, such as oxygen tension, fluid flow, and shear stress in these devices. Here, we present a micro-gas exchanger integrated with microfluidics to study RBC adhesion under hypoxic flow conditions mimicking postcapillary venules.
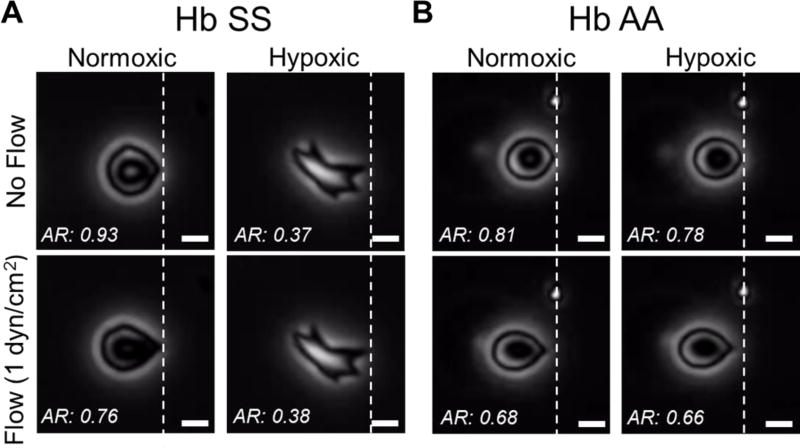
Methods: We simulated a range of physiological conditions and explored RBC adhesion to endothelial or subendothelial components (FN or LN). Blood samples were injected into microchannels at normoxic or hypoxic physiological flow conditions. Quantitative evaluation of RBC adhesion was performed on 35 subjects with homozygous SCD.
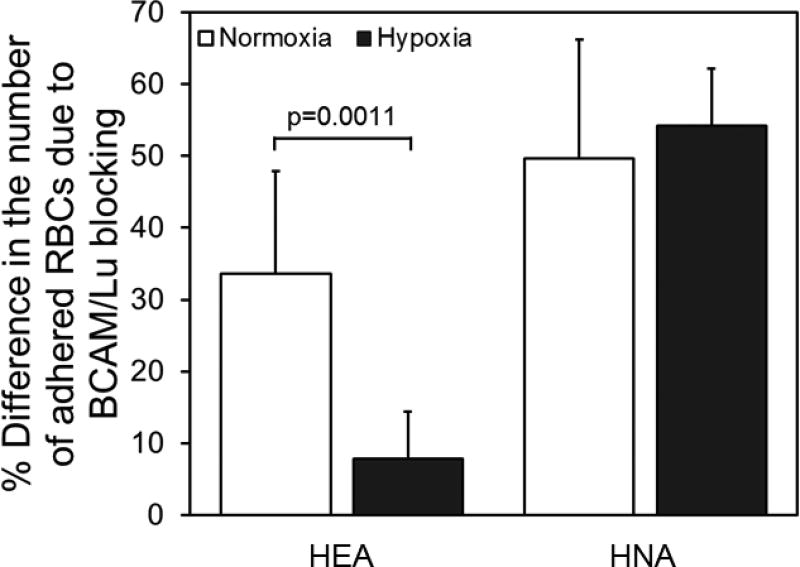
Results: Significant heterogeneity in RBC adherence response to hypoxia was seen among SCD patients. RBCs from a HEA population showed a significantly greater increase in adhesion compared to RBCs from a HNA population, for both FN and LN.
Conclusions: The approach presented here enabled the control of oxygen tension in blood during microscale flow and the quantification of RBC adhesion in a cost-efficient and patient-specific manner. We identified a unique patient population in which RBCs showed enhanced adhesion in hypoxia in vitro. Clinical correlates suggest a more severe clinical phenotype in this subgroup.
Keywords: erythrocyte; lab on a chip; laminin; microfluidics; oxygen; sickle cell disease.
© 2017 John Wiley & Sons Ltd.
Figures


Similar articles
-
Advances in Microfluidics for Single Red Blood Cell Analysis.Biosensors (Basel). 2023 Jan 9;13(1):117. doi: 10.3390/bios13010117. Biosensors (Basel). 2023. PMID: 36671952 Free PMC article. Review.
-
Priapism, hemoglobin desaturation, and red blood cell adhesion in men with sickle cell anemia.Blood Cells Mol Dis. 2019 Nov;79:102350. doi: 10.1016/j.bcmd.2019.102350. Epub 2019 Aug 5. Blood Cells Mol Dis. 2019. PMID: 31404907 Free PMC article.
-
Shear dependent red blood cell adhesion in microscale flow.Integr Biol (Camb). 2018 Apr 23;10(4):194-206. doi: 10.1039/C8IB00004B. Integr Biol (Camb). 2018. PMID: 29557482 Free PMC article.
-
Whole blood viscosity and red blood cell adhesion: Potential biomarkers for targeted and curative therapies in sickle cell disease.Am J Hematol. 2020 Nov;95(11):1246-1256. doi: 10.1002/ajh.25933. Epub 2020 Aug 10. Am J Hematol. 2020. PMID: 32656816 Free PMC article.
-
Microfluidics in Sickle Cell Disease Research: State of the Art and a Perspective Beyond the Flow Problem.Front Mol Biosci. 2021 Mar 8;7:558982. doi: 10.3389/fmolb.2020.558982. eCollection 2020. Front Mol Biosci. 2021. PMID: 33763448 Free PMC article. Review.
Cited by
-
The burden of obstructive sleep apnea in pediatric sickle cell disease: a Kids' inpatient database study.Sleep. 2021 Feb 12;44(2):zsaa157. doi: 10.1093/sleep/zsaa157. Sleep. 2021. PMID: 32835382 Free PMC article.
-
A microfluidic device for assessment of E-selectin-mediated neutrophil recruitment to inflamed endothelium and prediction of therapeutic response in sickle cell disease.Biosens Bioelectron. 2023 Feb 15;222:114921. doi: 10.1016/j.bios.2022.114921. Epub 2022 Nov 24. Biosens Bioelectron. 2023. PMID: 36521205 Free PMC article.
-
Catch bonds in sickle cell disease: Shear-enhanced adhesion of red blood cells to laminin.Biophys J. 2023 Jun 20;122(12):2564-2576. doi: 10.1016/j.bpj.2023.05.010. Epub 2023 May 12. Biophys J. 2023. PMID: 37177783 Free PMC article.
-
Advances in Microfluidics for Single Red Blood Cell Analysis.Biosensors (Basel). 2023 Jan 9;13(1):117. doi: 10.3390/bios13010117. Biosensors (Basel). 2023. PMID: 36671952 Free PMC article. Review.
-
Blood rheology biomarkers in sickle cell disease.Exp Biol Med (Maywood). 2020 Jan;245(2):155-165. doi: 10.1177/1535370219900494. Epub 2020 Jan 16. Exp Biol Med (Maywood). 2020. PMID: 31948290 Free PMC article. Review.
References
-
- Peng C-C, Liao W-H, Chen Y-H, Wu C-Y, Tung Y-C. A Microfluidic Cell Culture Array with Various Oxygen Tensions. Lab on a Chip. 2013;13:3239–3245. - PubMed
-
- Brennan MD, Rexius-Hall ML, Elgass LJ, Eddington DT. Oxygen Control with Microfluidics. Lab on a Chip. 2014;14:4305–4318. - PubMed
-
- Semenza GL. Targeting Hif-1 for Cancer Therapy. Nature Reviews Cancer. 2003;3:721–732. - PubMed
-
- Harris AL. Hypoxia - a Key Regulatory Factor in Tumour Growth. Nature Reviews Cancer. 2002;2:38–47. - PubMed
Publication types
MeSH terms
Grants and funding
LinkOut - more resources
Full Text Sources
Other Literature Sources
Miscellaneous
