. 2017 Apr 4;12(4):e0175012.
doi: 10.1371/journal.pone.0175012. eCollection 2017.

The adenosine generating enzymes CD39/CD73 control microglial processes ramification in the mouse brain

Affiliations

The adenosine generating enzymes CD39/CD73 control microglial processes ramification in the mouse brain

Marina Matyash et al. PLoS One. .

Abstract

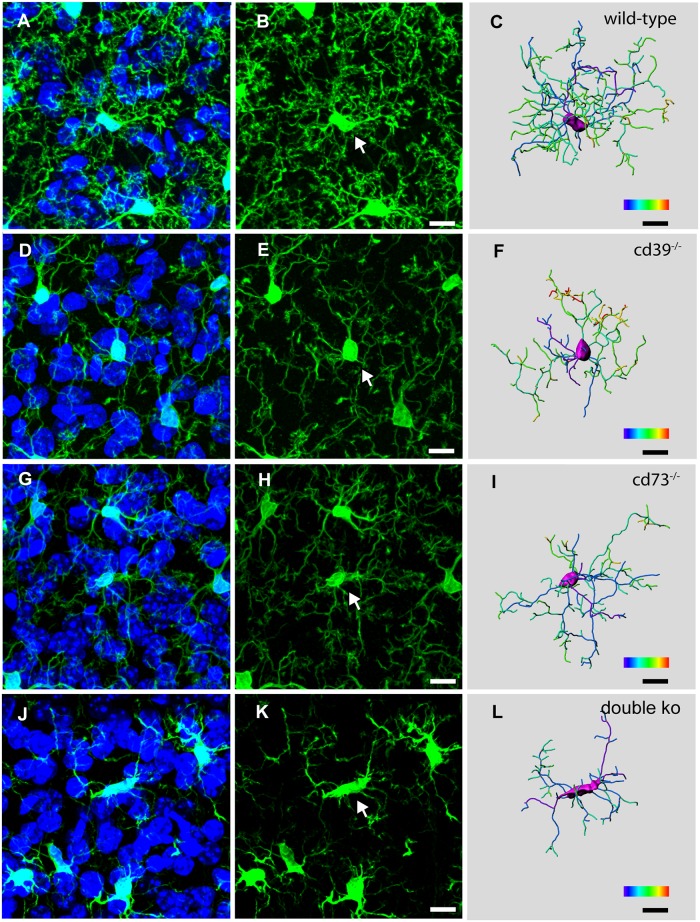
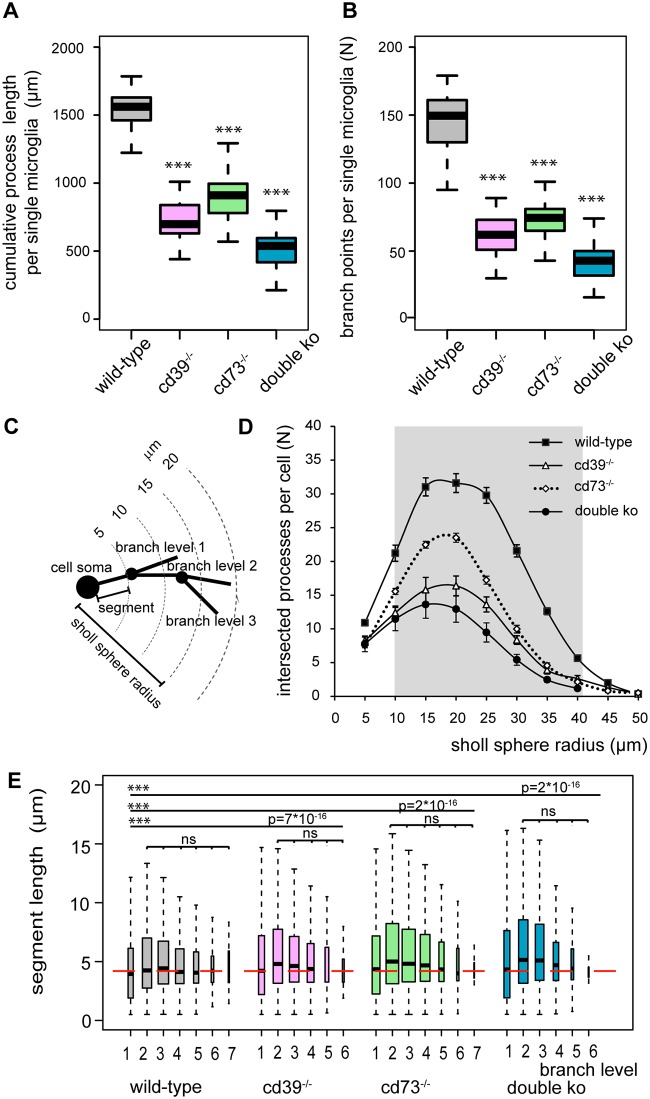
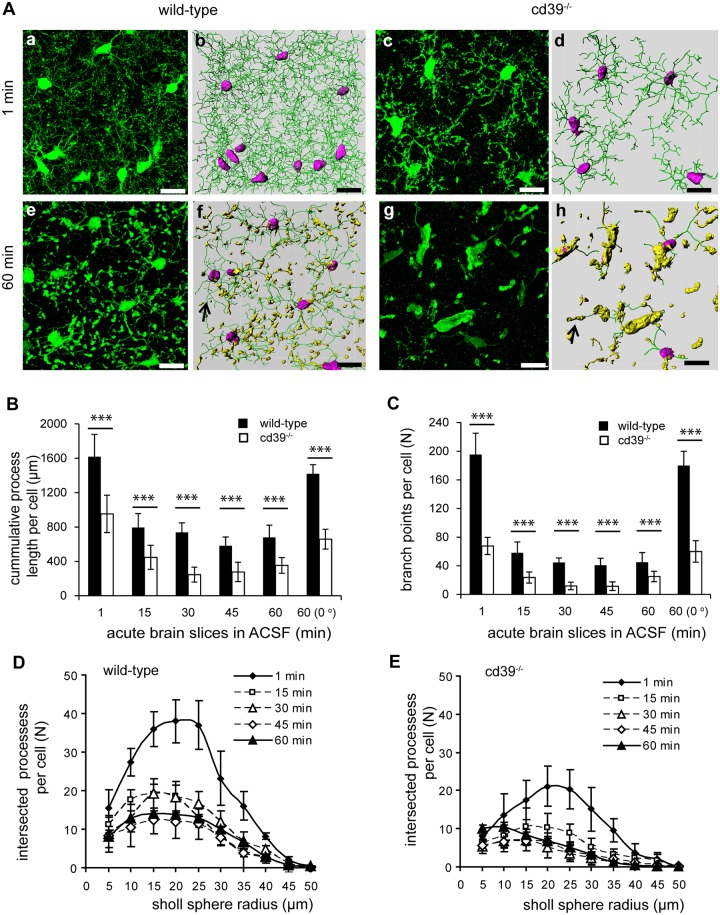
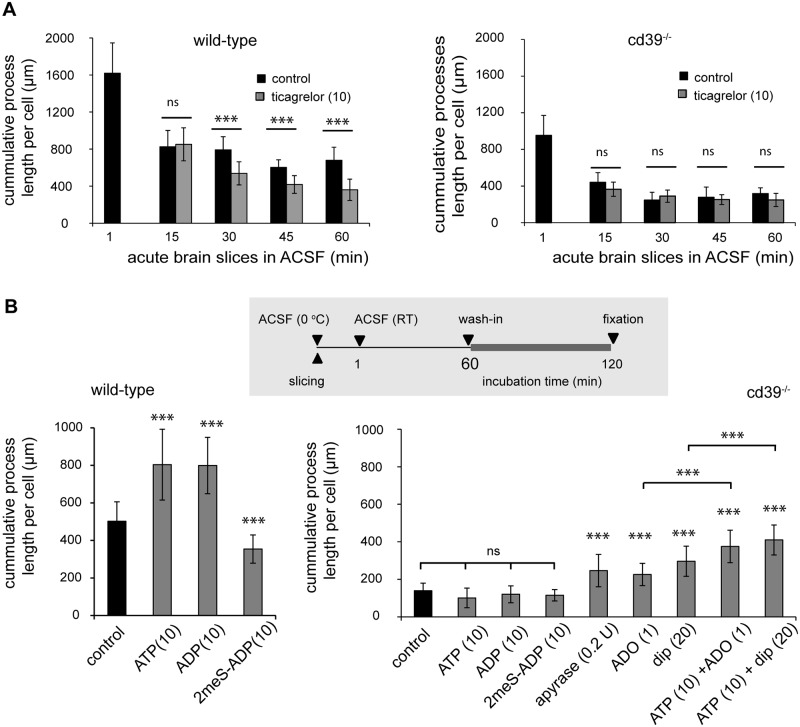
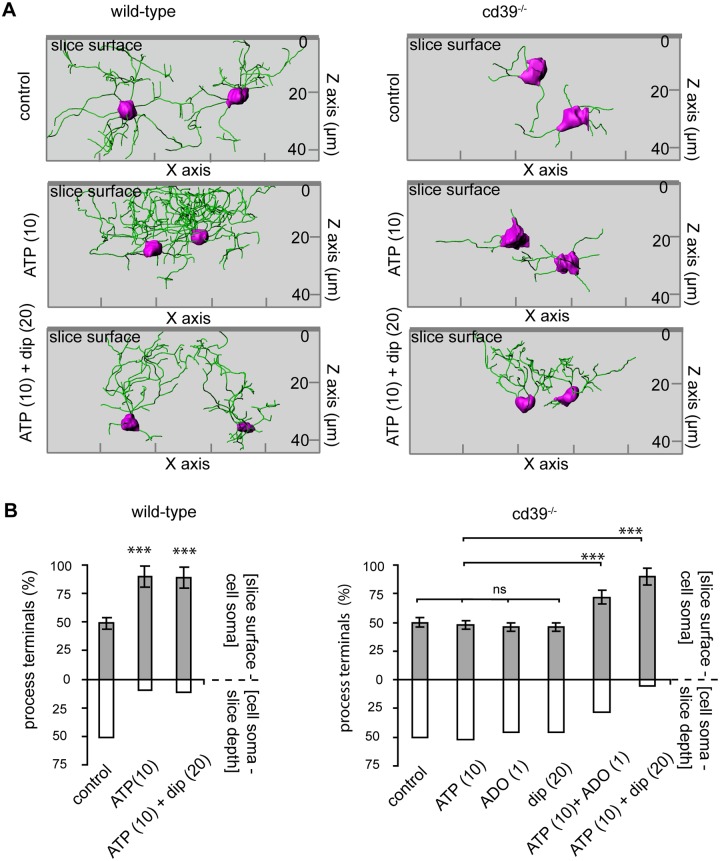
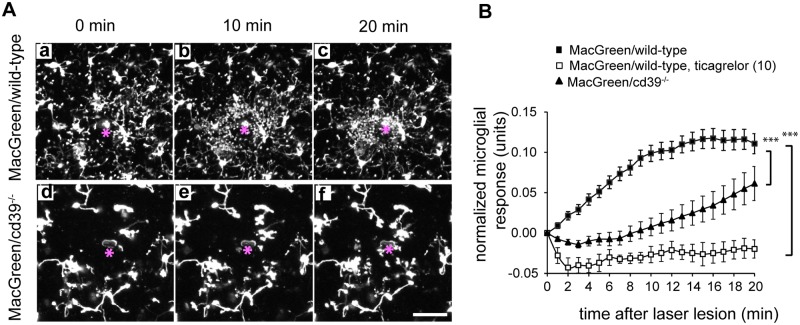
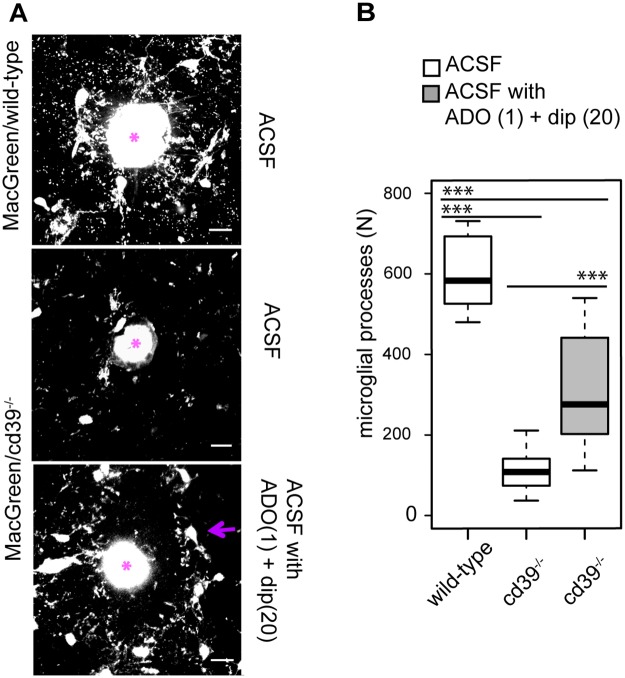
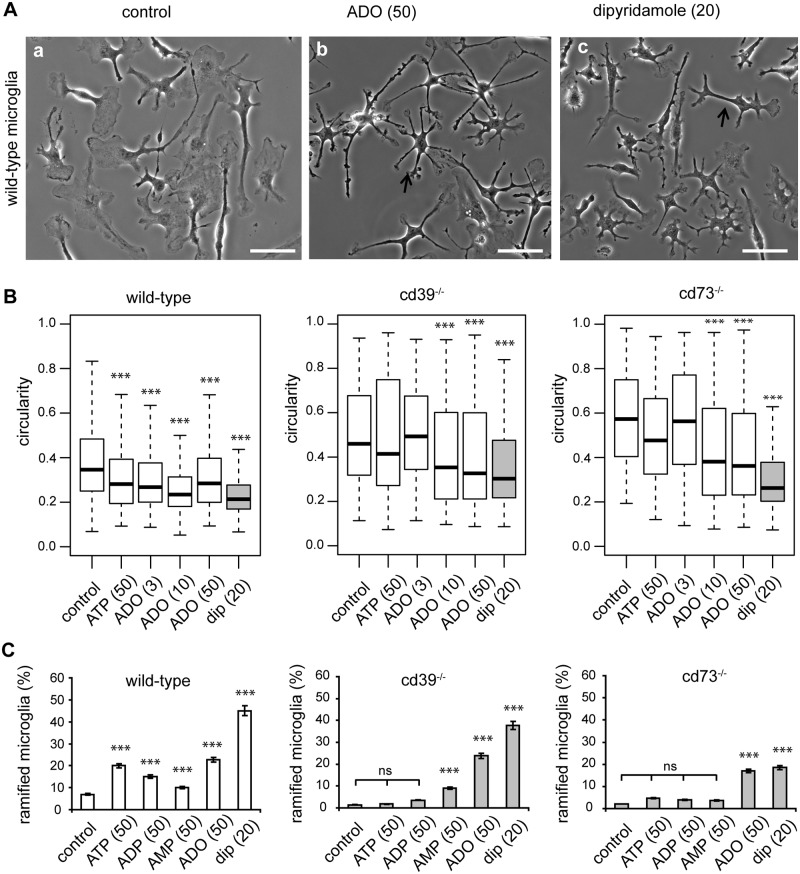
Microglial cells invade the brain as amoeboid precursors and acquire a highly ramified morphology in the postnatal brain. Microglia express all essential purinergic elements such as receptors, nucleoside transporters and ecto-enzymes, including CD39 (NTPDase1) and CD73 (5'-nucleotidase), which sequentially degrade extracellular ATP to adenosine. Here, we show that constitutive deletion of CD39 and CD73 or both caused an inhibition of the microglia ramified phenotype in the brain with a reduction in the length of processes, branching frequency and number of intersections with Sholl spheres. In vitro, unlike wild-type microglia, cd39-/- and cd73-/- microglial cells were less complex and did not respond to ATP with the transformation into a more ramified phenotype. In acute brain slices, wild-type microglia retracted approximately 50% of their processes within 15 min after slicing of the brain, and this phenomenon was augmented in cd39-/- mice; moreover, the elongation of microglial processes towards the source of ATP or towards a laser lesion was observed only in wild-type but not in cd39-/- microglia. An elevation of extracellular adenosine 1) by the inhibition of adenosine transport with dipyridamole, 2) by application of exogenous adenosine or 3) by degradation of endogenous ATP/ADP with apyrase enhanced spontaneous and ATP-induced ramification of cd39-/- microglia in acute brain slices and facilitated the transformation of cd39-/- and cd73-/- microglia into a ramified process-bearing phenotype in vitro. These data indicate that under normal physiological conditions, CD39 and CD73 nucleotidases together with equilibrative nucleoside transporter 1 (ENT1) control the fate of extracellular adenosine and thereby the ramification of microglial processes.


Conflict of interest statement

Competing Interests: The authors have declared that no competing interests exist.

Figures

Fig 1
Fig 1. Constitutive deletion of CD39 and/or CD73 attenuates microglial process ramification.
Three-dimensional confocal fluorescence images show iba-1/Alexa fluo-488 labelled microglia (left and middle panels) and DAPI-labelled nuclei (left panels), and 3-dimensional reconstruction of an individual microglial cell (right panel) in the somatosensory cortex of wild-type (A—C), cd39-/- (D—F), cd73-/- (G—I) and cd39-/-/cd73-/- (double ko) (J—L) adult (P56) mice are shown; white arrows mark a single microglial cell of which the 3-dimensional reconstructed image is shown in the right panel. Color bar scale decodes the branch level (from 1 to 7) of individual microglial segments. Scale bar denotes 10 μm.
Fig 2
Fig 2. Quantification of 3-dimensional microglial process ramification shows that microglia from adult (P56) cd39-/-, cd73-/-, and double knockout mice have a less complex morphology in the somatosensory cortex compared to those from wild-type mice.
Individual microglial cells from wild-type (grey, N = 46), cd39-/- (pink, N = 46), cd73-/- (green, N = 70) and double knockout (cd39-/-/cd73-/-) (blue, N = 128) mice were analyzed using Imaris 6.7.4; N represents the number of individual cells. Box plots show that cumulative processes length (A) was shorter with a fewer number of branch points (B) in the knockout microglia. C is a scheme to illustrate the Sholl analysis. The number of processes intersecting concentric rings every 5 μm is shown in D. The grey area marks the Sholl sphere radius where a significant (p < 0.001) reduction in the number of Sholl intersections in knockout microglia in comparison to wild-type microglia was found. (E) Box plots show the length of individual segments for each branch level (1 to 6) of wild-type (grey, N = 13650), cd39-/- (pink, N = 5709), cd73-/- (green, N = 10740) and double knockout (blue, N = 11778) microglial cells. In each box plot, the bar demarks the median, the box demarks the range from 25% to 75% of the data, and the dotted lines indicate the entire range of data. N represents the number of analyzed segments. The depth of process branching (branch level) was reduced whereas the length of individual segments was increased in knockout mice; the red dashed line shows the median of the segment length in wild-type microglia. ns denotes p > 0.5 and *** denotes p < 0.001.
Fig 3
Fig 3. Quantification of 3-dimensional microglial process ramification shows a rapid reduction in the ramified phenotype of microglia in acute brain slices of adult (P56) wild-type and cd39-/- mice.
(A) Three-dimensional fluorescence confocal images (a, c, e, g) and the corresponding rendered images of processes (b, d, f, h) of microglia in acute slices of somatosensory cortex of wild-type (left) and cd39-/- (right) mice are shown; the green lines (marked by arrow) on rendered images show the processes; the microglial cell soma is labeled in pink; and membranous swellings along the processes are in yellow. (B) Cumulative length of microglial processes and (C) the number of branch points were quantified 1 minute and then every 15 min after slicing of brains of wild-type (black bars) and cd39-/- (white bars) mice. The last column shows the values from slices maintained in ACSF for 60 min at 0°C. (D) The number of Sholl intersections per microglia were measured (as described in the legend to Fig 2) at different time points after slicing brains of wild-type (left) and cd39-/- (right) mice. Scale bar denotes 15 μm. ns denotes p > 0.5 and *** denotes p < 0.001.
Fig 4
Fig 4. In acute brain slices, microglial process growth is promoted by constitutive activity of P2Y12 receptors and availability of extracellular adenosine.
(A) As described in the legend to Fig 3, the cumulative process length of microglia was measured 1 minute and then every 15 min after acute slice preparation. In comparison to control (black bars) conditions, constitutive inhibition of P2Y12 receptors with ticagrelor (grey bars, 10 μM) significantly decreased the cumulative length of microglial processes in acute brain slices from wild-type (left) but not from cd39-/- mice (right). (B) On top, the scheme indicates the experimental arrangement. In wild-type microglia (left) but not in cd39-/- mice (right), ATP (10 μM) and ADP (10 μM) increased the cumulative length of microglial processes in comparison to control (black bars) slices. 2meS-ADP (10 μM) even decreased process length in acute brain slices of wild-type but not of cd39-/- mice. Application of apyrase (0.2U), adenosine (ADO, 1 μM), dipyridamole (dip, 20 μM), and a combined application of ATP and adenosine or ATP and dipyridamole increased the cumulative length of microglial processes in cd39-/- mice in comparison to control (black bars) conditions. ns denotes p > 0.5 and *** denotes p < 0.001.
Fig 5
Fig 5. Directional movement of microglial processes towards the surface in acute brain slices requires ATP and adenosine.
(A) Representative rendered images of 3-dimensional confocal fluorescence images of iba-1/Alexa fluo-488 labelled microglia in acute brain slices of wild-type (left) and cd39-/- (right) mice are shown. The green lines show the processes, and the cell soma is labeled in pink. In wild-type and cd39-/- mice, the microglial processes are randomly distributed around the cell soma in control conditions. In wild-type mice but not in cd39-/- mice, ATP (10 μM) induced re-orientation and elongation of microglial processes towards the slice surface (left two images). Dipyridamole (dip, 20 μM) restored the ability of cd39-/- microglia to re-orient the processes in an ATP gradient. On the Z axis, the coordinate of the slice surface is zero (0). (B) The bars show a distribution of the cumulative number of process terminal points between two compartments: above (grey) and below (white) the position of the microglia soma with respect to the slice surface. ns denotes p > 0.5, *** denotes p < 0.001.
Fig 6
Fig 6. Activity of CD39 is required for directional movement of microglia processes towards a laser lesion in acute brain slices.
(A) Movement of microglia processes in acute brain slices of MacGreen/wild-type or MacGreen/cd39-/- mice expressing EGFP under the control of colony stimulating factor 1 receptor promoter (CSF1R) was studied using two-photon time-lapse microscopy. A laser lesion (marked by asterisk) was set, 60 μm-thick Z-stacks with a step size of 3 μm covering a field of 307 x 307 μm were acquired every minute. The extension of the processes toward the laser lesion was strongly attenuated in cd39-/- mice. Images show maximum intensity projections of 60 μm-thick Z-stacks. Scale bar 20 μm. (B). Quantification of laser lesion in MacGreen/wild-type (black squares) and MacGreen/cd39-/- mice (black triangles) over a 20-min time course is shown (n = 8 mice per genotype, 3 slices per an individual mouse), and data are shown as the mean values and standard error of mean. P2Y12 receptor inhibitor ticagrelor (10 μM, white squares) abrogated process movement towards a laser lesion in slices of wild-type mice; slices were pre-incubated with ticagrelor for 20 min before the laser lesion was set. Subsequently, microglial process movement towards the laser lesion was recorded in the presence of ticagrelor. Normalized microglial responses measured 20 min after the laser lesion were compared; significant difference was tested by one-way ANOVA, *** denotes p < 0.001.
Fig 7
Fig 7. Extracellular adenosine is required for a directional movement of microglial processes towards a focal laser lesion in acute brain slice.
(A) Accumulation of microglia processes around a focal laser lesion in an acute brain slice derived from MacGreen/wild-type andMacGreen/cd39-/- mice was studied using confocal microscopy; after a laser lesion was set a brain slice was incubated either with ACSF alone (ACSF) or with ACSF supplemented with adenosine (ADO, 1 μM) and dipyridamole (dip, 20 μM). A laser lesion was set as marked by asterisk. Scale bar 15 μm. (B) Box-plot shows the absolute number of microglial processes that were accumulated around a laser lesion spot in slices from MacGreen/wild-type mice (lesions, n = 9) and in slices from MacGreen/cd39-/- mice in the presence of ACSF alone (lesions, n = 17; white box) and in ACSF supplemented with adenosine (ADO, 1 μM) and dipyridamole (dip, 20 μM) (lesions, n = 15) (grey box); black lines show the median of the data. Significant difference was tested by one-way ANOVA, *** denotes p < 0.001.
Fig 8
Fig 8. Primary neonatal microglial cells cultured from cd39-/- and cd73-/- mice move more slowly, form fewer protrusions and are more round when compared to wild-type microglia.
Cells were monitored by time-lapse video microscopy, and 60 min-long time-series of phase-contrast images were analyzed. (A) A representative first image and a projection of all images in a time-series (60 min) of wild-type (a, b), cd39-/- (c, d) and cd73-/- (e, f) microglia are shown; cells were cultivated under serum-free conditions for no longer than 12 h. Explored areas (during 60 min) were compared, and *** denotes p < 0.001. (B) Summary of the area covered by cells (explored area) during 15, 30 and 60 min. The explored area resulted from protrusions of processes and a translocation of the cell body; explored area was measured as a difference between the entire area which was marked by a cell during the defined period and the cell area measured on the first image. Microglial cells were cultivated under serum-free conditions (control, upper panel) or in the presence of the P2Y12 receptor inhibitor ticagrelor (5 μM, bottom panel). Knockout microglia were significantly slower in comparison to wild-type cells, and ticagrelor abrogated the exploring activity of microglia. (C) Phase-contrast images of wild-type (a), cd39-/- (b) and cd73-/- (c) microglia cultivated for 24 h in a serum-free medium are shown. Scale bar is 20 μm. Histograms show the distribution of cell circularity (D) and cell area (E) of wild-type (N = 2590), cd39-/- (N = 1100) and cd73-/- (N = 2490) microglia; N represents the number of individual cells. For every genotype, circularities and cell areas were collected from at least 1000 cells from 5 independent primary cell cultures; at least 200 individual cells per culture dish were measured. Significant differences were tested by one-way ANOVA, and *** denotes p < 0.001 in comparison to control.
Fig 9
Fig 9. Adenosine is required for the transformation of microglia into a ramified phenotype in vitro.
Microglia were cultivated for 24 h in serum-free medium alone or in the presence of ATP, adenosine or dipyridamole. (A) Phase-contrast images of wild-type microglia in control conditions (left image), in the presence of adenosine (ADO, 50 μM, middle image), or dipyridamole (20 μM, right image) are shown. Arrows mark ramified microglial cells with a circularity < 0.3. Scale bar is 20 μm. (B) Box plots show the distribution of cell circularities of microglia from wild-type (left), cd39-/- (middle) and cd73-/- mice (right) as well as knockout microglia in control solution or after addition of ATP (50 μM), adenosine (ADO, 3 μM, 10 μM, 50 μM) or dipyridamole (dip, 20 μM). Data show circularities of at least 200 cells per one experiment out of 3 independent experiments. (C) We classified cells with a circularity < 0.3 as ramified and plotted the proportion of ramified cells in a population of wild-type (left, white bars), cd39-/- (middle, grey bars) and cd73-/- (right, grey bars) microglia. Cells were cultivated in medium alone (control) or in the presence of ATP (50 μM), ADP (50 μM) and AMP (50 μM), adenosine (ADO, 50 μM) or dipyridamole (dip, 20 μM). Significant differences were tested by comparison of multiple proportions. *** denotes p < 0.001 in comparison to control.

Similar articles

Cited by

References

    1. Kettenmann H, Hanisch UK, Noda M, Verkhratsky A. Physiology of microglia. Physiol Rev. 2011;91(2):461–553. 10.1152/physrev.00011.2010 - DOI - PubMed
    1. Kettenmann H, Kirchhoff F, Verkhratsky A. Microglia: new roles for the synaptic stripper. Neuron. 2013;77(1):10–8. 10.1016/j.neuron.2012.12.023 - DOI - PubMed
    1. Ginhoux F, Greter M, Leboeuf M, Nandi S, See P, Gokhan S, et al. Fate mapping analysis reveals that adult microglia derive from primitive macrophages. Science. 2010;330(6005):841–5. 10.1126/science.1194637 - DOI - PMC - PubMed
    1. Gomez Perdiguero E, Klapproth K, Schulz C, Busch K, Azzoni E, Crozet L, et al. Tissue-resident macrophages originate from yolk-sac-derived erythro-myeloid progenitors. Nature. 2015;518(7540):547–51. 10.1038/nature13989 - DOI - PMC - PubMed
    1. Davalos D, Grutzendler J, Yang G, Kim JV, Zuo Y, Jung S, et al. ATP mediates rapid microglial response to local brain injury in vivo. Nat Neurosci. 2005;8(6):752–8. 10.1038/nn1472 - DOI - PubMed

MeSH terms

Grants and funding

This work was supported by Deutsche Forschungsgemeinscaft FOR 748 and NeuroCure.

LinkOut - more resources