Role of endothelial-to-mesenchymal transition induced by TGF-β1 in transplant kidney interstitial fibrosis
- PMID: 28374926
- PMCID: PMC5618680
- DOI: 10.1111/jcmm.13157
Role of endothelial-to-mesenchymal transition induced by TGF-β1 in transplant kidney interstitial fibrosis
Abstract
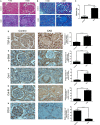
Chronic allograft dysfunction (CAD) induced by kidney interstitial fibrosis is the main cause of allograft failure in kidney transplantation. Endothelial-to-mesenchymal transition (EndMT) may play an important role in kidney fibrosis. We, therefore, undertook this study to characterize the functions and potential mechanism of EndMT in transplant kidney interstitial fibrosis. Proteins and mRNAs associated with EndMT were examined in human umbilical vein endothelial cells (HUVECs) treated with transforming growth factor-beta1 (TGF-β1) at different doses or at different intervals with western blotting, qRT-PCR and ELISA assays. Cell motility and migration were evaluated with motility and migration assays. The mechanism of EndMT induced by TGF-β1 was determined by western blotting analysis of factors involved in various canonical and non-canonical pathways. In addition, human kidney tissues from control and CAD group were also examined for these proteins by HE, Masson's trichrome, immunohistochemical, indirect immunofluorescence double staining and western blotting assays. TGF-β1 significantly promoted the development of EndMT in a time-dependent and dose-dependent manner and promoted the motility and migration ability of HUVECs. The TGF-β/Smad and Akt/mTOR/p70S6K signalling pathways were found to be associated with the pathogenesis of EndMT induced by TGF-β1, which was also proven in vivo by the analysis of specimens from the control and CAD groups. EndMT may promote transplant kidney interstitial fibrosis by targetting the TGF-β/Smad and Akt/mTOR/p70S6K signalling pathways, and hence, result in the development of CAD in kidney transplant recipients.
Keywords: Akt/mTOR/p70S6K; Smad; chronic allograft dysfunction; endothelial-to-mesenchymal transition; kidney interstitial fibrosis; kidney transplantation; transforming growth factor-beta1.
© 2017 The Authors. Journal of Cellular and Molecular Medicine published by John Wiley & Sons Ltd and Foundation for Cellular and Molecular Medicine.
Figures


Similar articles
-
Antifibrotic Effects of Hepatocyte Growth Factor on Endothelial-to-Mesenchymal Transition via Transforming Growth Factor-Beta1 (TGF-β1)/Smad and Akt/mTOR/P70S6K Signaling Pathways.Ann Transplant. 2018 Jan 2;23:1-10. doi: 10.12659/aot.906700. Ann Transplant. 2018. PMID: 29292365 Free PMC article.
-
Transforming Growth Factor-β1 Induces Endothelial-to-Mesenchymal Transition via Akt Signaling Pathway in Renal Transplant Recipients with Chronic Allograft Dysfunction.Ann Transplant. 2016 Dec 20;21:775-783. doi: 10.12659/aot.899931. Ann Transplant. 2016. PMID: 27994216
-
Celastrol protects TGF-β1-induced endothelial-mesenchymal transition.J Huazhong Univ Sci Technolog Med Sci. 2017 Apr;37(2):185-190. doi: 10.1007/s11596-017-1713-0. Epub 2017 Apr 11. J Huazhong Univ Sci Technolog Med Sci. 2017. PMID: 28397045
-
Transcriptional regulation of endothelial-to-mesenchymal transition in cardiac fibrosis: role of myocardin-related transcription factor A and activating transcription factor 3.Can J Physiol Pharmacol. 2017 Oct;95(10):1263-1270. doi: 10.1139/cjpp-2016-0634. Epub 2017 Jul 7. Can J Physiol Pharmacol. 2017. PMID: 28686848 Review.
-
TGF-β signaling via TAK1 pathway: role in kidney fibrosis.Semin Nephrol. 2012 May;32(3):244-52. doi: 10.1016/j.semnephrol.2012.04.003. Semin Nephrol. 2012. PMID: 22835455 Free PMC article. Review.
Cited by
-
Endothelial Cell-Specific Molecule 1 Promotes Endothelial to Mesenchymal Transition in Renal Fibrosis.Toxins (Basel). 2020 Aug 6;12(8):506. doi: 10.3390/toxins12080506. Toxins (Basel). 2020. PMID: 32781625 Free PMC article.
-
Impaired ATG16L-Dependent Autophagy Promotes Renal Interstitial Fibrosis in Chronic Renal Graft Dysfunction Through Inducing EndMT by NF-κB Signal Pathway.Front Immunol. 2021 Apr 13;12:650424. doi: 10.3389/fimmu.2021.650424. eCollection 2021. Front Immunol. 2021. PMID: 33927720 Free PMC article.
-
Iguratimod Attenuates Macrophage Polarization and Antibody-Mediated Rejection After Renal Transplant by Regulating KLF4.Front Pharmacol. 2022 May 9;13:865363. doi: 10.3389/fphar.2022.865363. eCollection 2022. Front Pharmacol. 2022. PMID: 35614941 Free PMC article.
-
Recent Advances on Biomarkers of Early and Late Kidney Graft Dysfunction.Int J Mol Sci. 2020 Jul 29;21(15):5404. doi: 10.3390/ijms21155404. Int J Mol Sci. 2020. PMID: 32751357 Free PMC article. Review.
-
Huoxue Jiedu Huayu recipe inhibits macrophage-secreted vascular endothelial growth factor-a on angiogenesis and alleviates renal fibrosis in the contralateral kidneys of unilateral ureteral obstruction rats.J Tradit Chin Med. 2024 Jun;44(3):458-467. doi: 10.19852/j.cnki.jtcm.20240423.005. J Tradit Chin Med. 2024. PMID: 38767629 Free PMC article.
References
-
- Heemann U, Lutz J. Pathophysiology and treatment options of chronic renal allograft damage. Nephrol Dial Transplant. 2013; 28: 2438–46. - PubMed
-
- Nankivell BJ, Borrows RJ, Fung CL, et al The natural history of chronic allograft nephropathy. N Engl J Med. 2003; 349: 2326–33. - PubMed
-
- Campistol JM, Boletis IN, Dantal J, et al Chronic allograft nephropathy–a clinical syndrome: early detection and the potential role of proliferation signal inhibitors. Clin Transplant. 2009; 23: 769–77. - PubMed
Publication types
MeSH terms
Substances
LinkOut - more resources
Full Text Sources
Other Literature Sources
Medical
Miscellaneous

