. 2017 Apr 26;37(17):4604-4617.
doi: 10.1523/JNEUROSCI.3736-16.2017. Epub 2017 Mar 31.

Synaptotagmin2 (Syt2) Drives Fast Release Redundantly with Syt1 at the Output Synapses of Parvalbumin-Expressing Inhibitory Neurons

Affiliations

Synaptotagmin2 (Syt2) Drives Fast Release Redundantly with Syt1 at the Output Synapses of Parvalbumin-Expressing Inhibitory Neurons

Brice Bouhours et al. J Neurosci. .

Abstract

Parvalbumin-expressing inhibitory neurons in the mammalian CNS are specialized for fast transmitter release at their output synapses. However, the Ca2+ sensor(s) used by identified inhibitory synapses, including the output synapses of parvalbumin-expressing inhibitory neurons, have only recently started to be addressed. Here, we investigated the roles of Syt1 and Syt2 at two types of fast-releasing inhibitory connections in the mammalian CNS: the medial nucleus of the trapezoid body to lateral superior olive glycinergic synapse, and the basket/stellate cell-Purkinje GABAergic synapse in the cerebellum. We used conditional and conventional knock-out (KO) mouse lines, with viral expression of Cre-recombinase and a light-activated ion channel for optical stimulation of the transduced fibers, to produce Syt1-Syt2 double KO synapses in vivo Surprisingly, we found that KO of Syt2 alone had only minor effects on evoked transmitter release, despite the clear presence of the protein in inhibitory nerve terminals revealed by immunohistochemistry. We show that Syt1 is weakly coexpressed at these inhibitory synapses and must be genetically inactivated together with Syt2 to achieve a significant reduction and desynchronization of fast release. Thus, our work identifies the functionally relevant Ca2+ sensor(s) at fast-releasing inhibitory synapses and shows that two major Syt isoforms can cooperate to mediate release at a given synaptic connection.SIGNIFICANCE STATEMENT During synaptic transmission, the influx of Ca2+ into the presynaptic nerve terminal activates a Ca2+ sensor for vesicle fusion, a crucial step in the activity-dependent release of neurotransmitter. Synaptotagmin (Syt) proteins, and especially Syt1 and Syt2, have been identified as the Ca2+ sensor at excitatory synapses, but the Ca2+ sensor(s) at inhibitory synapses in native brain tissue are not well known. We found that both Syt1 and Syt2 need to be genetically inactivated to cause a significant reduction of activity-evoked release at two types of fast inhibitory synapses in mouse brain. Thus, we identify Syt2 as a functionally important Ca2+ sensor at fast-releasing inhibitory synapses, and show that Syt1 and Syt2 can redundantly control transmitter release at specific brain synapses.

Keywords: calcium sensor; inhibitory synapse; neurotransmitter release; optogenetics; parvalbumin interneuron; synaptotagmin.


Figures

Figure 1.
Figure 1.
Glycine release at the MNTB-LSO inhibitory synapse is unchanged in Syt2−/− mice. A, Scheme of the MNTB-LSO inhibitory synapse (Kim and Kandler, 2003). B, IPSCs recorded in LSO neurons of a Syt2+/+ littermate control (wild-type) mouse at P12 (left) and in a Syt2−/− mouse at P14 (right), following afferent fiber stimulation. Stimulation intensities are indicated. C, Average and individual data points for minimal and maximal IPSC amplitudes. D, Quantification of 20%–80% rise time of IPSCs (left) and IPSC decay time constants (right). These parameters were not significantly different in Syt2−/− mice (n = 10) compared with Syt2+/+ mice (n = 7; p > 0.05 for all comparisons, unpaired t test). E, Example traces for spontaneous IPSCs recorded in a Syt2+/+ mouse (left; P14) and in a Syt2−/− mouse (right; P15). F, Average and individual data points for spontaneous IPSC frequency and spontaneous IPSC amplitude. **p < 0.01. For statistical tests used, see Materials and Methods.
Figure 2.
Figure 2.
Syt1 is weakly coexpressed with Syt2 at inhibitory synapses on LSO neurons. A, Colabeling with antibodies against VGAT (left panel; magenta channel), Syt1 (second from left, yellow channel), Syt2 (second from right, cyan channel), and the merged image of all three channels, in an immunohistochemical experiment on the level of the LSO. A Syt2+/+ mouse at postnatal day 14 (P14) was used. B, Same immunohistochemical staining as in A, but now for a littermate Syt2−/− mouse at the same age (P14). Note the clear absence of specific signal in the Syt2 channel, whereas the Syt1 signal is unaffected. C, Quantification of pixel intensity for VGAT, Syt1, and Syt2 in VGAT-positive nerve terminals on LSO neurons. The values connected by thin lines indicate the pixel intensity averaged over all individual VGAT-positive punctae of a given section. In Syt2−/− mice, the fluorescence signal in the Syt2 channel was clearly absent (p < 0.001), whereas the Syt1 fluorescence intensity was not changed significantly (p = 0.21). D, E, Colabeling with antibodies against VGAT (left panel), Syt1 (second from left), and an anti-GFP antibody to detect oChIEFeYFP (second from right), and the overlay image (right). D, A Syt1+/+ mouse was injected with lenti:oChIEFeYFP-IRES-Cre (control). E, A littermate P15 Syt1lox/lox mouse was injected with lenti:oChIEFeYFP-IRES-Cre into the MNTB at P1 (thus producing Syt1 cKO synapses). Note the presence (D) and absence (E) of weak perisomatic Syt1 signal nerve terminals positive for VGAT and oChIEFeYFP (arrowheads). F, Histogram of the pixel intensity in the Syt1 channel of VGAT- and oChIEFeYFP-positive nerve terminals for the two conditions. Note the highly significant reduction of Syt1 immunofluorescence intensity in the Syt1 cKO synapses. Scale bar, 5 μm. ***p < 0.001.
Figure 3.
Figure 3.
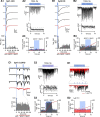
Optogenetic targeting and stimulation of MNTB-LSO synapses. A, Scheme of the lentiviral infection of MNTB neurons with a construct driving the expression of a light-activated ion channel (oChIEF) and Cre-recombinase (hSyn:oChIEFeYFP-IRES-Cre). The transfected fibers from Cre-expressing neurons are selectively amenable to optic stimulation. B, Confocal image of a brainstem slice of a P15 mouse on the level of the MNTB and LSO, 15 d after transfection. Bottom images, Higher-magnification images of the MNTB (left) and LSO (right), at the positions indicated in the top image (white squares). Scale bars: Top, 200 μm; Bottom, 50 μm. C, Optogenetically evoked IPSCs, here in response to a 10 Hz train, were blocked by bath application of 4 μm strychnine. D1–D3, Optogenetic stimulation experiment in an LSO slice of a P13 Syt1+/+, Syt2+/+ mouse, injected at P0 with the construct shown in A. D1, Three successively recorded IPSCs in response to the first optogenetic stimuli of 10 Hz trains (black traces). Red trace (here and in subsequent figures) represents the average of n = 10 successive trials. Bottom, Histogram of event frequency for 100 ms following the light stimuli (averaged over all 50 periods of the 10 Hz stimulus trains, and for n = 10 trains). Note the peak of synchronous events at the onset of stimulation. Spontaneous and asynchronous release events were detected at 20–100 ms following optical stimulation (see Materials and Methods). D2, A single IPSC train in response to a 10 Hz train. Bottom, Relative depression (normalized to the average first IPSC amplitude) for all 10 Hz trains in this recording (gray data points). The average depression time course (black data points) was fitted with an exponential function (black line). D3, Time course of spontaneous release frequency before and after the train, and of asynchronous and spontaneous release during the 10 Hz optogenetic trains. Red line indicates cumulative event frequency (see right axis). Blue lines indicate averages of the release frequencies during the three different 5 s intervals.
Figure 4.
Figure 4.
Disrupted fast inhibitory transmission and increased asynchronous release are limited to Syt1-Syt2 cDKO synapses. A, Optogenetically evoked IPSCs in Syt1 cKO synapses at P14, produced by injecting the lenti: hSyn: oChIEFeYFP-IRES-Cre virus (Fig. 3A) into the MNTB of a Syt1lox/lox, Syt2+/+ mouse at P0. The arrangement of traces follows that shown for the optogenetic experiment in wild-type synapses (Fig. 3D1–D3). A1, Three consecutive IPSCs (black traces) and the average of n = 10 successive IPSCs (red), and the histogram of event frequency for all light stimuli at 10 Hz (bottom). A2, A single example IPSC trace in response to a 10 Hz train of optical stimuli, as well as average and single data points for relative depression (bottom). A3, Histogram of spontaneous and asynchronous IPSC frequency before, during, and after the optogenetic stimulation train. Blue line indicates average spontaneous release frequency during three 5 s intervals. Red line indicates the cumulative release frequency (right axis). Note the clear phasic release and the absence of an increase in spontaneous and asynchronous release in Syt1 cKO synapses. A1–A3, All traces are from the same recording. B, Example of an optogenetic recording in a P12 Syt2−/− mouse, injected at P0 with the lentivirus (thus, Syt2 KO synapses were studied). B1–B3, The arrangement is the same as in A. Note the increased spontaneous release in the Syt2 KO synapses, but no additional asynchronous release during the optogenetic stimulation train. C, Optogenetic stimulation of IPSCs in a Syt1lox/lox, Syt2−/− mouse at P15 (thus, Syt1-Syt2 cDKO synapses were studied after expression of Cre-recombinase and oChIEF). Note the absence of time-locked IPSCs (C1) and the strongly increased asynchronous release frequency (C1, bottom; C3). Upon 10 Hz trains, the remaining IPSC (see C1, red average IPSC trace) does not show depression but rather facilitation (C2, bottom). D, Application of 1 μm TTX in the same recording as shown in C leads to suppression of evoked asynchronous release (D1), but spontaneous release persists as expected. The histogram of spontaneous, and spontaneous plus asynchronous release events (D2), demonstrates that events sampled during the optogenetic stimulation train (D2, time indicated by blue shaded area) correctly quantify the spontaneous release rate.
Figure 5.
Figure 5.
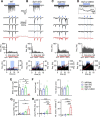
Syt1 and Syt2 act redundantly at the MNTB-LSO synapse to drive fast glycine release. Individual and average values are displayed for optogenetic stimulation experiments in wild-type synapses (black symbols), in Syt1 cKO synapses (blue), in Syt2 KO synapses (green), and in Syt1-Syt2 cDKO synapses (red). A, Individual and average values for IPSC amplitudes. B, The 20%–80% rise time (left) and IPSC decay time constants (right) for the first IPSC of the train of optical stimuli. C, Quantal size as estimated by the average spontaneous IPSC amplitude in each recording. Note the unchanged quantal size across all genotypes. D, Spontaneous release frequency. E, Asynchronous release frequency (left), and relative asynchronous frequency (right), calculated as explained in Results and Materials and Methods. F, Normalized IPSC depression curves during 10 Hz trains of optical stimuli for all genotypes, as indicated. Each gray line indicates the average relative depression curve for an individual recording. Color symbols represent the averages across all cells in each group. Note the strong reversal from depression to facilitation in Syt1-Syt2 cDKO synapses (right). Number of recorded cells were as follows: wild-type, n = 11; Syt1 cKO, n = 7; Syt2 KO, n = 11; Syt1-Syt2 cDKO, n = 8. Data are mean ± SEM. The significance was tested with ANOVA or the Kruskal–Wallis test (for IPSC amplitudes and quantal content), and is only indicated for those pairs that showed a significant difference. *p < 0.05. **p < 0.01. ***p < 0.001. A–G, For most comparisons, only the Syt1-Syt2 cDKO synapses showed significant differences to the remaining groups (see asterisks), with exception of the spontaneous release rate (D), which was also significantly different in Syt2 KO synapses.
Figure 6.
Figure 6.
Syt1 and Syt2 redundantly support fast release at inhibitory synapses onto cerebellar Purkinje cells. A–D, Response to 10 Hz trains of optogenetic stimuli recorded in Purkinje neurons after virus-mediated expression of Cre-recombinase and oChIEF in the cerebellum. From top to bottom: blue trace represents 10 Hz light stimulus; black traces represent recorded IPSCs; black traces represent successive IPSCs in response to 10 Hz optical stimuli at higher time resolution (first three IPSCs only); red trace represents average IPSCs of 10 successive stimuli; histogram of event frequency for 100 ms following the light stimuli (average over 50 periods); histogram of spontaneous and asynchronous IPSC frequency before, during, and after the optogenetic stimulation train (red line indicates cumulative event frequency; blue line indicates average value for each 5 s interval). Light red trace in A represents the IPSCs in the presence of 10 μm bicuculline. D, Inset, Low-pass filtered (2 Hz) response to the 10 Hz optogenetic train (average of n = 10 traces). E, Individual and average values for IPSC amplitudes measured in all four genotype groups. F, The 20%–80% rise times (left) and IPSC decay time constants (right) for all four groups. In Syt2 KO synapses, the kinetic parameters could not be estimated because phasic evoked release events were absent (see D, bottom, red trace). G, Individual and average values for spontaneous IPSC frequency. H, Asynchronous IPSC frequency (left) and relative asynchronous release frequency (right). Number of recorded cells: wild-type synapses, n = 5; Syt1 KO synapses, n = 8; Syt2 KO synapses, n = 5; Syt1-Syt2 cDKO synapses, n = 5. Average data are presented as mean ± SEM. A significant difference was only observed in the comparisons involving the Syt1-Syt2 cDKO group (see asterisks), indicating that Syt1 and Syt2 act redundantly in inhibitory synapses on cerebellar Purkinje cells. *p < 0.05. **p < 0.01. ***p < 0.001.
Figure 7.
Figure 7.
Immunohistochemical evidence for coexpression of Syt1 and Syt2 in inhibitory synapses onto cerebellar Purkinje cells. A, Coronal sections of a P14 wild-type mouse were stained with anti-VGAT antibody (left), anti-Syt1 antibody (middle), and anti-Syt2 antibody (right); the overlay image is shown in the rightmost panel. Note the strongly Syt1-positive parallel fibers in the molecular layer (second panel, *). B, Higher-magnification images of the area highlighted by a white box in A. Note three VGAT-, Syt1-, and Syt2-positive punctae on the proximal dendrite of the Purkinje cell (white arrowheads), and more weakly Syt1-expressing inhibitory terminals close to the soma (arrows). Scale bars: A, 20 μm; B, 5 μm.

Similar articles

Cited by

References

    1. Acuna C, Liu X, Südhof TC (2016) How to make an active zone: unexpected universal functional redundancy between RIMs and RIM-BPs. Neuron 91:792–807. 10.1016/j.neuron.2016.07.042 - DOI - PubMed
    1. Arai I, Jonas P (2014) Nanodomain coupling explains Ca2+ independence of transmitter release time course at a fast central synapse. Elife 3. - PMC - PubMed
    1. Bacaj T, Wu D, Yang X, Morishita W, Zhou P, Xu W, Malenka RC, Südhof TC (2013) Synaptotagmin-1 and synaptotagmin-7 trigger synchronous and asynchronous phases of neurotransmitter release. Neuron 80:947–959. 10.1016/j.neuron.2013.10.026 - DOI - PMC - PubMed
    1. Berton F, Iborra C, Boudier JA, Seagar MJ, Marquèze B (1997) Developmental regulation of synaptotagmin I, II, III, and IV mRNAs in the rat CNS. J Neurosci 17:1206–1216. - PMC - PubMed
    1. Bragina L, Fattorini G, Giovedí S, Melone M, Bosco F, Benfenati F, Conti F (2011) Analysis of synaptotagmin, SV2, and Rab3 expression in cortical glutamatergic and GABAergic axon terminals. Front Cell Neurosci 5:32. 10.3389/fncel.2011.00032 - DOI - PMC - PubMed

Publication types