. 2017 Mar 30;8(3):e2723.
doi: 10.1038/cddis.2017.150.

Madecassic acid, the contributor to the anti-colitis effect of madecassoside, enhances the shift of Th17 toward Treg cells via the PPARγ/AMPK/ACC1 pathway

Affiliations

Madecassic acid, the contributor to the anti-colitis effect of madecassoside, enhances the shift of Th17 toward Treg cells via the PPARγ/AMPK/ACC1 pathway

Xiaotian Xu et al. Cell Death Dis. .

Abstract

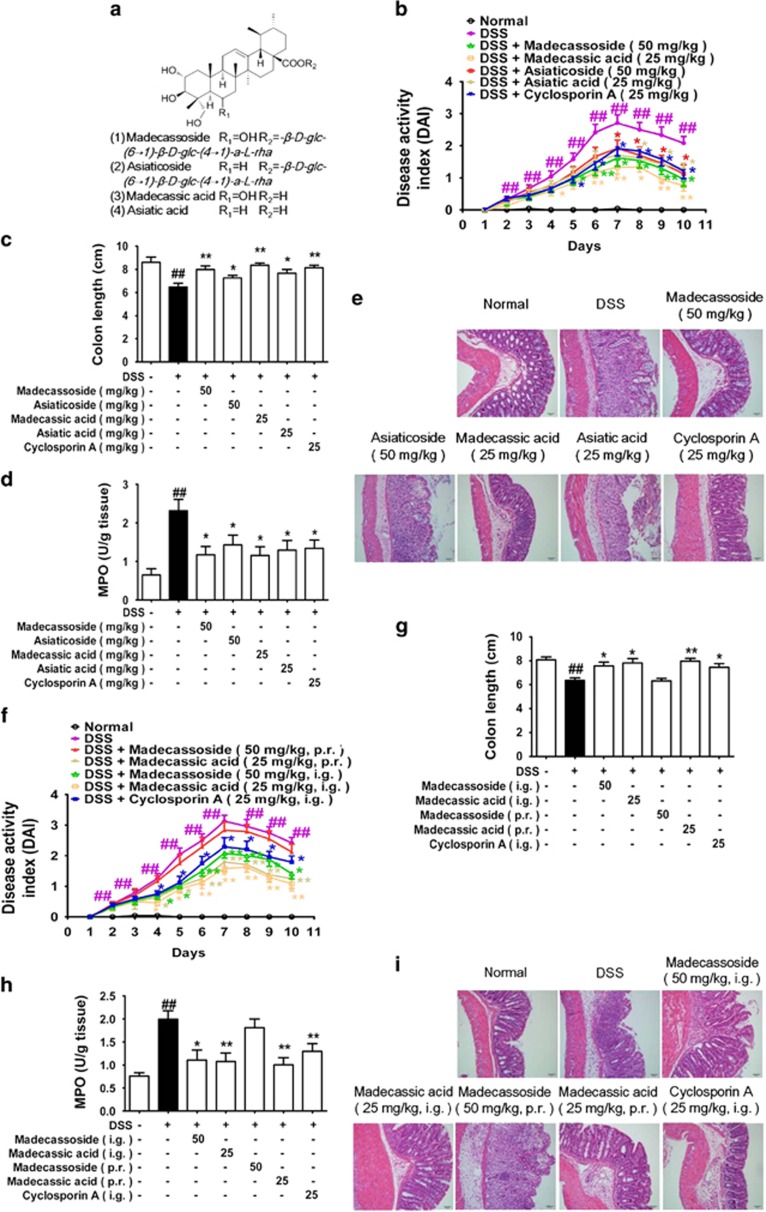
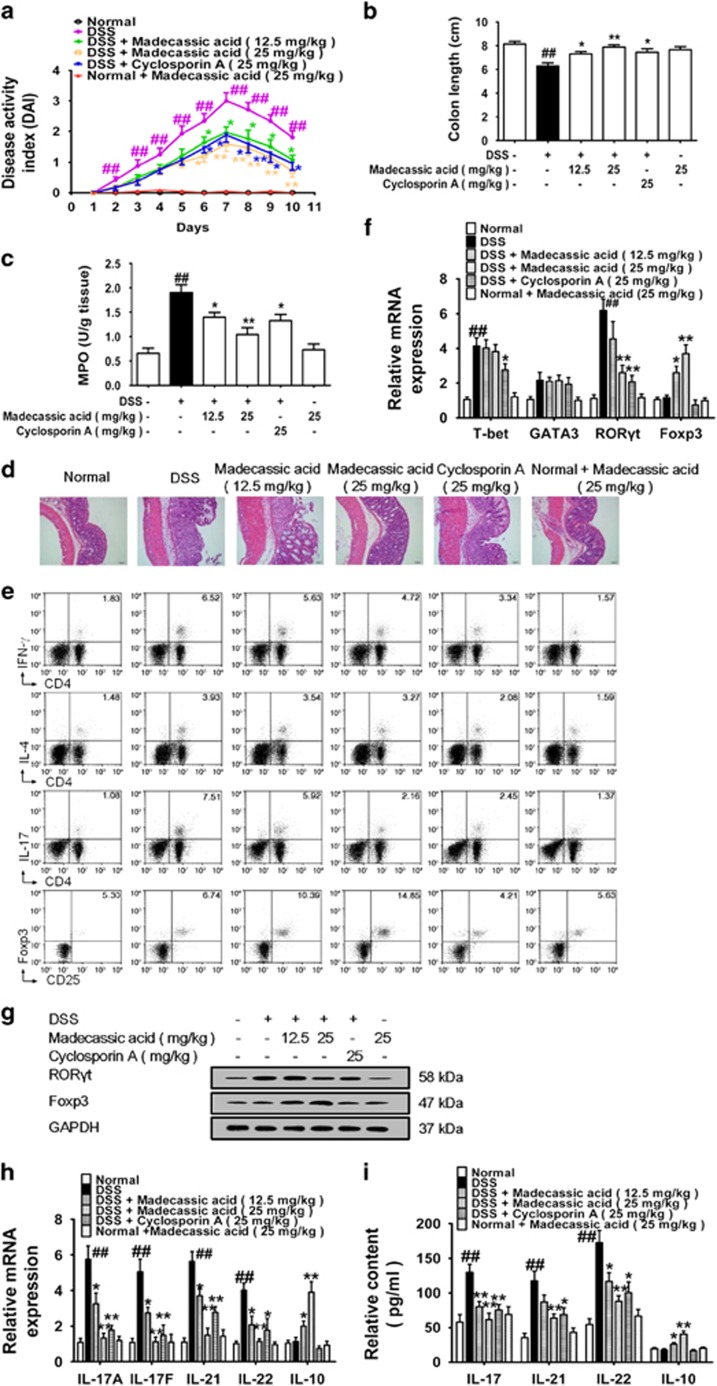
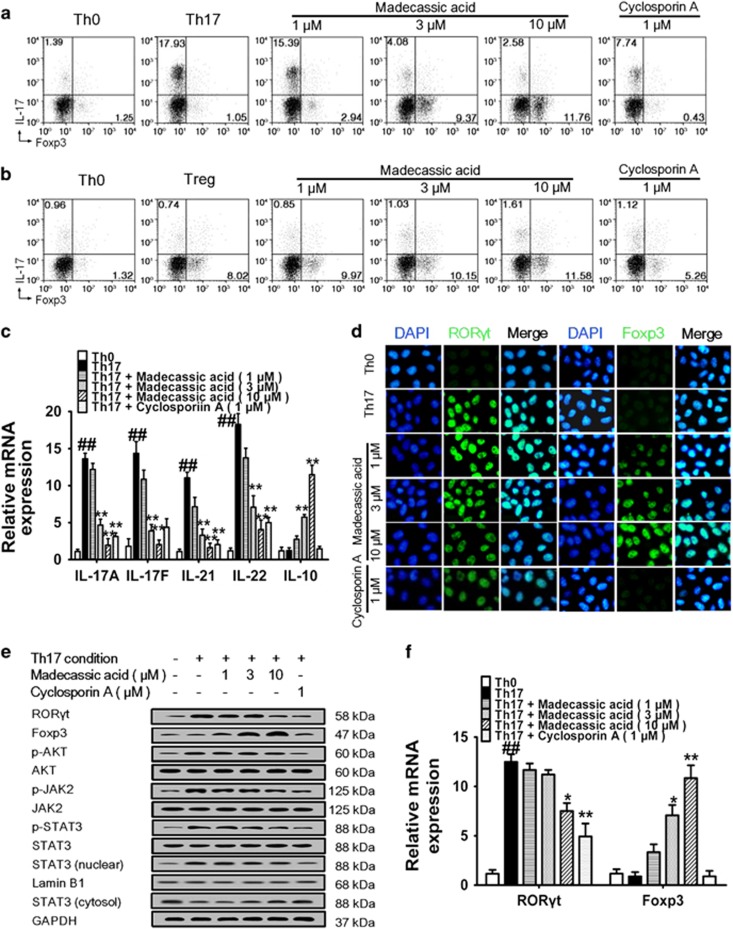
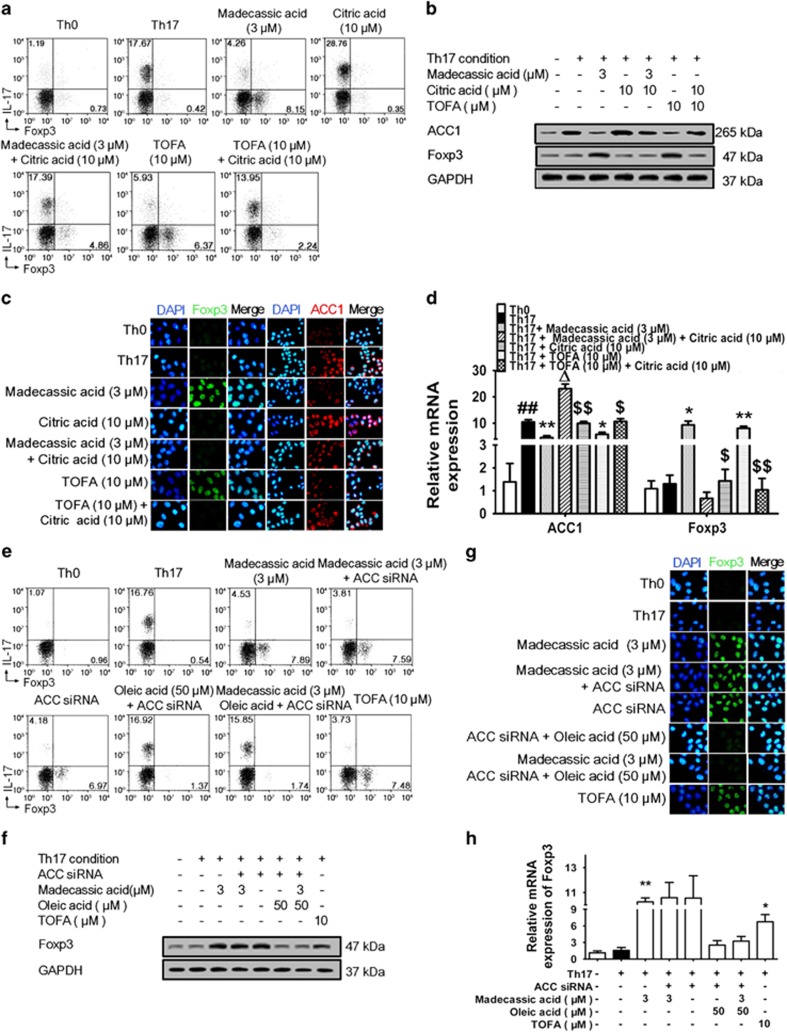
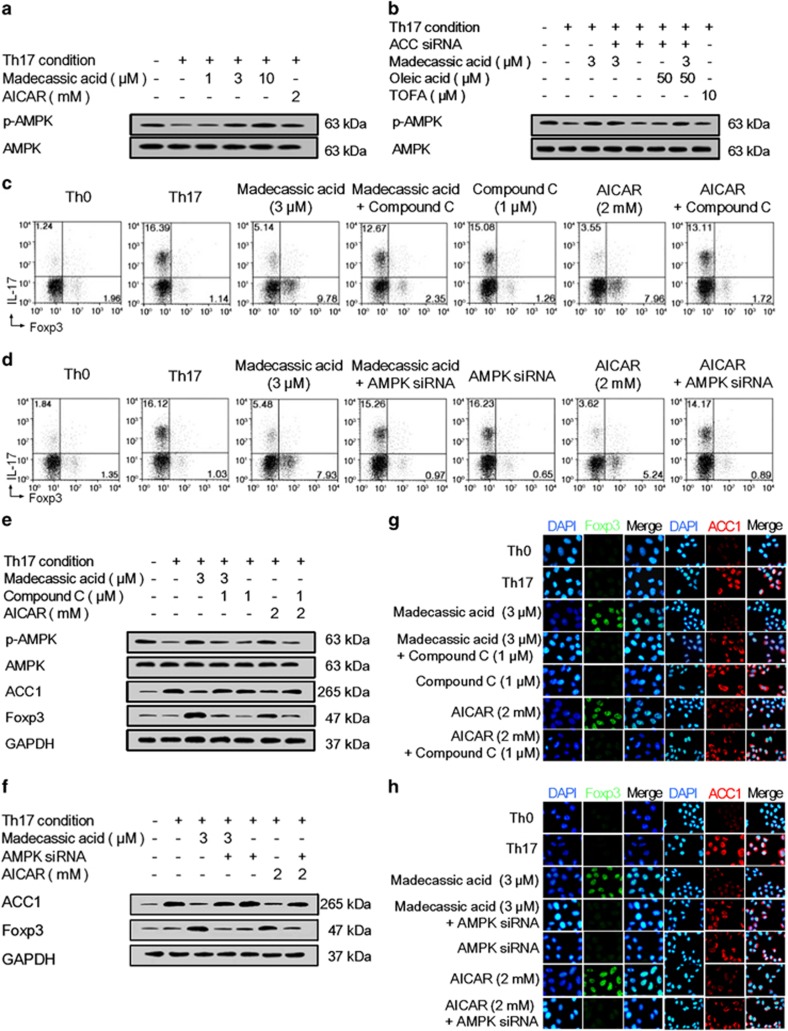
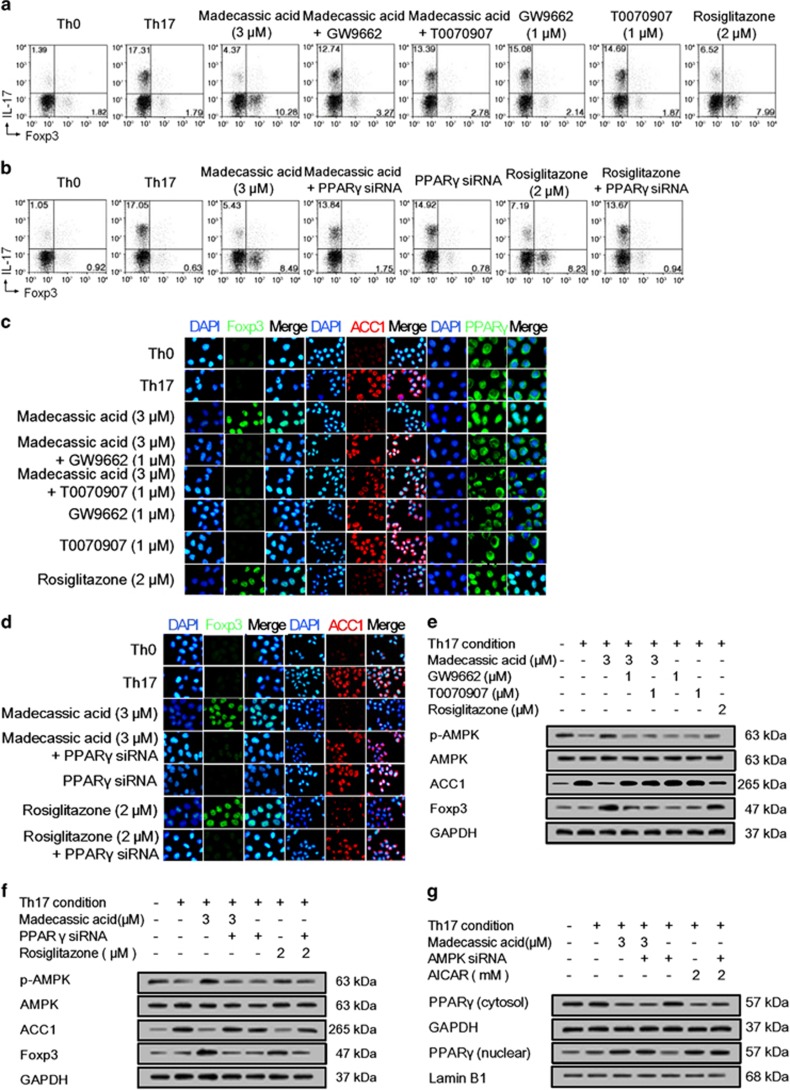
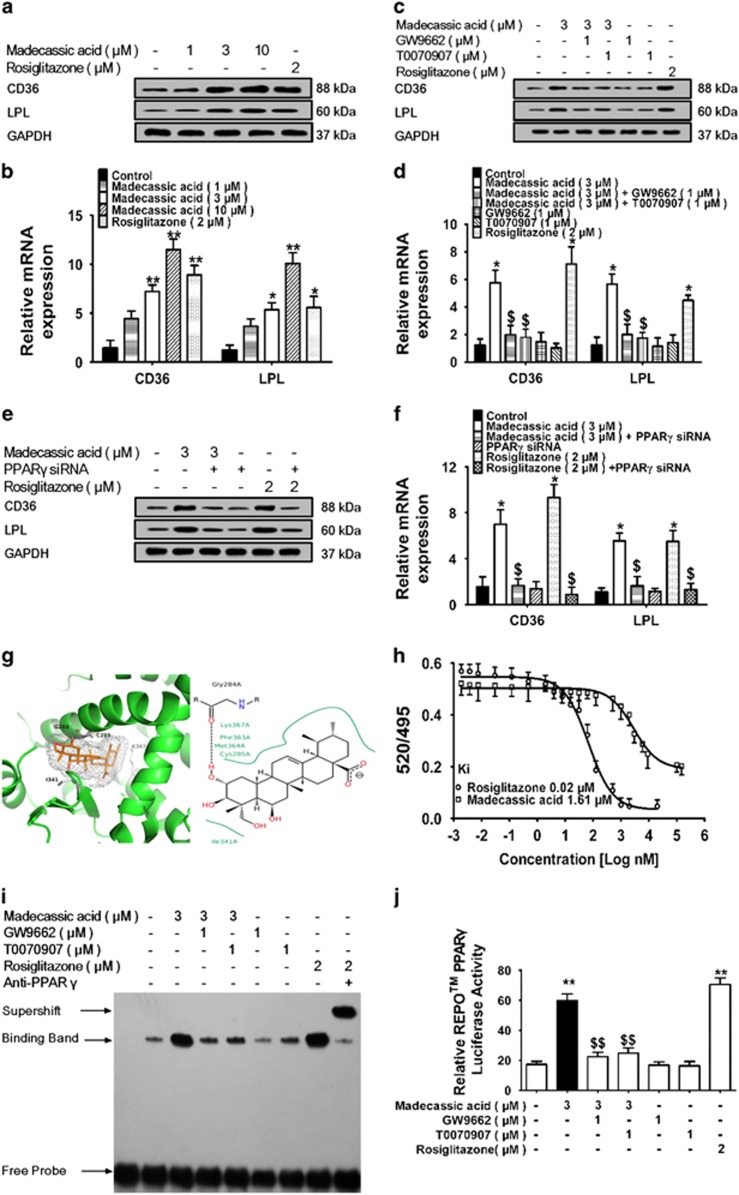
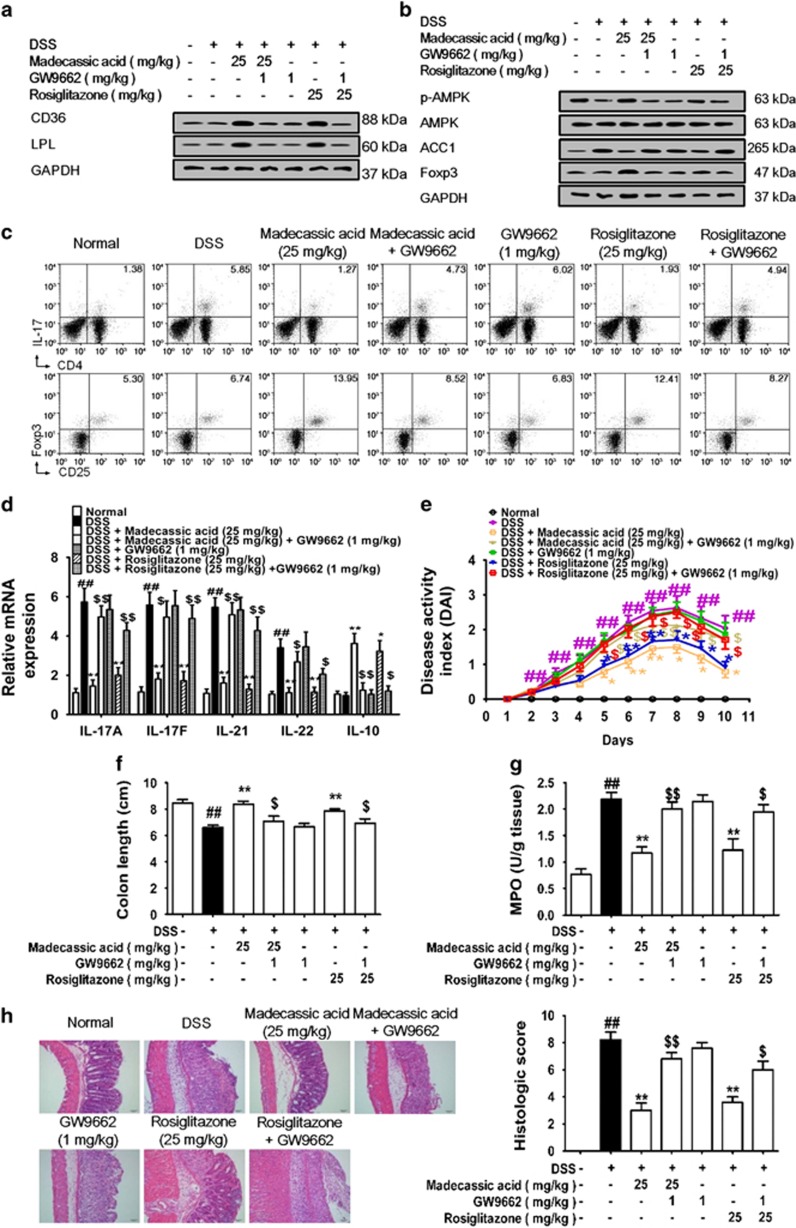
The imbalance between Th17 and Treg cells substantially contributes to the intestinal immune disturbance and subsequent tissue injury in ulcerative colitis. The triterpenoid-rich fraction of Centella asiatica was able to ameliorate dextran sulfate sodium-induced colitis in mice. Here we explored its active ingredient and underlying mechanism with a focus on restoring the Th17/Treg balance. The four main triterpenoids occurring in C. asiatica were shown to attenuate colitis in mice by oral administration. The most effective ingredient madecassoside lost anti-colitis effect when applied topically in the colon, and madecassic acid was recognized to be the active form of madecassoside. Oral administration of madecassic acid decreased the percentage of Th17 cells and downregulated the expression of RORγt, IL-17A, IL-17F, IL-21 and IL-22 and increased the percentage of Treg cells and the expression of Foxp3 and IL-10 in the colons of mice with colitis, but it did not affect Th1 and Th2 cells. Under Th17-polarizing conditions, madecassic acid downregulated ACC1 expression and enhanced the shift of Th17 cells toward Treg cells, but it did not affect the differentiation of Treg cells under Treg-polarizing conditions. Both compound C and AMPK siRNA inhibited the madecassic acid-mediated downregulation of ACC1 expression and shift of Th17 cells to Treg cells under Th17-polarizing conditions. GW9662, T0070907 and PPARγ siRNA blocked the effect of madecassic acid on AMPK activation, ACC1 expression and shift of Th17 cells to Treg cells. Furthermore, madecassic acid was identified as a PPARγ agonist, as it promoted PPARγ transactivation. The correlation between activation of PPARγ and AMPK, downregulation of ACC1 expression, restoration of Th17/Treg balance and attenuation of colitis by madecassic acid was validated in mice with DSS-induced colitis. In conclusion, madecassic acid was the active form of madecassoside in ameliorating colitis by restoring the Th17/Treg balance via regulating the PPARγ/AMPK/ACC1 pathway.


Conflict of interest statement

The authors declare no conflict of interest.

Figures

Figure 1
Figure 1
Madecassic acid was the active form of madecassoside in ameliorating DSS-induced colitis in mice. Mice were fed with 2.5% DSS for 7 days and then given normal water for an additional 3 days. Madecassoside (50 mg/kg), asiaticoside (50 mg/kg), madecassic acid (25 mg/kg), asiatic acid (25 mg/kg) and cyclosporin A (25 mg/kg) were orally administered for consecutive 10 days. (a) Chemical structures of madecassoside, asiaticoside, madecassic acid and asiatic acid. (b) DAI. (c) The colon length of each group at day 10. (d) The activity of MPO in the colons. (e) The epithelial damage, inflammatory cell infiltration and crypt lesions were evaluated by H&E staining. (f) Mice were rectally administered test compounds for 10 days. DAI. (g) Colon length. (h) MPO activity. (i) H&E staining. The data were expressed as means±S.E.M., n=5–8. ##P<0.01 versus normal group; *P<0.05, **P<0.01 versus DSS group
Figure 2
Figure 2
Madecassic acid restored the T helper type 17/regulatory T cell balance in mice with DSS-induced colitis. Mice were fed with 2.5% DSS for 7 days and then given normal water for 3 days. Madecassic acid (12.5, 25 mg/kg) and cyclosporin A (25 mg/kg) were orally administered for 10 days. (a) DAI. (b) Colon length. (c) MPO activity. (d) H&E staining. (e) The proportions of CD4+ IFN-γ+ T cells, CD4+IL-4+ T cells, CD4+IL-17+ T cells and CD4+CD25+Foxp3+ T cells were detected by flow cytometry. (f and g) The mRNA and protein levels of transcription factors T-bet, GATA-3, RORγt and Foxp3 in the colons were evaluated by real-time PCR and western blot. (h and i) The levels of IL-17A, IL-17F, IL-21, IL-22 and IL-10 were assessed by enzyme-linked immunosorbent assay and real-time PCR. GAPDH was used as a cytoplasm marker. The data were expressed as means±S.E.M., n=5–8. ##P<0.01 versus normal group; *P<0.05, **P<0.01 versus DSS group
Figure 3
Figure 3
Madecassic acid restored the T helper type 17/regulatory T cell (Th17/Treg) balance by enhancing the shift of of Th17 toward Treg cells. (a) Naive T cells were differentiated under Th17-inducing conditions for 4 days in the presence of madecassic acid (1, 3, 10 μM) or a control. The proportions of CD4+IL-17+ T cells and CD4+Foxp3+ T cells were gated by flow cytometry. (b) Naive T cells were differentiated under Treg-inducing conditions for 4 days in the presence or absence of madecassic acid (1, 3, 10 μM). The proportions of CD4+IL-17+ T cells and CD4+Foxp3+ T cells were gated by flow cytometry. (c) Naive T cells were cultured with madecassic acid (1, 3, 10 μM) under Th17-inducing conditions for 4 days. The mRNA levels of IL-17A, IL-17F, IL-21, IL-22 and IL-10 were measured by real-time PCR. (d) Naive T cells were cultured with madecassic acid (1, 3, 10 μM) under Th17-inducing conditions for 4 days. The expression of RORγt and Foxp3 under Th17-polarizing conditions was measured by immunofluorescence. (e) Naive T cells were cultured with madecassic acid (1, 3, 10 μM) under Th17-inducing conditions for 4 days. The protein expression of RORγt and Foxp3, as well as Th17-associated transducers p-AKT, AKT, p-STAT3, STAT3, p-JAK2 and JAK was examined by western blot. (f) Naive T cells were cultured with madecassic acid (1, 3, 10 μM) under Th17-inducing conditions for 4 days. The mRNA expression of RORγt and Foxp3 was analyzed by real-time PCR. GAPDH was used as a cytoplasm marker; Lamin B1 was used as a nuclear marker. The data were expressed as means±S.E.M., n=3. #P<0.05, ##P<0.01 versus Th0 group; *P<0.05, **P<0.01 versus Th17 group
Figure 4
Figure 4
Madecassic acid facilitated the shift of T helper type 17 (Th17) toward regulatory T cells by inhibiting ACC1 expression. (a) Naive T cells were cultured with madecassic acid (3 μM) and ACC1 activator citric acid (10 μM) under Th17-inducing conditions for 4 days. The proportions of CD4+IL-17+ T cells and CD4+Foxp3+ T cells were detected by flow cytometry. (bd) Naive T cells were cultured with madecassic acid (3 μM) and ACC1 activator citric acid (10 μM) under Th17-inducing conditions for 4 days. The mRNA and protein expression of Foxp3 and ACC1 was analyzed by western blot, immunofluorescence and real-time PCR. (e) Naive T cells were cultured with madecassic acid (3 μM), oleic acid (50 μM) and ACC1 siRNA under Th17-polarizing conditions for 4 days. The proportions of CD4+IL-17+ T cells and CD4+Foxp3+ T cells were detected by flow cytometry. (fh) Naive T cells were cultured with madecassic acid (3 μM), oleic acid (50 μM) and ACC1 siRNA under Th17-polarizing conditions for 4 days. The relative expression of Foxp3 was analyzed by western blot, immunofluorescence and real-time PCR. GAPDH was used as a cytoplasm marker. The data were expressed as means±S.E.M., n=3. #P<0.05, ##P<0.01 versus Th0 group; *P<0.05, **P<0.01 versus Th17 group; ΔP<0.05 versus Th17 group; $P<0.05, $$P<0.01 versus citric acid group
Figure 5
Figure 5
Madecassic acid regulated ACC1-mediated shift of T helper type 17 (Th17) toward regulatory T cells via the activation of AMPK. Naive T cells were cultured with or without compound C and AMPK siRNA under Th17-inducing conditions in the presence of madecassic acid for 4 days. (a) Naive T cells were treated with madecassic acid (1, 3, 10 μM) under Th17-inducing conditions for 4 days. The protein expression of p-AMPK was analyzed by western blot. (b) Naive T cells were cultured with madecassic acid (3 μM), oleic acid (50 μM) and ACC1 siRNA under Th17-polarizing conditions for 4 days. The protein expression of p-AMPK was measured by western blot. (c and d) Naive T cells were cultured with madecassic acid (3 μM), compound C (1 μM) and AMPK siRNA under Th17-polarizing conditions for 4 days. The proportions of CD4+IL-17+ T cells and CD4+Foxp3+ T cells were evaluated by flow cytometry. (e) Naive T cells were cultured with madecassic acid (3 μM) and compound C (1 μM) under Th17-polarizing conditions for 4 days. The relative expression of p-AMPK, AMPK, ACC1 and Foxp3 was analyzed by western blot. (f) Naive T cells were cultured with madecassic acid (3 μM) and AMPK siRNA under Th17-polarizing conditions for 4 days. The relative expression of ACC1 and Foxp3 was analyzed by western blot. (g) Naive T cells were cultured with madecassic acid (3 μM) and compound C (1 μM) under Th17-polarizing conditions for 4 days. The relative expression of ACC1 and Foxp3 was analyzed by immunofluorescence. (h) Naive T cells were cultured with madecassic acid (3 μM) and AMPK siRNA under Th17-polarizing conditions for 4 days. The relative expression of ACC1 and Foxp3 was analyzed by immunofluorescence. GAPDH was used as a cytoplasm marker. The data were expressed as the means±S.E.M., n=3. #P<0.05, ##P<0.01 versus Th0 group; *P<0.05, **P<0.01 versus Th17 group; $P<0.05, $$P<0.01 versus madecassic acid group
Figure 6
Figure 6
Madecassic acid regulated AMPK/ACC1 via activating PPARγ in the shift of T helper type 17 (Th17) toward regulatory T cells. Naive T cells were treated with GW9662 (1 μM), T0070907 (1 μM) and PPARγ siRNA under Th17-polarizing conditions for 4 days in the presence of madecassic acid (3 μM). (a) Naive T cells were treated d with GW9662 (1 μM) and T0070907 (1 μM) under Th17-polarizing conditions for 4 days in the presence of madecassic acid (3 μM). The proportions of CD4+IL-17+ T cells and CD4+Foxp3+ T cells were evaluated by flow cytometry. (b) Naive T cells were treated with madecassic acid (3 μM) and PPARγ siRNA under Th17-polarizing conditions for 4 days. The proportions of CD4+IL-17+ T cells and CD4+Foxp3+ T cells were evaluated by flow cytometry. (c) The relative expression of PPARγ, ACC1 and Foxp3 was evaluated by immunofluorescence in the presence of madecassic acid (3 μM), GW9662 (1 μM) and T0070907 (1 μM). (d) The relative expression of ACC1 and Foxp3 was evaluated by immunofluorescence in the presence of madecassic acid (3 μM) and PPARγ siRNA. (e) Naive T cells were treated with GW9662 (1 μM) and T0070907 (1 μM) under Th17-polarizing conditions for 4 days in the presence of madecassic acid (3 μM). The relative expression of p-AMPK, ACC1 and Foxp3 was evaluated by western blot. (f) Naive T cells were treated with madecassic acid (3 μM) and PPARγ siRNA under Th17-polarizing conditions for 4 days. The relative expression of p-AMPK, ACC1 and Foxp3 was evaluated by western blot. (g) Naive T cells were treated with madecassic acid (3 μM) and AMPK siRNA under Th17-polarizing conditions for 4 days. The relative expression of cytosolic and nuclear PPARγ was measured by western blot. GAPDH was used as a cytoplasm marker; Lamin B1 was used as a nuclear marker. All data were expressed as means±S.E.M., n=3. #P<0.05, ##P<0.01 versus Th0 group; *P<0.05, **P<0.01 versus Th17 group; $P<0.05, $$P<0.01 versus madecassic acid group
Figure 7
Figure 7
Madecassic acid as a PPARγ agonist. (a and b) EL-4 cells were treated with madecassic acid (1, 3, 10 μM) and rosiglitazone (2 μM) for 24 h. The expression of the PPARγ-responsive genes CD36 and LPL was quantified by western blot and real-time PCR. (c and d) EL-4 cells were treated with madecassic acid (3 μM), GW9662 (1 μM) and T0070907 (1 μM) for 24 h. The expression of CD36 and LPL was measured by western blot and real-time PCR. (e and f) EL-4 cells were treated with madecassic acid (3 μM) and PPARγ siRNA for 24 h. The expression levels of CD36 and LPL were measured by western blot and real-time PCR. (g) The docking between madecassic acid and PPARγ-LBD in EL-4 cells. (h) Binding of madecassic acid to PPARγ-LBD in a competitive TR-FRET assay. (i) The effect of madecassic acid on the nuclear accumulation of PPARγ in EL-4 cells was determined by an EMSA in EL-4 cells. (j) The effect of madecassic acid on PPARγ-dependent transactivation in EL-4 cells was assayed with a luciferase reporter gene assay. GAPDH was used as a cytoplasmic marker. The data were expressed as means±S.E.M., n=3. *P<0.05, **P<0.01 versus control group, $P<0.05, $$P<0.01 versus madecassic acid group
Figure 8
Figure 8
Madecassic acid recovered T helper type 17 (Th17)/regulatory T (Treg) balance in DSS-induced mice colitis through the PPARγ/AMPK/ACC1 pathway. Mice were fed 2.5% DSS for 7 days and then normal water for 3 days. Madecassic acid (25 mg/kg) and rosiglitazone (25 mg/kg) were orally administered for 10 days. GW9662 (1 mg/kg) was administered by an intraperitoneal injection. (a) The expression of CD36 and LPL was analyzed by western blot. (b) The expression of p-AMPK, ACC1 and Foxp3 was detected by western blot. (c) The percentages of Th17 and Treg cells were measured by flow cytometry. (d) The levels of IL-17A, IL-17F, IL-21, IL-22 and IL-10 were assessed by real-time PCR. (e) DAI scores. (f) Colon length. (g) MPO activity. (h) H&E scores. GAPDH was used as a cytoplasm marker. The data were expressed as means±S.E.M., n=5–8. #P<0.05, ##P<0.01 versus normal group; *P<0.05, **P<0.01 versus DSS group $P<0.05, $$P<0.01 versus madecassic acid group

Similar articles

Cited by

References

    1. Conrad K, Roggenbuck D, Laass MW. Diagnosis and classification of ulcerative colitis. Autoimmun Rev 2014; 13: 463–466. - PubMed
    1. Ananthakrishnan AN. Epidemiology and risk factors for IBD. Nat Rev Gastroenterol Hepatol 2015; 12: 205–217. - PubMed
    1. De Souza HS, Fiocchi C. Immunopathogenesis of IBD: current state of the art. Nat Rev Gastroenterol Hepatol 2016; 13: 13–27. - PubMed
    1. Eastaff-Leung N, Mabarrack N, Barbour A, Cummins A, Barry S. Foxp3+ regulatory T cells, Th17 effector cells, and cytokine environment in inflammatory bowel disease. J Clin Immunol 2010; 30: 80–89. - PubMed
    1. Maloy KJ, Powrie F. Intestinal homeostasis and its breakdown in inflammatory bowel disease. Nature 2011; 474: 298–306. - PubMed

Publication types

LinkOut - more resources