. 2017 May 1;216(5):1255-1265.
doi: 10.1083/jcb.201607022. Epub 2017 Mar 28.

Centrosome and spindle assembly checkpoint loss leads to neural apoptosis and reduced brain size

Affiliations

Centrosome and spindle assembly checkpoint loss leads to neural apoptosis and reduced brain size

John S Poulton et al. J Cell Biol. .

Abstract

Accurate mitotic spindle assembly is critical for mitotic fidelity and organismal development. Multiple processes coordinate spindle assembly and chromosome segregation. Two key components are centrosomes and the spindle assembly checkpoint (SAC), and mutations affecting either can cause human microcephaly. In vivo studies in Drosophila melanogaster found that loss of either component alone is well tolerated in the developing brain, in contrast to epithelial tissues of the imaginal discs. In this study, we reveal that one reason for that tolerance is the compensatory relationship between centrosomes and the SAC. In the absence of both centrosomes and the SAC, brain cells, including neural stem cells, experience massive errors in mitosis, leading to increased cell death, which reduces the neural progenitor pool and severely disrupts brain development. However, our data also demonstrate that neural cells are much more tolerant of aneuploidy than epithelial cells. Our data provide novel insights into the mechanisms by which different tissues manage genome stability and parallels with human microcephaly.


Figures

Figure 1.
Figure 1.
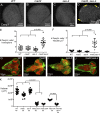
Centrosomes and the SAC cooperate to promote neural stem cell viability and brain size. (A–D) Apoptosis (cleaved Casp3) was not observed in WT (A), mad2 (B), or sas-4 single mutant brains (C), but mad2 sas-4 double mutants displayed increased apoptosis (D). Arrows indicate apoptotic cells. (E and F) Samples were quantified per brain hemisphere (E) or standardized to brain size (F). (G–J) Third instar brains of indicated genotypes stained for actin (red) and α-tubulin (green). Note the smaller brains in mad2 sas-4 double mutants as well as reduced optic lobes (see Fig. 2). (K) Brain size quantification. Both mad2 sas-4 and mad1/Df;sas-4 double mutant brains were significantly smaller than WT or the respective single mutants. mad2 and mad1 single mutant brains were also slightly smaller than WT or sas-4 brains. Error bars represent means ± SD.
Figure 2.
Figure 2.
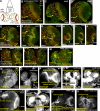
Loss of centrosomes and the SAC dramatically alters brain architecture. (A) Diagram of the third instar brain. Each hemisphere has an optic lobe and CB region containing many NBs (green and red circles). NBs expressed Dpn (green) and Mira (red). (B–M) WT, single, and double mutant brains stained for Dpn and Mira. (B–G) The horseshoe-shaped stripe of medulla NBs in WT (B and E) was also present in single mutants (C, D, F, and G), as was a normal lamina (H vs. I and J). Both were absent in mad2 sas-4 (K–M), though residual medullar NBs may have remained. WT and single mutant CB NB populations were similar (B–G, yellow arrows). In double mutants, some seemingly normal CB NBs remained (K–M, yellow arrows), though others were very enlarged (K–M, blue arrows). (N–T) WT and double mutants labeled with F-actin (phalloidin). F-actin labeling also revealed substantial medulla reduction and retention of CB NBs in double mutants (N vs. O) as well as reduction/disorganization of medullar axons and the medullar neuropil (P and S vs. Q, R, and T), though some neuroepithelial cells remained in double mutants (Q and T). (U and V) WT and double mutant brains labeled with FasII. Double mutants retained a mushroom body and commissural axons but lacked incoming axons from eye disc photoreceptors. IPC, inner proliferative center.
Figure 3.
Figure 3.
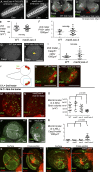
Cell death caused by centrosome/SAC loss reduces the neural progenitor pool. (A) Diagram of the third instar brain indicating optic lobes and central brain, as well as the locations of medullary and central brain NBs. (B and C) Double mutant brains possessed significantly fewer NBs per hemisphere (B) or when corrected for smaller brain size (C). (D) Casp3 (green) and the NB marker Dpn (red) indicate that some apoptotic cells were NBs. The arrows in D–D′′ highlight a cell that stained positive for both Casp3 and Dpn. D′ shows the Casp channel only, revealing dying cells; D′′ shows the Dpn channel only, marking NBs. (E) p35 (green) was not expressed in WT brains. Ecad outlines brain morphology. (F) Misexpressing p35 by 1407-Gal4 drove robust p35 expression, particularly in NBs. E and F are maximum-intensity projections. (G) Expressing p35 in mad2 sas-4 increased brain size. Error bars represent means ± SD.
Figure 4.
Figure 4.
Centrosome/SAC loss reduces NB proliferation, but asymmetric division still occurs. (A–E) Mitotic marker PH3. There were significantly fewer dividing cells in mad2 sas-4 brains, quantified in E. Error bars represent means ± SD. (F) A single CB NB (Dpn+, green) generated several adjacent progeny (Pros+, red). (G and H) Examples of CB NBs (green) and adjacent progeny (red) in WT and m­­ad2 sas-4, indicated by the dashed circles. (I) Still images from Video 3 of mad2 sas-4 expressing Moe:GFP and the chromatin marker His:RFP. Arrows indicate mitotic CB NBs undergoing asymmetric division to maintain the NB (I’) and to produce a smaller daughter bound for differentiation (I’’).
Figure 5.
Figure 5.
Significant defects in cell behavior and brain development begin at third instar when mitotic rates increase. (A and B) Central nervous system (CNS), late-stage WT, and mad2 sas-4 embryos. Elav marks neurons. (C and D) Little mitosis (PH3+, green) occurred in second instar WT or mad2 sas-4 brains. The OOA (identified by Ecad expression) was present in both genotypes. (E and F) Brain size (E) and mitotic index (F) at second instar were not altered in mad2 sas-4. (G–I) Apoptosis was not increased in second instar mad2 sas-4 brains. The arrow in H indicates apoptotic cells. (J) Diagram of a few NBs in second instar brains (Dpn+, green) that had already produced clusters of progeny (Pros+, red). (K and L) WT and mad2 sas-4 NBs and their progeny. (M–O) By mid–third instar, WT and single mutant brains exhibited significant proliferation (PH3+; M) and brain size increases (O). In contrast, mad2 sas-4 brains began to display reduced size (O) and less proliferation (N). (P–R) mad2 sas-4 brains exhibited subtle but significant increases in apoptosis (Casp3, green) at mid–third instar. Arrow in Q marks an apoptotic cell. Error bars represent means ± SD. (S) In WT mid–third instar brains, the OOA grew significantly and the medulla emerged (epithelial architecture marked by Ecad, green). (T) The OOA/medulla in mad2­ sas-4 brain also enlarged in mid–third instar but was smaller than WT and lacked normal architecture. S’ and T’ depict cross-sectional views through the OOA/medulla.
Figure 6.
Figure 6.
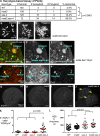
Loss of centrosomes and the SAC dramatically perturbs genome stability. (A–D) Karyotype assay. Loss of centrosomes or SAC alone did not dramatically disrupt the accuracy of chromosome segregation, but loss of both elevated aneuploidy and polyploidy. (B–D) Representative euploid or aneuploid/polyploid karyotypes. (E) In mad2 sas-4 brains, some CB NBs (Dpn+, green; Mira+, red) were normal sized (presumptive diploid or mildly aneuploid), whereas others were abnormally large (presumptive polyploid). E’ shows the Mira channel only, representing the cytoplasmic area of NBs; E’’ shows the Dpn channel only, showing labeling of NB nuclei. (F) Some abnormally large presumed polyploid cells in mad2­ sas-4 brains appeared to be in mitosis (arrows; PH3+, green; nuclei labeled by His:RFP); a normal-sized mitotic cell is also visible. F’ shows the His:RFP channel marking all nuclei; F’’ shows how PH3 staining labels on mitotic cells. (G–K) WT and single mutants did not display high levels of γ-H2Av, whereas mad2 sas-4 brains contained γ-H2Av+ cells. Arrows in J label cells with high levels of DNA damage. (L) sas-4 single mutant and mad2 sas-4 double mutants prolonged the time from NEB to anaphase. Error bars represent means ± SD.

Similar articles

Cited by

References

    1. Basto R., Lau J., Vinogradova T., Gardiol A., Woods C.G., Khodjakov A., and Raff J.W.. 2006. Flies without centrioles. Cell. 125:1375–1386. 10.1016/j.cell.2006.05.025 - DOI - PubMed
    1. Bertet C., Li X., Erclik T., Cavey M., Wells B., and Desplan C.. 2014. Temporal patterning of neuroblasts controls Notch-mediated cell survival through regulation of Hid or Reaper. Cell. 158:1173–1186. 10.1016/j.cell.2014.07.045 - DOI - PMC - PubMed
    1. Betschinger J., Mechtler K., and Knoblich J.A.. 2006. Asymmetric segregation of the tumor suppressor brat regulates self-renewal in Drosophila neural stem cells. Cell. 124:1241–1253. 10.1016/j.cell.2006.01.038 - DOI - PubMed
    1. Blachon S., Gopalakrishnan J., Omori Y., Polyanovsky A., Church A., Nicastro D., Malicki J., and Avidor-Reiss T.. 2008. Drosophila asterless and vertebrate Cep152 are orthologs essential for centriole duplication. Genetics. 180:2081–2094. 10.1534/genetics.108.095141 - DOI - PMC - PubMed
    1. Buffin E., Lefebvre C., Huang J., Gagou M.E., and Karess R.E.. 2005. Recruitment of Mad2 to the kinetochore requires the Rod/Zw10 complex. Curr. Biol. 15:856–861. 10.1016/j.cub.2005.03.052 - DOI - PubMed

Publication types

LinkOut - more resources