. 2017 Mar 28;12(3):e0174326.
doi: 10.1371/journal.pone.0174326. eCollection 2017.

Role of p63 and p73 isoforms on the cell death in patients with hepatocellular carcinoma submitted to orthotopic liver transplantation

Affiliations

Role of p63 and p73 isoforms on the cell death in patients with hepatocellular carcinoma submitted to orthotopic liver transplantation

Raúl González et al. PLoS One. .

Abstract

Background & aims: Patients with hepatocellular carcinoma (HCC) submitted to orthotopic liver transplantation (OLT) have a variable 5-year survival rate limited mostly by tumor recurrence. The etiology, age, sex, alcohol, Child-Pugh, and the immunesuppressor have been associated with tumour recurrence. The expression of ΔNp73 is related to the reduced survival of patients with HCC. The study evaluated the expression of p63 and p73 isoforms and cell death receptors, and their relation to tumour recurrence and survival. The results were in vitro validated in HCC cell lines.

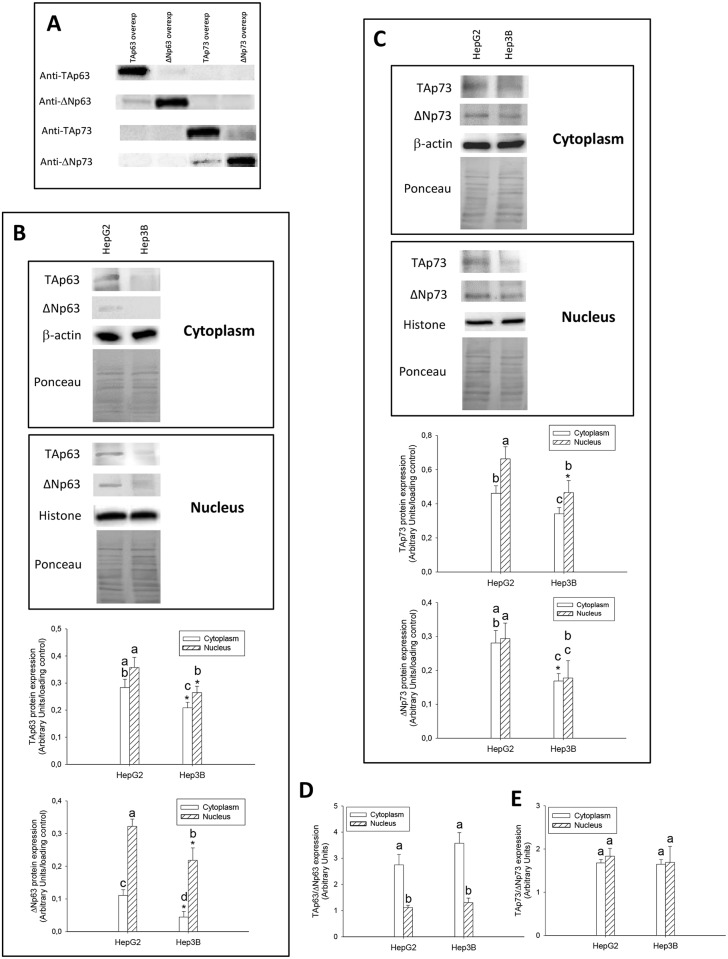
Methods: HCC sections from patients submitted to OLT were used. The in vitro study was done in differentiated hepatitis B virus (HBV)-expressing Hep3B and control HepG2 cells. The expression of cell death receptors and cFLIPS/L, caspase-8 and -3 activities, and cell proliferation were determined in control and p63 and p73 overexpressing HCC cells.

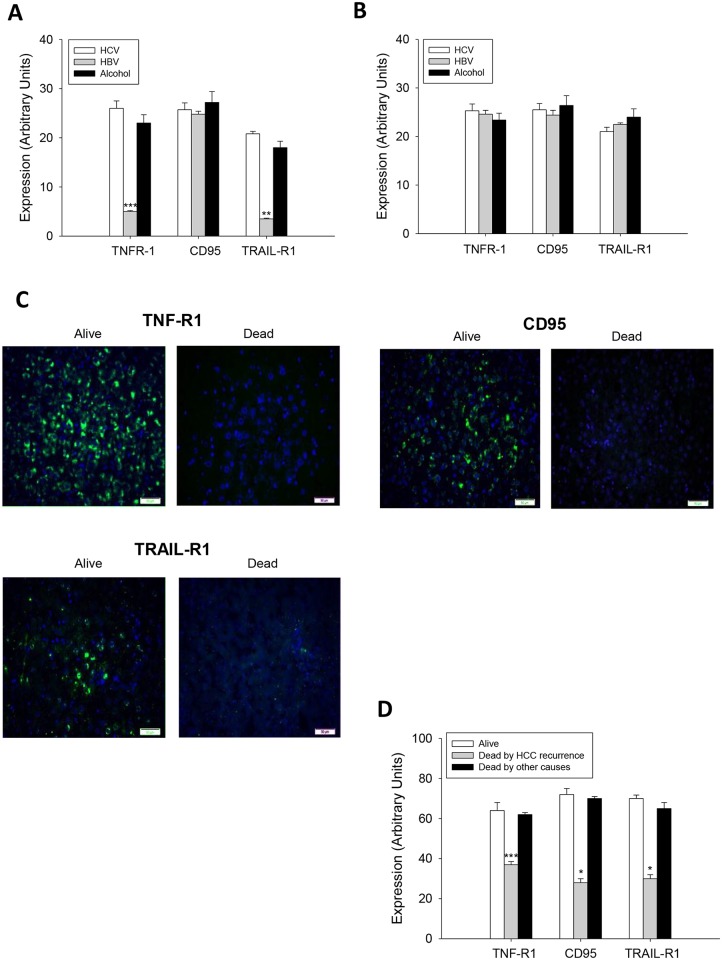
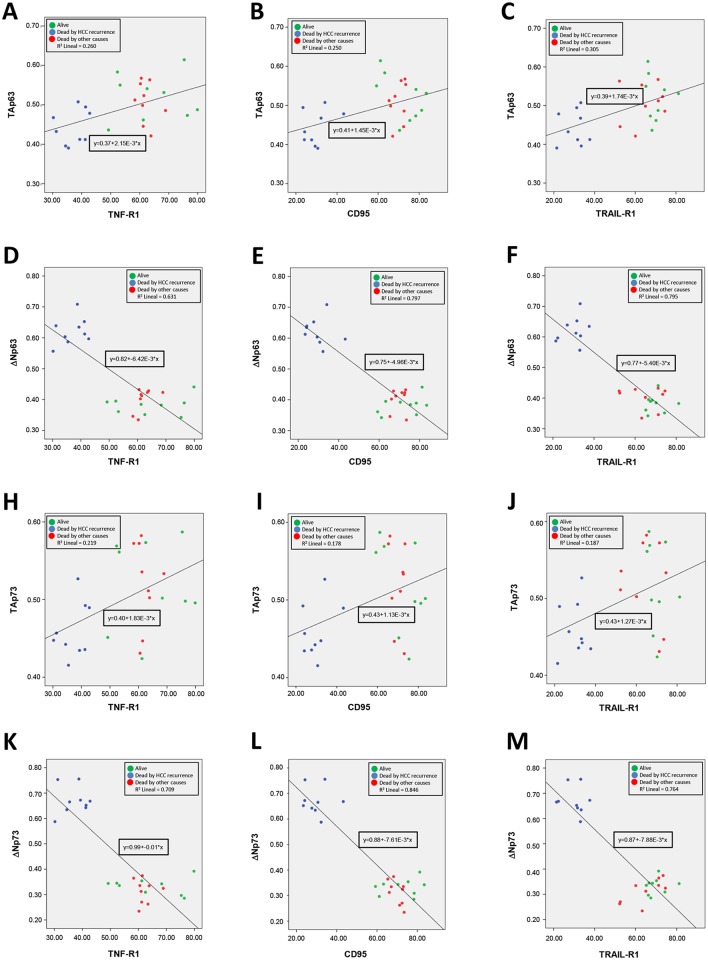
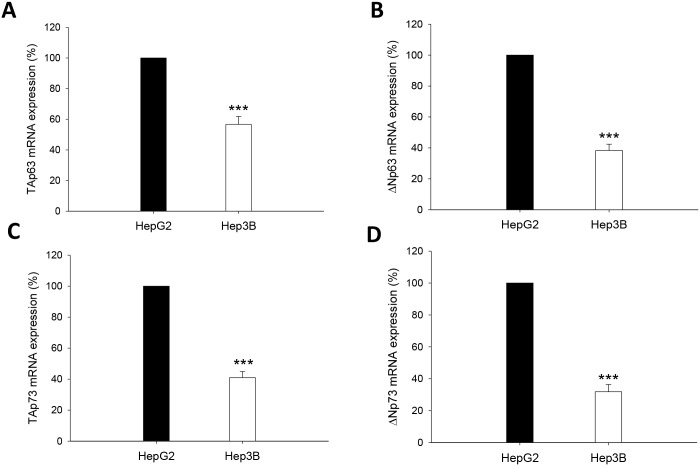
Results: The reduced tumor expression of cell death receptors and TAp63 and TAp73, and increased ΔNp63 and ΔNp73 expression were associated with tumor recurrence and reduced survival. The in vitro study demonstrated that HBV-expressing Hep3B vs HepG2 cells showed reduced expression of p63 and p73, cell death receptors and caspase activation, and increased cFLIPL/cFLIPS ratio. The overexpression of TAp63 and TAp73 exerted a more potent pro-apoptotic and anti-proliferative effects in Hep3B than HepG2-transfected cells which was related to cFLIPL upregulation.

Conclusions: The reduction of TAp63 and TAp73 isoforms, rather than alteration of ΔN isoform expression, exerted a significant functional repercussion on cell death and proliferation in HBV-expressing HepB cells.


Conflict of interest statement

Competing Interests: The authors have declared that no competing interests exist.

Figures

Fig 1
Fig 1. TAp63, ΔNp63, TAp73 and ΔNp73 expression in well-differentiated (A) and moderately-poorly differentiated HCC (B) in patients subject to OLT, and their correlation to survival or death as a consequence of tumor recurrence or other causes such as pneumonia, fungal sepsis, heart complications and septic shock (C).
The protein expression of p53 gene family members was assessed by immunohistochemistry following the procedure described in Material and Methods. Data are expressed as mean ± SEM of the densitometry analysis. The asterisks indicate statistical significance (*p≤0.05, **p≤0.01 or ***p≤0.001) compared with their corresponding control. The images are representative of the corresponding group. Image magnification x10.
Fig 2
Fig 2. TNF-R1, CD95 and TRAIL-R1 expression in well-differentiated (A) and moderately-poorly differentiated HCC (B) in patients subject to OLT, and their correlation to survival or death as a consequence of tumor recurrence or other causes such as pneumonia, fungal sepsis, heart complications and septic shock (C).
The protein expression of cell death receptors was assessed by immunohistochemistry following the procedure described in Material and Methods. Data are expressed as mean ± SEM of the densitometry analysis. The asterisks indicate statistical significance (*p≤0.05, **p≤0.01 or ***p≤0.001) compared with their corresponding control. The images are representative of the corresponding group. Image magnification x10.
Fig 3
Fig 3. Distribution of all pairwise variables and the corresponding linear equations in the three-studied populations (alive, dead by HCC recurrence and dead by other causes).
The values of R2 lineal of the linear equation were superior between ΔN isoforms and cell death receptors (Fig 3D-3F and 3K-3M) that those between ΔN isoforms and cell death receptors (Fig 3A-3C and 3H-3J).
Fig 4
Fig 4. TAp63 and ΔNp63 (B), TAp73 and ΔNp73 (C) protein expression in cytoplasm and nuclear fractions, and their corresponding TAp63/ΔNp63 (D) and TAp73/ΔNp73 (E) protein ratio obtained from HepG2 and Hep3B cells.
The specificity of antibodies against the different TA and ΔN p63 and p73 isoforms was assessed by western-blot analysis in transfected HepG2 using TA and ΔN p63 and p73 overexpressing plasmids (A). The protein expression was assessed by western-blot analysis following the procedure described in Material and Methods. Data are expressed as mean ± SEM of the densitometry analysis referred to the corresponding loading control (β-actin and histone H3 in cytoplasm and nuclear fractions, respectively). The ponceau staining is also included (B and C). The asterisks indicate statistical significance compared with their corresponding control group (HepG2) (*p≤0.05). The groups with different letter (a, b, c or d) were significantly different among them (p≤0.05).
Fig 5
Fig 5. TAp63 (A), ΔNp63 (B), TAp73 (C) and ΔNp73 (D) mRNA expression from HepG2 and Hep3B cells.
The mRNA expression of p53 gene family members was assessed by RT-PCR analysis following the procedure described in Material and Methods. The primers used for TAp63α, ΔNp63α, TAp73α, ΔNp73α and β-actin are detailed (E). Data are expressed as mean ± SEM referred to the corresponding constitutive control (β-actin). The asterisks indicate statistical significance compared with their corresponding group (HepG2) (***p≤0.001).
Fig 6
Fig 6. TNF-R1 (A), CD95 (B) and TRAIL-R1 (C) expression obtained from HepG2 and Hep3B.
The protein expression of cell death receptors was assessed by western-blot analysis following the procedure described in Material and Methods. Data are expressed as mean ± SEM of the densitometry analysis referred to the corresponding loading control (β-actin). The asterisks indicate statistical significance compared with their corresponding group (HepG2) (***p≤0.001).
Fig 7
Fig 7. TNF-R1 (A), CD95 (B) and TRAIL-R1 (C) expression, caspase-8 (D) and caspase-3 (E) activities and cell proliferation (F) in transfected HepG2 and Hep3B cells with TAp63α, ΔNp63α, TAp73α and ΔNp73α overexpressing plasmids.
The parameters were assessed 48 hours after cell transfections. The protein expression of cell death receptors was assessed by western-blot analysis following the procedure described in Material and Methods. Caspase-8 and -3 activities were determined using commercial assays described in Material and Methods. Cell proliferation was determined by BrdU incorporation administered 2 hours before cell collection following the procedure described in Material and Methods. Data are expressed as mean ± SEM either from the densitometry analysis of blots referred to the corresponding loading control (stain-free procedure) or to caspase activity referred to a calibration curve developed using recombinant purified enzyme. The asterisks indicate statistical significance (*p≤0.05, **p≤0.01 or ***p≤0.001) compared with their corresponding empty vector transfected cell line. The groups denoted by different letters (a, b, c or d) are significantly different among them (p≤0.05).
Fig 8
Fig 8. cFLIPL and cFLIPS expression in transfected HepG2 and Hep3B cells with TAp63α, ΔNp63α, TAp73α and ΔNp73α overexpressing plasmids.
The protein expression of cFLIP was assessed by western-blot analysis following the procedure described in Material and Methods. Data are expressed as mean ± SEM either from the densitometry analysis referred to the value of stain-free procedure. The asterisks indicate statistical significance (**p≤0.01 or ***p≤0.001) compared with their corresponding empty vector transfected cell line. The groups denoted by different letters (a, b, c or d) are significantly different among them (p≤0.05).

Similar articles

Cited by

References

    1. El-Serag HB, Rudolph KL. Hepatocellular carcinoma: epidemiology and molecular carcinogenesis. Gastroenterology. 2007;132(7):2557–76. Epub 2007/06/16. 10.1053/j.gastro.2007.04.061 - DOI - PubMed
    1. Siegel R, Naishadham D, Jemal A. Cancer statistics, 2013. CA: a cancer journal for clinicians. 2013;63(1):11–30. - PubMed
    1. Llovet JM, Schwartz M, Mazzaferro V. Resection and liver transplantation for hepatocellular carcinoma. Semin Liver Dis. 2005;25(2):181–200. Epub 2005/05/27. 10.1055/s-2005-871198 - DOI - PubMed
    1. Hoshida Y, Nijman SM, Kobayashi M, Chan JA, Brunet JP, Chiang DY, et al. Integrative transcriptome analysis reveals common molecular subclasses of human hepatocellular carcinoma. Cancer research. 2009;69(18):7385–92. Epub 2009/09/03. 10.1158/0008-5472.CAN-09-1089 - DOI - PMC - PubMed
    1. Minguez B, Lachenmayer A. Diagnostic and prognostic molecular markers in hepatocellular carcinoma. Dis Markers. 2011;31(3):181–90. 10.3233/DMA-2011-0841 - DOI - PMC - PubMed

MeSH terms

Grants and funding

Instituto de Salud Carlos III (PI13/00021), Consejería de Economía, Innovación, Ciencia y Empleo (CTS-6264) and Consejería de Salud (PI13/00025). CIBERehd founded by Instituto de Salud Carlos III and co-financed by European Development Regional Fund "A way to achieve Europe" ERDF for their support. The funders had no role in study design, data collection and analysis, decision to publish, or preparation of the manuscript.