. 2017 Mar 28;15(3):e2000698.
doi: 10.1371/journal.pbio.2000698. eCollection 2017 Mar.

Pharmacogenomic identification of small molecules for lineage specific manipulation of subventricular zone germinal activity

Affiliations

Pharmacogenomic identification of small molecules for lineage specific manipulation of subventricular zone germinal activity

Kasum Azim et al. PLoS Biol. .

Abstract

Strategies for promoting neural regeneration are hindered by the difficulty of manipulating desired neural fates in the brain without complex genetic methods. The subventricular zone (SVZ) is the largest germinal zone of the forebrain and is responsible for the lifelong generation of interneuron subtypes and oligodendrocytes. Here, we have performed a bioinformatics analysis of the transcriptome of dorsal and lateral SVZ in early postnatal mice, including neural stem cells (NSCs) and their immediate progenies, which generate distinct neural lineages. We identified multiple signaling pathways that trigger distinct downstream transcriptional networks to regulate the diversity of neural cells originating from the SVZ. Next, we used a novel in silico genomic analysis, searchable platform-independent expression database/connectivity map (SPIED/CMAP), to generate a catalogue of small molecules that can be used to manipulate SVZ microdomain-specific lineages. Finally, we demonstrate that compounds identified in this analysis promote the generation of specific cell lineages from NSCs in vivo, during postnatal life and adulthood, as well as in regenerative contexts. This study unravels new strategies for using small bioactive molecules to direct germinal activity in the SVZ, which has therapeutic potential in neurodegenerative diseases.


Conflict of interest statement

The authors have declared that no competing interests exist.

Figures

Fig 1
Fig 1. Spatial expression profiles of secreted signaling factors in subventricular zone (SVZ) microdomains.
(A, B) Significantly filtered genes in each region-derived sample were analyzed on GeneGo Metacore for process networks and ranked numerically according to their false discovery rate (FDR) significance (<1%). NB: process networks categories were shortened to fit. (C, D) Heatmaps of genes generic and stable within microdomains across the varied time points are plotted, including those common in isolated neural stem cells (NSCs)/transient amplifying progenitors (TAPs) (D). (E-G) Heatmaps of genes enriched in region-specific microdomains (generally stable temporal expression) versus the adjacent microdomain and NSCs/TAPs. The same was performed for region specific NSCs/TAPs (F, H). Note: the overlapping expression profiles for region-specific NSCs with TAPs. dNSCs, dorsal NSCs; dTAPs, dorsal TAPs; dSVZ, dorsal SVZ; lNSCs, lateral NSCs; lTAPs, lateral TAPs; lSVZ, lateral SVZ.
Fig 2
Fig 2. Connectivity map (CMAP) identification of perturbagens that promote region-specific subventricular zone (SVZ) signatures, oligodendrogenesis, and reactivation of adult neural stem cells (NSCs).
(A) Schematic representation of the experimental flow. Microarray datasets were compared for obtaining expression signatures (detailed in Materials and Methods) and uploaded onto searchable platform-independent expression database (SPIED) to interrogate the CMAP for obtaining a list of perturbagens. These were further inspected for their known protein targets, categorized and presented in the figure as pie charts (ordered clockwise following their ranking order). Note that small molecules related to distinct top-ranked categories are observed in the different analysis. Genes enriched in (B) dNSCs/dTAPs compared to other early postnatal datasets (i.e., dorsalization); (C) lNSCs/lTAPs compared to other early postnatal datasets (i.e., ventralization); (D) oligodendrocyte (OL) lineage cells compared to dNSCs and dTAPs; (E) Postnatal NSCs compared to adult NSCs. dNSCs, dorsal NSCs; dTAPs, dorsal TAPs; lNSCs, lateral NSCs; lTAPs, lateral TAPs.
Fig 3
Fig 3. Connectivity map (CMAP) pathway and network analysis for LY-294002 target genes.
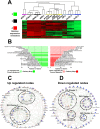
Gene list generated to obtain the drug profiles for LY-294002 (S5 Table) was utilized to compile the CMAP “LY-294002 target-gene” list, and genes prospectively up-regulated are presented as a heatmap in (A) showing enrichment in later oligodendrocyte (OL) lineage cells and down-regulation in dorsal neural stem cells (NSCs) or transient amplifying progenitors (TAPs). aEPs, adult ependymas; aNPs, adult neuronal precursors (NPs); GM, grey matter; astros, astrocytes; imOLs, immature OLs; mOLs, mature/myelinating OLs. (B) Prospectively up-regulated or down-regulated genes analyzed by Genego Metacore for GO Pathway Maps and Process Networks, and lists are ranked according to significance (false discovery rate [FDR] <2%)/numbers of genes present in each of the categories. (C, D) Short path network to visualize highly connected signaling-to-transcriptional nodes were performed for up- and down-regulated by LY-294002 target genes. Internal clusters were grouped by selecting the “link GO objects” in GeneGo Metacore. Highlighted blue objects are directly within data and the remaining are within the background (or basal) data.
Fig 4
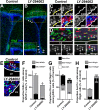
Fig 4. LY-294002 promotes dorsal subventricular zone (dSVZ)-oligodendrogenesis.
Pups were treated for 3 days with LY-294002 or saline/DMSO and examined by immunolabeling. (A, B) Periventricular sections show greater Olig2 immunostaining in LY-294002 in more dorsal periventricular regions compared to controls, illustrated in expanded insets. In the lateral SVZ, LY-294002 reduced Olig2 expression, as indicated by arrows (B). Arrowheads in (B) show reduced nuclei density in the dorsolateral horn of the SVZ where neuronal precursors (NPs) migrate. Scale bar in (A) = 200 μm. (C) Arrowheads show a loss of EdU in GFAP+ cells directly facing the lateral wall in LY-294002 compared to controls. Arrows show examples GFAP+ cells that have not incorporated EdU that were increased following LY-294002. (D) Single plane confocal micrographs show greater EdU+\Olig2 colocalization in LY-294002 and single panel captions of single planes illustrate that most newly generated Olig2+ cells co-express EdU and Ascl1 (arrows) or have absent or lower levels of Ascl1 (arrowheads). Scale bar in (D) = 10 μm in captions of (D), 15 μm in main panels of (D), 15 μm in (C), and 10 μm in (D). (E) Confocal micrographs illustrate a lower density of Dcx+ cells in LY-294002 and a loss of their proliferative status (compare Dcx+ cells with arrowheads to those marked by arrows). (F-H) Quantification of changes in GFAP+/EDU+ or EdU- cells directly facing the wall of the lateral ventricle (F). Quantification of changes in EdU+ cells expressing progenitor markers (Dcx, Olig2, or none of these markers [NP-]) (G). Quantification of changes in Olig2+/Ascl1+ or Ascl1- cells (H). Data are mean ± standard error of the mean (SEM) normalized to controls (n = 5 for control and LY-294004 for all quantifications); significance was tested using unpaired t test throughout versus respective control; **p < 0.01; ***p < 0.001.
Fig 5
Fig 5. Connectivity map (CMAP) pathway and network analysis for AR-A014418 target genes.
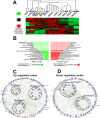
Gene list generated to obtain the drug profiles for AR-A014418 (S6 Table) was utilized to compile the CMAP “AR-A014418” target-gene list, and genes prospectively up-regulated are presented as a heatmap in (A) showing enrichment in earlier postnatal dorsal subventricular zone (dSVZ) cells. aEPs, adult ependymas; aNPs, adult neuronal precursors; GM, grey matter; astros, astrocytes; mOLs, mature/myelinating oligodendrocytes; aNSCs, adult neural stem cells (NSCs); dNSCs, dorsal NSCs; dTAPs, dorsal transient amplifying progenitors (TAPs); lNSCs, lateral NSCs; lTAPs, lateral TAPs. (B) Prospectively up-regulated or down-regulated genes analyzed by Genego Metacore for GO Pathway Maps and Process Networks, and lists are ranked according to significance (false discovery rate [FDR] <1%)/numbers of genes present in each of the categories. (C, D) Short path network to visualize highly connected signaling-to-transcriptional nodes were performed for up- and down-regulated ARA-014418 target genes. Internal clusters were grouped by selecting the “link GO objects” in GeneGo Metacore. Highlighted blue objects are directly within data and remaining objects are within the background (or basal) data.
Fig 6
Fig 6. Pharmacological stimulation of Wnt/β-catenin signaling rescues oligodendrocyte precursor (OP) and glutamatergic neuron progenitor numbers in the adult mouse.
(A) Quantitative PCR (qPCR) analysis reveals a pronounced decrease of Wnt targets genes Lef1 and Axin2 and pallial Emx1 and Tbr2 transcripts expression in the dorsal subventricular zone (dSVZ) between P6 and P60 (n = 3 for P6 and P60). Results are expressed as a percentage and normalized in comparison with Gapdh level of expression and compared using unpaired t test. (B) Representative coronal sections illustrating the pronounced and rapid decrease of Wnt canonical signaling in the βGal reporter mouse (βGAL+) and the parallel decrease of glutamatergic NPs (Tbr2+) and OPs (Olig2+) in the SVZ of mouse brain at the age of 6 d (P6), 2 mo (P60), and 4 mo (P120) (n = 3 individual animals for each time point). (C) Quantification of the average number of βGAL+, Tbr2+, and Olig2+ cells in the dorsal wall of the SVZ in P6, P60, and P120 mice (3 animals per age). (D) Representative pictures of Ki67, Tbr2, and Olig2 expression in the adult (P90) SVZ before and after treatment with GSK3β inhibitors (AR-A014418, not shown, and CHIR99021, shown). (E) Percentage increase of proliferation (Ki67, EdU), OPs (Olig2), glutamatergic NPs (Tbr2), and NSC (Mcm2/GFAP) numbers following intraventricular infusion of AR-A014418 (3–10 μM) and CHIR99021 (3–10 μM). Values are normalized compared to the controls (n = 5 for each of control, AR-A014418, and CHIR99021). Error bars represent standard error of the mean (SEM). ***, p < 0.001; **, p < 0.01; *, p < 0.05; t test. Scale Bar = 1 mm (B) and 50 μm (D).
Fig 7
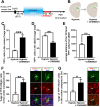
Fig 7. CHIR99021 promotes dorsal subventricular zone (dSVZ)-derived cortical oligodendrocyte (OL) regeneration following chronic hypoxia.
(A) Schematic representation of the experimental workflow. A Cre plasmid was electroporated in the dSVZ of ROSA-YFP mice 1 day after birth (P1) for permanent labeling of dorsal neural stem cells (NSCs). Mice were placed in a hypoxic chamber containing 10% O2 from P3 to P11 then subjected to intranasal CHIR99021 administration from P11 to P13. Animals were sacrificed at P19 for analysis of recombined cell number, migration, and differentiation. (B) Schematic representation of the results quantified in (C-E). (C-D) CHIR99021 treatment following hypoxia leads to a decrease of YFP+ cells in the dSVZ (C), paralleled by a concomitant increase in the cortex (n = 4 for hypoxic and n = 4 for CHIR99021) (D). (E) The average distance of the ten farthest YFP+ cells from the dorsal SVZ is increased following CHIR99021 treatment (n = 4 for hypoxic and n = 3 for CHIR99021). (F-G) CHIR99021 treatment promote de novo oligodendrogenesis (F), YFP+/Olig2+, and neurogenesis (G), YFP+/NeuN+; left confocal micrographs following hypoxia (n = 7 for hypoxic and n = 6 for CHIR99021). Right confocal micrographs show expression of CC1 in YFP+ cells in the most superficial cortical layers, supporting the successful differentiation of the newborn OLs (large arrow) that support myelin (small arrow shows colocalizing YFP+/MBP+ myelinated fibers) in CHIR99021 treated animals. ***p < 0.001; **, p < 0.01; *, p < 0.05; t test used throughout. Scale bars = 20 μm throughout.

Similar articles

Cited by

References

    1. Azim K, Hurtado-Chong A, Fischer B, Kumar N, Zweifel S, Taylor V, et al. Transcriptional Hallmarks of Heterogeneous Neural Stem Cell Niches of the Subventricular Zone. Stem cells. 2015;33(7):2232–42. 10.1002/stem.2017 - DOI - PubMed
    1. Llorens-Bobadilla E, Zhao S, Baser A, Saiz-Castro G, Zwadlo K, Martin-Villalba A. Single-Cell Transcriptomics Reveals a Population of Dormant Neural Stem Cells that Become Activated upon Brain Injury. Cell Stem Cell. 2015;17(3):329–40. 10.1016/j.stem.2015.07.002 - DOI - PubMed
    1. Stegmaier K, Ross KN, Colavito SA, O'Malley S, Stockwell BR, Golub TR. Gene expression-based high-throughput screening(GE-HTS) and application to leukemia differentiation. Nat Genet. 2004;36(3):257–63. 10.1038/ng1305 - DOI - PubMed
    1. Lamb J, Crawford ED, Peck D, Modell JW, Blat IC, Wrobel MJ, et al. The Connectivity Map: using gene-expression signatures to connect small molecules, genes, and disease. Science. 2006;313(5795):1929–35. Epub 2006/09/30. 10.1126/science.1132939 - DOI - PubMed
    1. Bond AM, Ming GL, Song H. Adult Mammalian Neural Stem Cells and Neurogenesis: Five Decades Later. Cell Stem Cell. 2015;17(4):385–95. Epub 2015/10/03. PubMed Central PMCID: PMC4683085. 10.1016/j.stem.2015.09.003 - DOI - PMC - PubMed

Publication types

Substances