. 2017 Mar 27;9(4):332.
doi: 10.3390/nu9040332.

Metabolic Impact of Light Phase-Restricted Fructose Consumption Is Linked to Changes in Hypothalamic AMPK Phosphorylation and Melatonin Production in Rats

Affiliations

Metabolic Impact of Light Phase-Restricted Fructose Consumption Is Linked to Changes in Hypothalamic AMPK Phosphorylation and Melatonin Production in Rats

Juliana de Almeida Faria et al. Nutrients. .

Abstract

Recent studies show that the metabolic effects of fructose may vary depending on the phase of its consumption along with the light/dark cycle. Here, we investigated the metabolic outcomes of fructose consumption by rats during either the light (LPF) or the dark (DPF) phases of the light/dark cycle. This experimental approach was combined with other interventions, including restriction of chow availability to the dark phase, melatonin administration or intracerebroventricular inhibition of adenosine monophosphate-activated protein kinase (AMPK) with Compound C. LPF, but not DPF rats, exhibited increased hypothalamic AMPK phosphorylation, glucose intolerance, reduced urinary 6-sulfatoxymelatonin (6-S-Mel) (a metabolite of melatonin) and increased corticosterone levels. LPF, but not DPF rats, also exhibited increased chow ingestion during the light phase. The mentioned changes were blunted by Compound C. LPF rats subjected to dark phase-restricted feeding still exhibited increased hypothalamic AMPK phosphorylation but failed to develop the endocrine and metabolic changes. Moreover, melatonin administration to LPF rats reduced corticosterone and prevented glucose intolerance. Altogether, the present data suggests that consumption of fructose during the light phase results in out-of-phase feeding due to increased hypothalamic AMPK phosphorylation. This shift in spontaneous chow ingestion is responsible for the reduction of 6-S-Mel and glucose intolerance.

Keywords: AMPK; corticosterone; fructose; melatonin; out-of-phase feeding.


Conflict of interest statement

The authors declare no conflict of interest, financial or otherwise, associated with this article. The authors are responsible for the writing and content of the article.

Figures
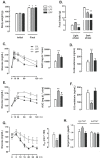
Figure 1
Figure 1
Metabolic and endocrine changes in rats exposed to fructose consumption during the light or the dark phases. Rats assigned to the groups control (CTL), Light Phase Fructose (LPF) and Dark Phase Fructose (DPF) had their (A) body weights assessed before and after (8 weeks) treatments. (B) Food intake during the light and the dark phases were also assessed at the end of the treatments. After these measurements, the rats were subjected to (C) glucose tolerance tests, (E) pyruvate tolerance tests and (G) insulin tolerance tests. Tests were performed two hours before “lights off” and the area under the curve (AUC) was calculated. Euthanasia was performed two hours before “lights off” when fragments of liver and plasma were collected. (D) Plasma samples were used for the determination of corticosterone levels. (F) Urine was collected overnight before euthanasia for determination of 6-S-Mel concentration. Fragments of liver were used for relative determination of (H) cyp1a2 and sult1a1 mRNAs by real time PCR. The results are presented as the means ± standard error of the mean. * p < 0.05 vs. the same group before treatment; ** p < 0.05 vs. CTL at the same phase of the light/dark cycle; # p < 0.05 vs. LPF at the same phase of the light/dark cycle.
Figure 2
Figure 2
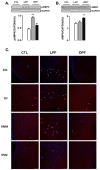
AMPK phosphorylation and content in hypothalamus of rats exposed to fructose consumption during the light or the dark phases. Rats assigned to the groups control (CTL), Light Phase Fructose (LPF) and Dark Phase Fructose (DPF) had their hypothalamus removed at the end of the eighth week of treatment. A first set of samples was used for (A) Western blot detection of phosphorylated Adenosine Monophosphate-activated protein kinase (AMPK) and (B) total AMPK. Target proteins were normalized to Glyceraldehyde 3-phosphate dehydrogenase (GAPDH). A second set of samples was processed for immunofluorescent staining. Sections were stained using an anti-pAMPK antibody followed by secondary antibody conjugated to Alexafluor 546 (red). Nuclear structures are visualized by 4′,6-diamidino-2-phenylindole (DAPI) probing (Blue). (C) Large magnification (400×) images are shown from the arcuate nucleus (ARC), lateral hypothalamus (LH), ventro medial hypothalamus (VMH) and paraventricular nucleus (PVN). The results are presented as the means ± standard error of the mean. ** p < 0.05 vs. CTL.
Figure 3
Figure 3
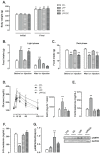
Pharmacological inhibition of adenosine monophosphate-activated protein kinase (AMPK) in the central nervous system of LPF rats. Rats were assigned to the groups control (CTL), Light Phase Fructose (LPF), Compound C (CC) and Light Phase Fructose with Compound C (LPF/CC). Cannula implantation and icv treatments (five days) occurred during the sixth and eighth weeks of fructose treatment, respectively. (A) Body weights were assessed before and after (8 weeks) fructose treatment. Food intake was assessed before and after icv injections during the last week of fructose treatment. Data were acquired separately during the (B) light and the (C) dark phases. After these measurements (D), the rats were subjected to glucose tolerance tests. Tests were performed two hours before “lights off” and area under the curve (AUC) was calculated. Euthanasia was performed two hours before lights off, and the hypothalamus and plasma were collected. (E) Plasma samples were used for corticosterone determinations. (F) Urine was collected overnight before euthanasia for determination of 6-S-Mel concentration. (G) Hypothalamus samples were used for Western blot detection of phosphorylated AMPK and normalization by Glyceraldehyde 3-phosphate dehydrogenase (GAPDH). The results are presented as the means ± standard error of the mean. * p < 0.05 vs. same group before fructose treatment; ** p < 0.05 vs. CTL at the same moment of icv treatment.
Figure 4
Figure 4
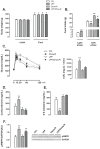
Dark-restricted feeding in rats exposed to fructose during the light phase. Rats were assigned to the groups Control (CTL), Light Phase Fructose (LPF), Chow restriction to the dark phase (Chow-R) and Light Phase Fructose with Chow restriction to the dark phase (LPF/Chow-R). (A) Body weights were assessed before and after (eight week) treatments; (B) Food intake during the light and the dark phases were also assessed at the end of the treatments; After these measurements (C), the rats were subjected to glucose tolerance tests. Tests were performed two hours before “lights off” and area under the curve (AUC) was calculated. Euthanasia was performed two hours before “lights off” and the hypothalamus and plasma were collected; (D) Plasma samples were used for the determination of corticosterone levels; (E) Urine was collected overnight before euthanasia for determination of the 6-S-Mel concentration; (F) Hypothalamus samples were used for Western blot detection of phosphorylated adenosine monophosphate-activated protein kinase and normalization by Glyceraldehyde 3-phosphate dehydrogenase (GAPDH). The results are presented as the means ± standard error of the mean. * p < 0.05 vs. same group before treatment; ** p < 0.05 vs. CTL at the same phase of the light/dark cycle; # p < 0.05 vs. Chow-R at the same phase of the light/dark cycle.
Figure 5
Figure 5
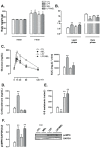
Nocturnal melatonin administration in rats exposed to fructose during the light phase. Rats were assigned to the groups control (CTL), Light Phase Fructose (LPF), melatonin (Mel) and Light Phase Fructose with melatonin (LPF/Mel). (A) Body weights were assessed before and after (eight week) treatments; (B) Food intake during the light and the dark phases were also assessed at the end of the treatments; After these measurements (C), the rats were subjected to glucose tolerance tests. Tests were performed two hours before “lights off” and area under the curve (AUC) was calculated. Euthanasia was performed two hours before “lights off” and the hypothalamus and plasma were collected; (D) Plasma samples were used for the determination of corticosterone levels; (E) Urine was collected overnight before euthanasia for determination of 6-S-Mel concentration; (F) Hypothalamus samples were used for Western blot detection of phosphorylated adenosine monophosphate-activated protein kinase and normalization by Glyceraldehyde 3-phosphate dehydrogenase (GAPDH). The results are presented as the means ± standard error of the mean. * p < 0.05 vs. same group before treatment; ** p < 0.05 vs. CTL at the same phase of the light/dark cycle.

Similar articles

Cited by

References

    1. American Diabetes Association Diagnosis and classification of diabetes mellitus. Diabetes Care. 2010;33:S62–S69. - PMC - PubMed
    1. Reaven G.M. Banting lecture 1988. Role of insulin resistance in human disease. Diabetes. 1988;37:1595–1607. doi: 10.2337/diab.37.12.1595. - DOI - PubMed
    1. Oron-herman M., Kamari Y., Grossman E., Yeger G., Peleg E., Shabtay Z., Shamiss A., Sharabi Y. Metabolic syndrome: Comparison of the two commonly used animal models. Am. J. Hypertens. 2008;21:1018–1022. doi: 10.1038/ajh.2008.218. - DOI - PubMed
    1. Chan S.M., Sun R.Q., Zeng X.Y., Choong Z.H., Wang H., Watt M.J., Ye J.M. Activation of PPARα ameliorates hepatic insulin resistance and steatosis in high fructose-fed mice despite increased endoplasmic reticulum stress. Diabetes. 2013;62:2095–2105. doi: 10.2337/db12-1397. - DOI - PMC - PubMed
    1. Stanhope K.L., Schwarz J.M., Keim N.L., Griffen S.C., Bremer A.A., Graham J.L., Hatcher B., Cox C.L., Dyachenko A., Zhang W., et al. Consuming fructose-sweetened, not glucose-sweetened, beverages increases visceral adiposity and lipids and decreases insulin sensitivity in overweight/obese humans. J. Clin. Investig. 2009;119:1322–1334. doi: 10.1172/JCI37385. - DOI - PMC - PubMed

LinkOut - more resources