. 2017 Mar 27:8:14892.
doi: 10.1038/ncomms14892.

Domain-dependent effects of insulin and IGF-1 receptors on signalling and gene expression

Affiliations

Domain-dependent effects of insulin and IGF-1 receptors on signalling and gene expression

Weikang Cai et al. Nat Commun. .

Abstract

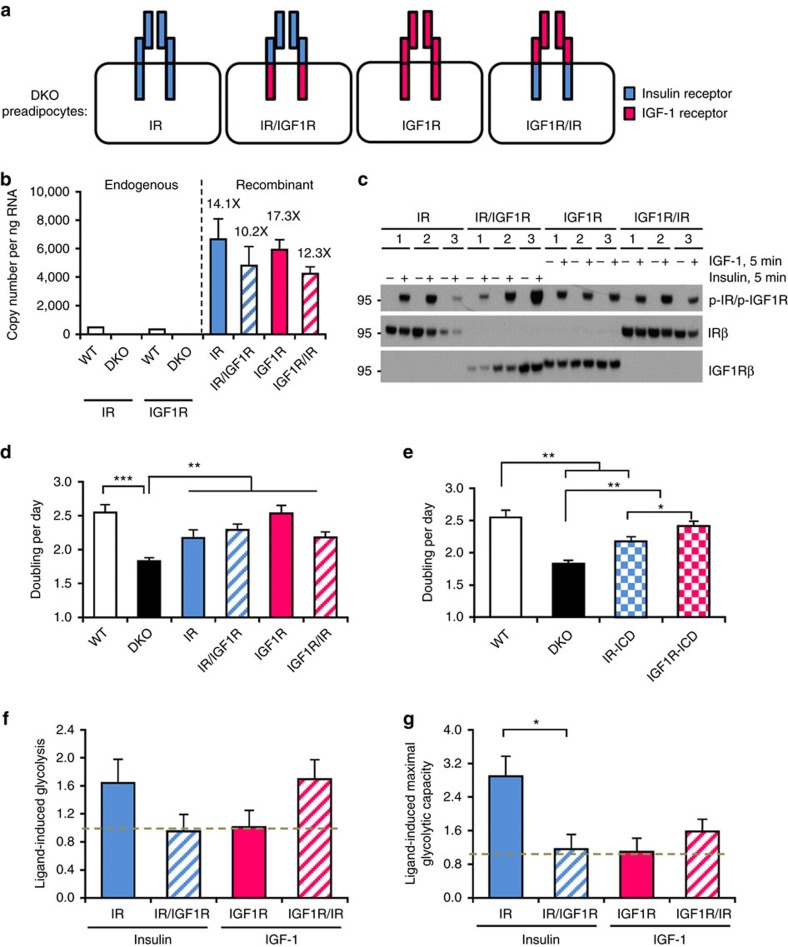
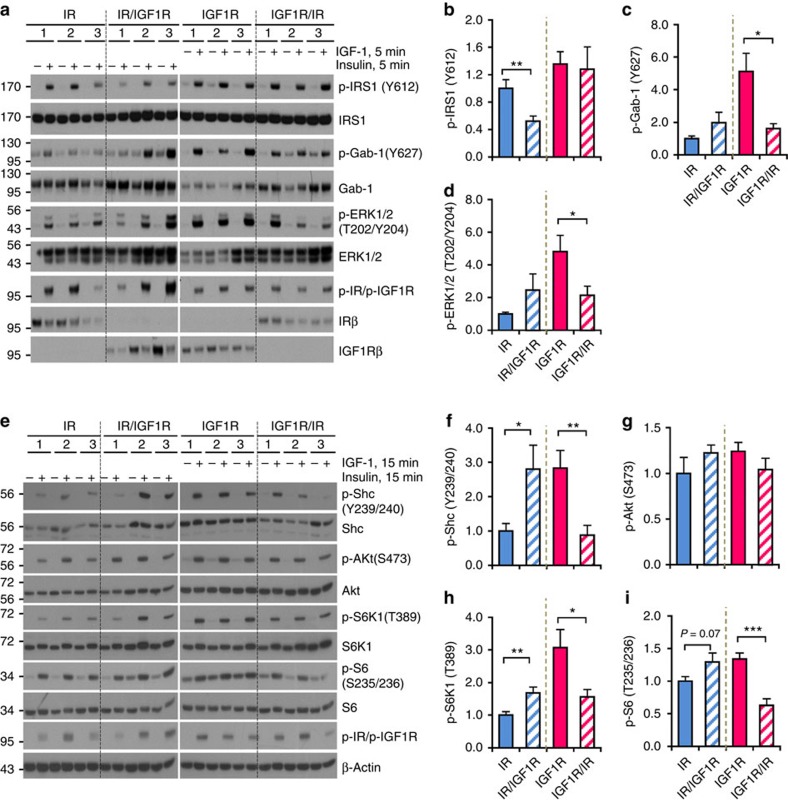
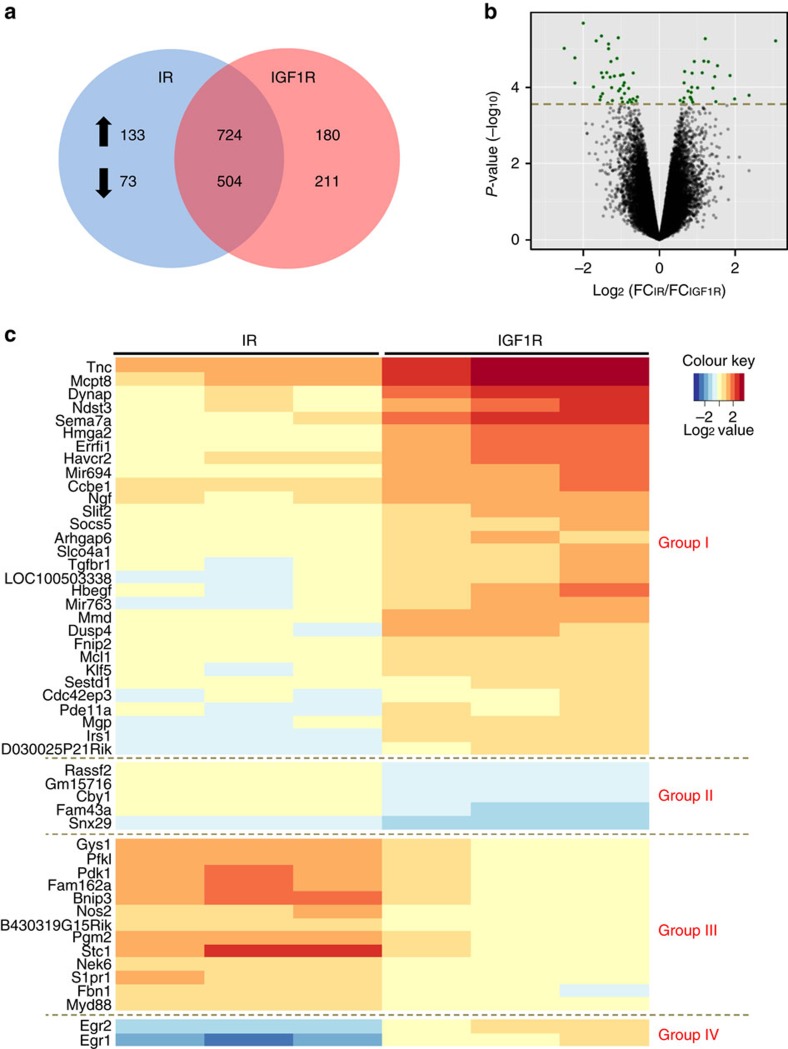
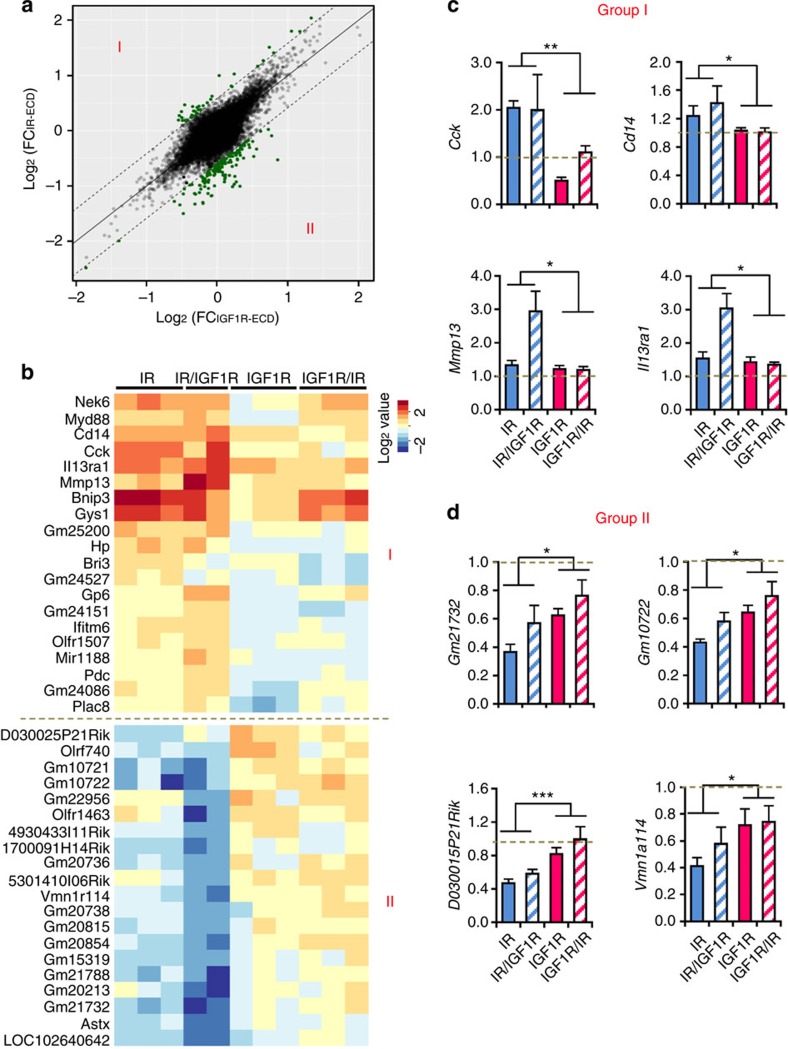
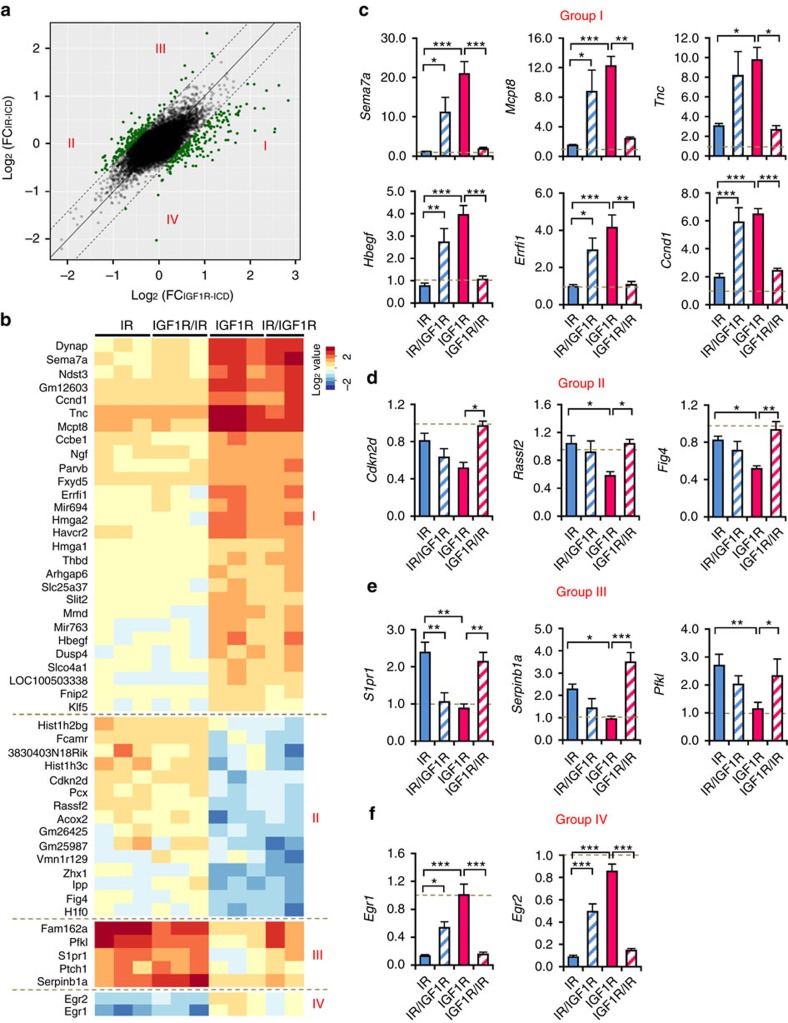
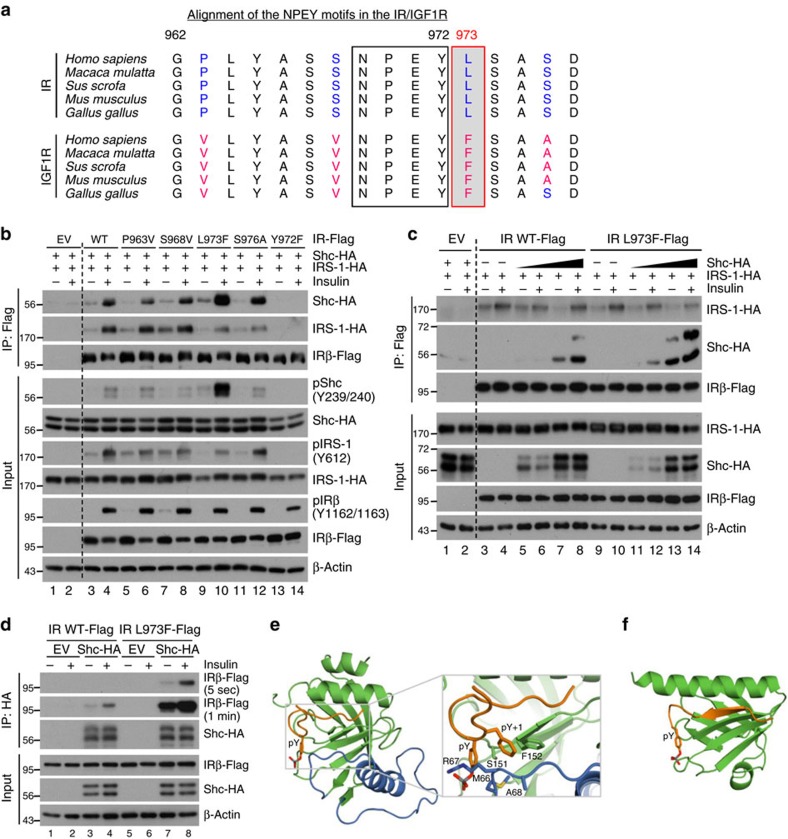
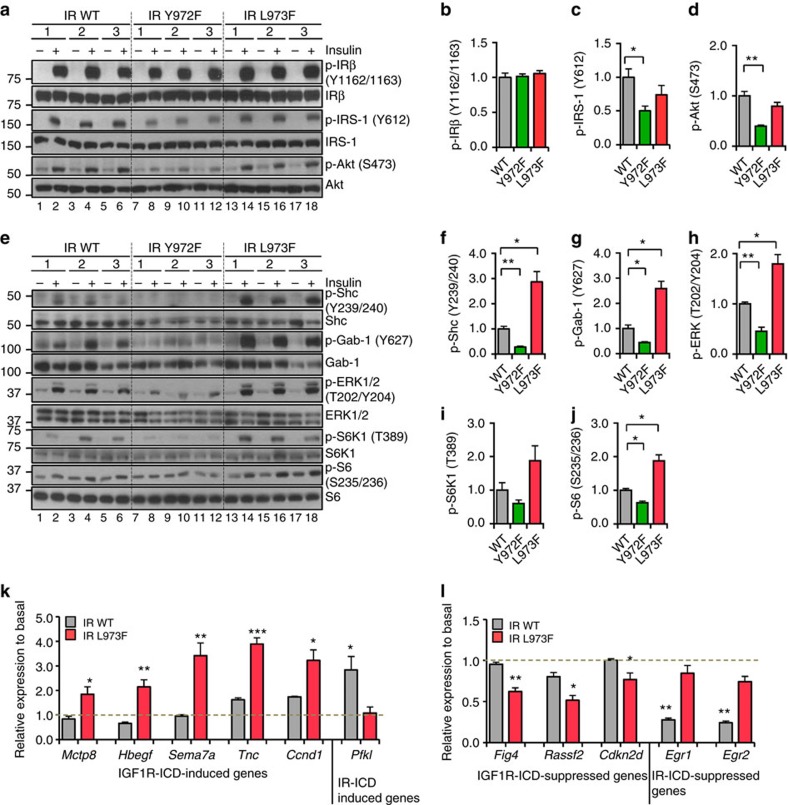
Despite a high degree of homology, insulin receptor (IR) and IGF-1 receptor (IGF1R) mediate distinct cellular and physiological functions. Here, we demonstrate how domain differences between IR and IGF1R contribute to the distinct functions of these receptors using chimeric and site-mutated receptors. Receptors with the intracellular domain of IGF1R show increased activation of Shc and Gab-1 and more potent regulation of genes involved in proliferation, corresponding to their higher mitogenic activity. Conversely, receptors with the intracellular domain of IR display higher IRS-1 phosphorylation, stronger regulation of genes in metabolic pathways and more dramatic glycolytic responses to hormonal stimulation. Strikingly, replacement of leucine973 in the juxtamembrane region of IR to phenylalanine, which is present in IGF1R, mimics many of these signalling and gene expression responses. Overall, we show that the distinct activities of the closely related IR and IGF1R are mediated by their intracellular juxtamembrane region and substrate binding to this region.


Conflict of interest statement

The authors declare no competing financial interests.

Figures

Figure 1
Figure 1. Differential roles of IR and IGF1R in regulating proliferation and glycolysis.
(a) Schematic showing IR/IGF1R double knockout preadipocytes reconstituted with normal IR, IGF1R, and chimeric receptors IR/IGF1R and IGF1R/IR. (b) Relative mRNA levels of endogenous IR and IGF1R from wild-type and DKO cells, as well as overexpressed recombinant receptors. Data were shown as mean±s.e.m. copy number per ng total RNA, n=3. Fold overexpression of each recombinant receptor to endogenous receptor are highlighted. (c) Immunoblotting of phosphorylated and total receptors in lysates from three independent lines of cells expressing normal IR and chimeric receptor IR/IGF1R stimulated with 10 nM insulin or cells expressing normal IGF1R and chimeric receptor IGF1R/IR stimulated with 10 nM IGF-1 for 5 min. (d) Proliferation rates of wild-type, DKO and receptor-reconstituted cells grown in DMEM+10% FBS. Cell doubling times per day are shown as mean±s.e.m. (**P<0.01; ***P<0.001. One-way ANOVA followed by Newman–Keuls post-hoc analysis, n=6). (e) Proliferation rates of wild-type, DKO cells and combined data on cells expressing receptors with IR-ICD and IGF1R-ICD grown in DMEM+10% FBS. Data are shown as mean±s.e.m. (*P<0.05; **P<0.01. One-way ANOVA followed by Newman–Keuls post-hoc analysis, n=12). (f) Glycolysis induced by insulin or IGF-1 (100 nM) stimulation for 6 h. Cells were serum starved overnight, stimulated with ligands and ECAR values as an indicator for glycolysis were measured using a Seahorse X24 Bioanalyzer. Fold change of glycolysis rates in response to stimulation were calculated for each cell line and presented as mean±s.e.m. (Student t-test, n=5). (g) Maximal glycolytic capacity induced by insulin or IGF-1 (100 nM) stimulation for 6 h. Fold change of the maximal glycolytic capacity as measured by ECAR upon ligand stimulation was calculated for each cell line and shown as mean±s.e.m. (*P<0.05, Student t-test, n=5).
Figure 2
Figure 2. IR and IGF1R modulate different signalling upon hormonal stimulation.
(a) Immunoblotting of protein phosphorylation in lysates from cells stimulated with insulin or IGF-1 (10 nM) for 5 min. (bd) Densitometric analysis of phosphorylated proteins following 5 min after stimulation. Data are mean±s.e.m. (*P<0.05; **P<0.01. One-way ANOVA followed by Newman–Keuls post-hoc analysis; three clones used in three independent experiments). (e) Immunoblotting of protein phosphorylation in lysates from cells stimulated with insulin or IGF-1 (10 nM) for 15 min. (fi) Densitometry analysis of phosphorylated proteins following 15 min ligand stimulation. Data are mean±s.e.m. (*P<0.05; **P<0.01. One-way ANOVA followed by Newman–Keuls post-hoc analysis; three clones used in three independent experiments).
Figure 3
Figure 3. Differential gene expression patterns regulated by IR and IGF1R.
(a) Venn diagram showing the numbers of significantly regulated genes in IR and IGF1R-expressing cells. Left part of the IR pie represents the genes specifically regulated by IR by at least 50% (FDR<0.05). Right part of the IGF1R pie represents the genes specifically regulated by IGF1R by at least 50% (FDR<0.05). The overlapping region represents genes regulated by both IR and IGF1R (FDR<0.05). (b) Volcano plot showing the distribution of differentially regulated probe sets in IR and IGF1R, with log ratio of fold change in IR versus fold change in IGF1R on x axis and −log10 P value on y axis. Each dot represents the mean of all the clones for each type of receptor. Highlighted dots represent the most significant genes. (c) Heat map of top 50 significant genes differentially regulated by IR and IGF1R.
Figure 4
Figure 4. Differential roles of IR-ECD and IGF1R-ECD in regulating gene expression.
(a) Scattered plot showing distribution of log fold change of each probeset's expression after stimulation in cells expressing receptors with IR-ECD (y axis) versus that in cells expressing receptors with IGF1R-ECD (x axis). Each dot represents the mean of all the clones expressing the receptors with the same ECD. The highlighted dots represent the probe sets with fold-change difference between IR-ECD and IGF1R-ECD over 50%. (b) Heat map of top 20 significant genes in both groups in a. (c) Fold changes of expression in response to stimulation for representative genes highly induced in cells expressing receptors with IR-ECD were confirmed by qPCR versus TBP. (d) Fold changes of expression in response to stimulation for representative genes highly suppressed in cells expressing receptors with IR-ECD were confirmed by qPCR versus TBP. Data are mean±s.e.m. (*P<0.05; **P<0.01; ***P<0.001. One-way ANOVA followed by Newman–Keuls post-hoc analysis, n=6).
Figure 5
Figure 5. Differential roles of IR-ICD and IGF1R-ICD in regulating gene expression.
(a) Scattered plot showing distribution of log fold change of each probeset's expression after stimulation in cells expressing receptors with IR-ICD (y axis) versus that in IGF1R-ICD (x axis). Each dot represents the mean of all the clones expressing the receptors with the same ICD. The highlighted dots represent the probe sets with fold-change difference between IR-ICD and IGF1R-ICD over 50%. (b) Heat map of top significant genes in a classifying into four groups. (c,d) Fold changes of representative genes highly induced (c) or suppressed (d) by cells expressing receptors with IGF1R-ICD were confirmed by qPCR using TBP as a standard. (e,f) Fold changes of expression in response to stimulation for representative genes preferentially induced (e) or suppressed (f) by cells expressing receptors with IR-ICD were confirmed by qPCR using TBP as a standard. Data are mean±s.e.m. (*P<0.05; **P<0.01; ***P<0.001. One-way ANOVA followed by Newman–Keuls post-hoc analysis, n=6).
Figure 6
Figure 6. Amino acid following NPEY motif dictates the preference of Shc binding.
(a) Alignment of the juxtamembrane regions in the insulin and IGF-1 receptors throughout evolution. (b) Co-immunoprecipitation of IR, Shc and IRS-1. Flag-tagged IR or mutated IR were immunoprecipitated with anti-Flag antibody following insulin stimulation. Bound Shc and IRS-1 was detected by biotin-HA immunoblotting. Phosphorylation of proteins from total cell lysates was detected by phospho-specific antibodies. (c) Co-immunoprecipitation of IR and IRS-1 with increasing expression levels of Shc. Flag-tagged IR or mutated IR were immunoprecipitated with anti-Flag antibody following insulin stimulation. Bound Shc and IRS-1 was detected by biotin-HA immunoblotting. (d) Co-immunoprecipitation of Shc and IR. HA-tagged Shc was immunoprecipitated with anti-HA antibody following insulin stimulation. Bound IR and IRL973F were detected by anti-Flag immunoblotting. (e) Solution NMR structure of the Shc-PTB domain (green and blue) bound to a phosphorylated segment containing the NPxY motif from the TrkA receptor (brown). Zoom-in: detailed view of the interaction between Shc-PTB and Phe at TrkA Y+1 position. Note, Phe makes extensive van der Waals contacts in the hydrophobic pocket formed by Phe152, Ser151, Met66 and the aliphatic portion of Arg67. Figure drawn from Protein Data Bank deposition 1SHC. (f) Crystal structure of the IRS-1 PTB domain (green) bound to a phosphorylated segment of the juxtamembrane region of the IR (brown). Figure drawn from Protein Data Bank deposition 5U1M.
Figure 7
Figure 7. Leu973 is a key residue differentiating IR signalling from IGF1R signalling.
(a) Immunoblotting of the phosphorylation of IR, IRS-1 and Akt in lysates from preadipocytes expressing normal IR, IRY972F and IRL973F stimulated with 100 nM insulin for 5 min. (bd) Densitometric analysis of phosphorylated IR, IRS-1 and Akt following 5 min stimulation. Data are mean±s.e.m. (*P<0.05; **P<0.01. One-way ANOVA followed by t-test with Bonferroni correction. n=3). (e) Immunoblotting of the phosphorylation of Shc, Gab-1, ERK, p70S6K1 and S6 in lysates from preadipocytes expressing normal IR, IRY972F and IRL973F stimulated with 100 nM insulin for 5 min. (fj) Densitometric analysis of phosphorylated Shc, Gab-1, ERK, p70S6K1 and S6 following 5 min stimulation. Data are mean±s.e.m. (*P<0.05; **P<0.01. One-way ANOVA followed by t-test with Bonferroni correction. n=3). (k,l) Fold changes of expression in response to stimulation for representative genes regulated by normal IR or IRL973F were confirmed by qPCR with TBP as the housekeeping gene. Data are presented as mean±s.e.m. (*P<0.05; **P<0.01; ***P<0.001. Student t-test. n=3).

Similar articles

Cited by

References

    1. Kahn C. R., Freychet P., Roth J. & Neville D. M. Jr Quantitative aspects of the insulin-receptor interaction in liver plasma membranes. J. Biol. Chem. 249, 2249–2257 (1974). - PubMed
    1. Steele-Perkins G. et al.. Expression and characterization of a functional human insulin-like growth factor I receptor. J. Biol. Chem. 263, 11486–11492 (1988). - PubMed
    1. Taniguchi C. M., Emanuelli B. & Kahn C. R. Critical nodes in signalling pathways: insights into insulin action. Nat. Rev. Mol. Cell Biol. 7, 85–96 (2006). - PubMed
    1. Kadowaki T. et al.. Five mutant alleles of the insulin receptor gene in patients with genetic forms of insulin resistance. J. Clin. Invest. 86, 254–264 (1990). - PMC - PubMed
    1. Accili D. et al.. Early neonatal death in mice homozygous for a null allele of the insulin receptor gene. Nat. Genet. 12, 106–109 (1996). - PubMed

Publication types