

The mTOR signal regulates myeloid-derived suppressor cells differentiation and immunosuppressive function in acute kidney injury
- PMID: 28333137
- PMCID: PMC5386577
- DOI: 10.1038/cddis.2017.86
The mTOR signal regulates myeloid-derived suppressor cells differentiation and immunosuppressive function in acute kidney injury
Abstract
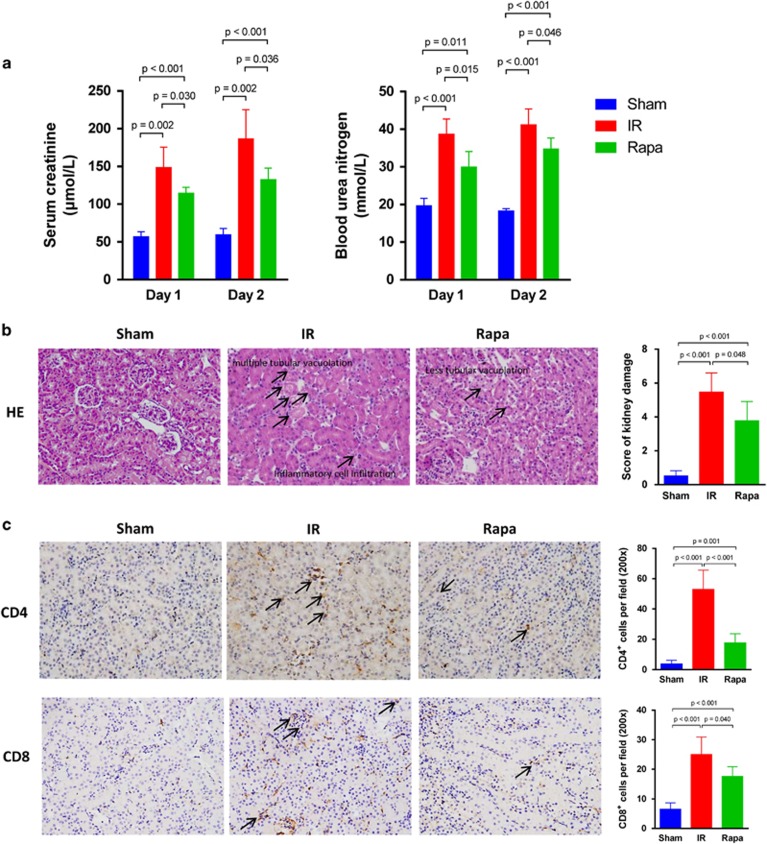
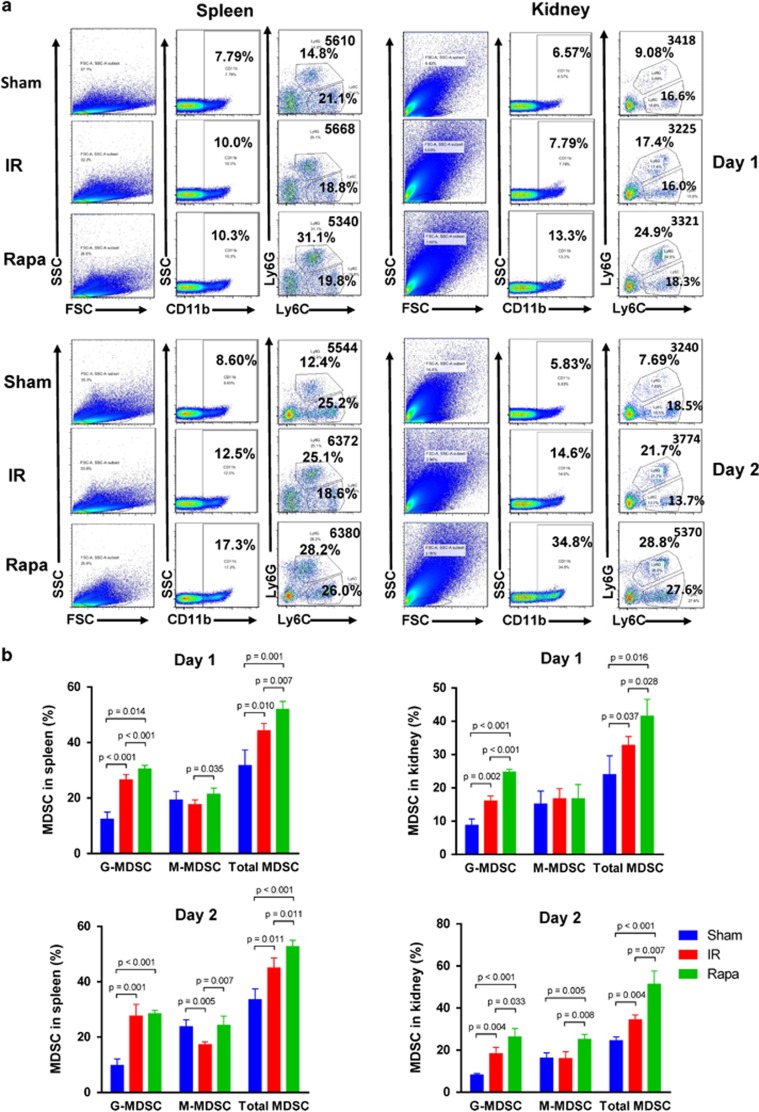
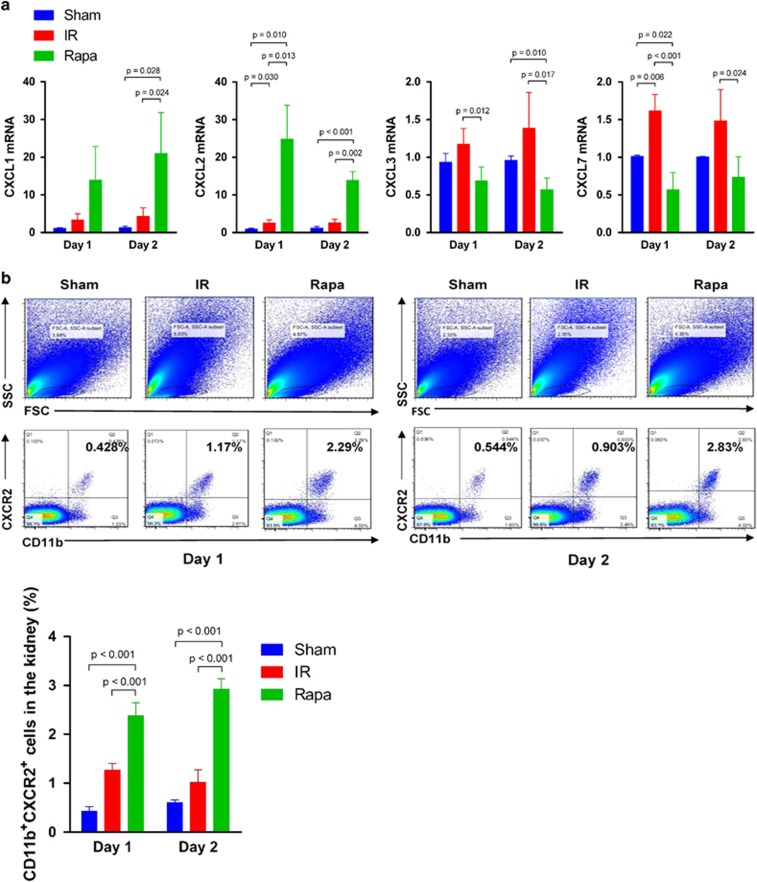
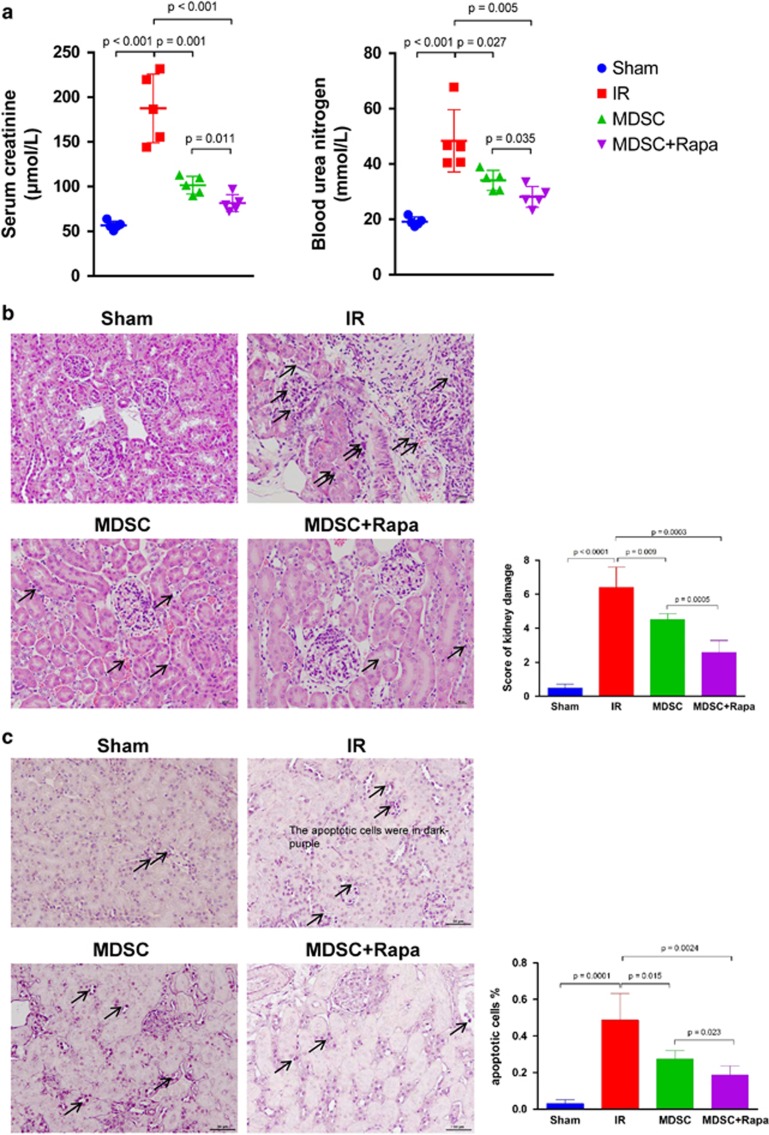
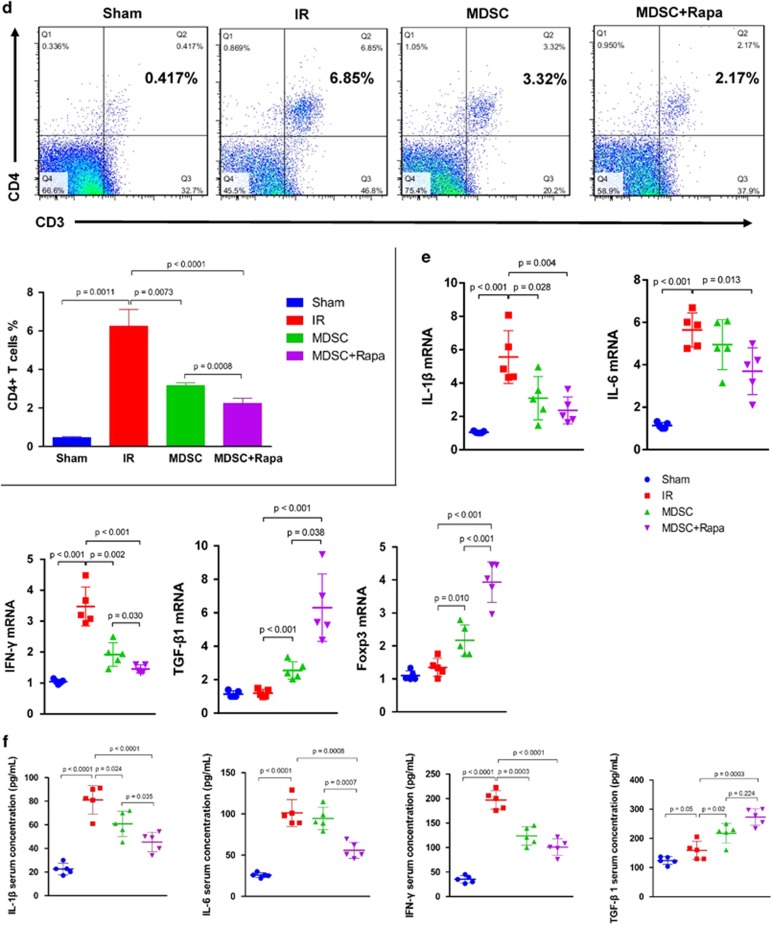
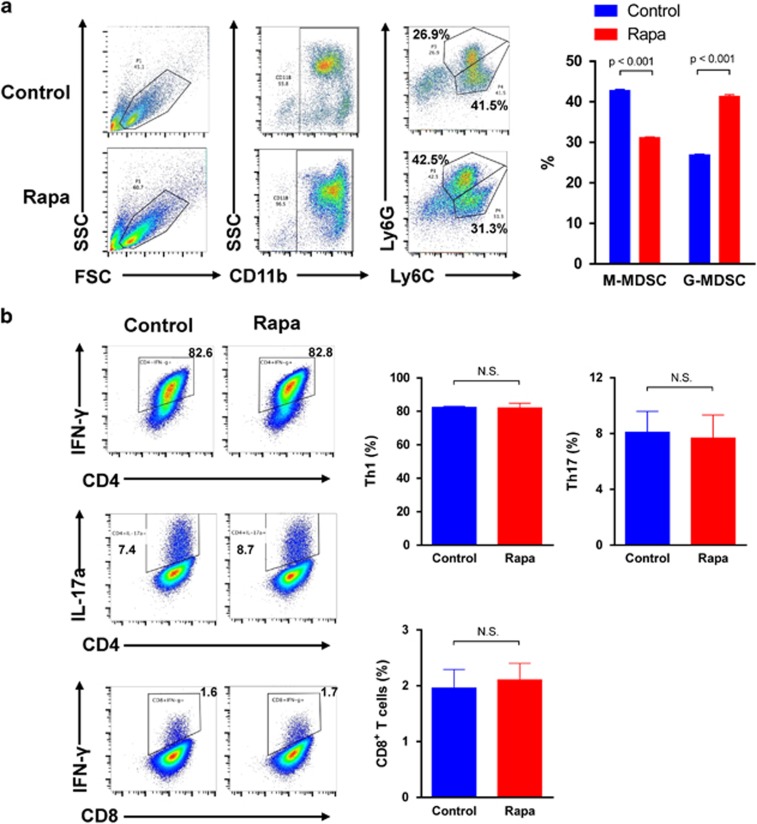
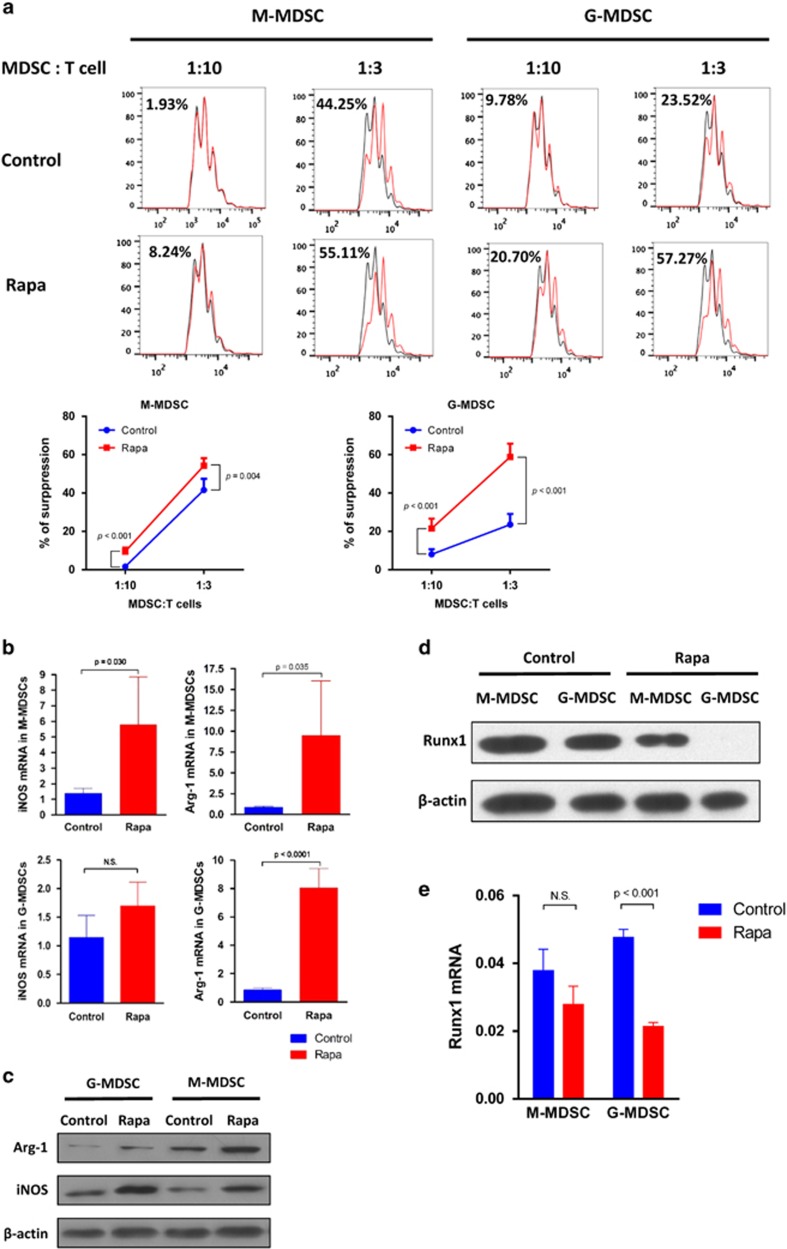
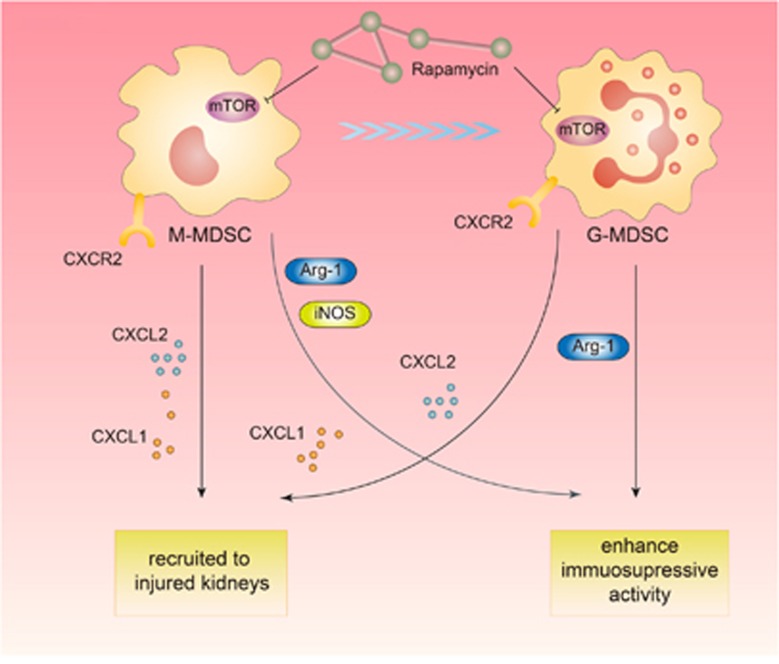
The mammalian target of rapamycin (mTOR) signal controls innate and adaptive immune response in multiple immunoregulatory contexts. Myeloid-derived suppressor cells (MDSCs) are a heterogeneous population of myeloid cells of potent immunosuppressive capacity. In this study, we aimed to investigate the role of MDSCs in the protection of acute kidney injury (AKI) and the regulation of mTOR signal on MDSC's protective role in this context. In mice AKI model, rapamycin administration was associated with improved renal function, restored histological damage and decreased CD4+ and CD8+ T-cell infiltration in kidney tissue. MDSCs, especially CD11b+Ly6G+Ly6Clow G-MDSCs were recruited to the injured kidney following the interaction of CXCL1, CXCL2 and their receptor CXCR2 after inhibiting mTOR signal with rapamycin treatment. The adoptive transfer of rapamycin-treated MDSCs into the mice with AKI significantly improved the renal function, ameliorated histologic damages and limited the infiltration of T cells in kidney tissue. In addition, the expression of pro-inflammatory cytokines IL-1β and IFN-γ mRNA was downregulated while the expression of TGF-β1 and Foxp3 mRNA was upregulated in kidney tissue after transferring rapamycin-treated MDSCs. Adoptive transfer of rapamycin-treated MDSCs also downregulated the serum levels of IL-1β, IL-6 and IFN-γ and upregulated the serum levels of TGF-β1 compared with the IR group and PBS-treated MDSC group. In in vitro study, inhibiting mTOR signal regulated the induction of MDSC towards the CD11b+Ly6G+Ly6Clow G-MDSC subset. The ability to suppress T-cell proliferation of both bone marrow-derived CD11b+Ly6G+Ly6Clow G-MDSCs and CD11b+Ly6G-Ly6Chigh M-MDSCs was enhanced by mTOR signal inhibition via upregulating the expression of Arginase-1 and iNOS. Accordingly, both G-MDSCs and M-MDSCs presented downregulated runx1 gene expression after rapamycin treatment. Taken together, our results demonstrated that MDSCs ameliorated AKI and the protective effect was enhanced by mTOR signal inhibition via promoting MDSCs recruitment, regulating the induction of MDSCs and strengthening their immunosuppressive activity.
Conflict of interest statement
The authors declare no conflict of interest.
Figures
Similar articles
-
mTOR masters monocytic myeloid-derived suppressor cells in mice with allografts or tumors.Sci Rep. 2016 Feb 1;6:20250. doi: 10.1038/srep20250. Sci Rep. 2016. PMID: 26833095 Free PMC article.
-
Myeloid-derived suppressor cell functionality and interaction with Leishmania major parasites differ in C57BL/6 and BALB/c mice.Eur J Immunol. 2014 Nov;44(11):3295-306. doi: 10.1002/eji.201344335. Epub 2014 Sep 19. Eur J Immunol. 2014. PMID: 25142017
-
mTOR signaling disruption from myeloid-derived suppressive cells protects against immune-mediated hepatic injury through the HIF1α-dependent glycolytic pathway.J Leukoc Biol. 2016 Dec;100(6):1349-1362. doi: 10.1189/jlb.2A1115-492R. Epub 2016 Jul 26. J Leukoc Biol. 2016. PMID: 27462101
-
Myeloid-Derived Suppressor Cells in Trypanosoma cruzi Infection.Front Cell Infect Microbiol. 2021 Aug 27;11:737364. doi: 10.3389/fcimb.2021.737364. eCollection 2021. Front Cell Infect Microbiol. 2021. PMID: 34513737 Free PMC article. Review.
-
Phenotype, development, and biological function of myeloid-derived suppressor cells.Oncoimmunology. 2015 Oct 14;5(2):e1004983. doi: 10.1080/2162402X.2015.1004983. eCollection 2016 Feb. Oncoimmunology. 2015. PMID: 27057424 Free PMC article. Review.
Cited by
-
Myeloid-Derived Suppressor Cells in Tumors: From Mechanisms to Antigen Specificity and Microenvironmental Regulation.Front Immunol. 2020 Jul 22;11:1371. doi: 10.3389/fimmu.2020.01371. eCollection 2020. Front Immunol. 2020. PMID: 32793192 Free PMC article. Review.
-
Innate immune cellular therapeutics in transplantation.Front Transplant. 2023;2:1067512. doi: 10.3389/frtra.2023.1067512. Epub 2023 Mar 31. Front Transplant. 2023. PMID: 37994308 Free PMC article.
-
Rapamycin Nano-Micelle Ophthalmic Solution Reduces Corneal Allograft Rejection by Potentiating Myeloid-Derived Suppressor Cells' Function.Front Immunol. 2018 Oct 8;9:2283. doi: 10.3389/fimmu.2018.02283. eCollection 2018. Front Immunol. 2018. PMID: 30349533 Free PMC article.
-
Amino acid metabolism in immune cells: essential regulators of the effector functions, and promising opportunities to enhance cancer immunotherapy.J Hematol Oncol. 2023 Jun 5;16(1):59. doi: 10.1186/s13045-023-01453-1. J Hematol Oncol. 2023. PMID: 37277776 Free PMC article. Review.
-
JAK1/2 inhibitor ruxolitinib promotes the expansion and suppressive action of polymorphonuclear myeloid-derived suppressor cells via the JAK/STAT and ROS-MAPK/NF-κB signalling pathways in acute graft-versus-host disease.Clin Transl Immunology. 2023 Feb 25;12(2):e1441. doi: 10.1002/cti2.1441. eCollection 2023. Clin Transl Immunology. 2023. PMID: 36855558 Free PMC article.
References
-
- Bellomo R, Kellum JA, Ronco C. Acute kidney injury. Lancet 2012; 380: 756–766. - PubMed
-
- Mehta RL, Cerda J, Burdmann EA, Tonelli M, Garcia-Garcia G, Jha V et al. International Society of Nephrology's 0by25 initiative for acute kidney injury (zero preventable deaths by 2025): a human rights case for nephrology. Lancet 2015; 385: 2616–2643. - PubMed
-
- Doi K, Rabb H. Impact of acute kidney injury on distant organ function: recent findings and potential therapeutic targets. Kidney Int 2016; 89: 555–564. - PubMed
-
- Rabb H, Daniels F, O'Donnell M, Haq M, Saba SR, Keane W et al. Pathophysiological role of T lymphocytes in renal ischemia-reperfusion injury in mice. Am J Physiol Renal Physiol 2000; 279: F525–F531. - PubMed
-
- Burne-Taney MJ, Yokota N, Rabb H. Persistent renal and extrarenal immune changes after severe ischemic injury. Kidney Int 2005; 67: 1002–1009. - PubMed
MeSH terms
Substances
LinkOut - more resources
Full Text Sources
Other Literature Sources
Research Materials
Miscellaneous
