. 2017 Apr 4;114(14):E2862-E2871.
doi: 10.1073/pnas.1618291114. Epub 2017 Mar 22.

Hepatic FcRn regulates albumin homeostasis and susceptibility to liver injury

Affiliations

Hepatic FcRn regulates albumin homeostasis and susceptibility to liver injury

Michal Pyzik et al. Proc Natl Acad Sci U S A. .

Abstract

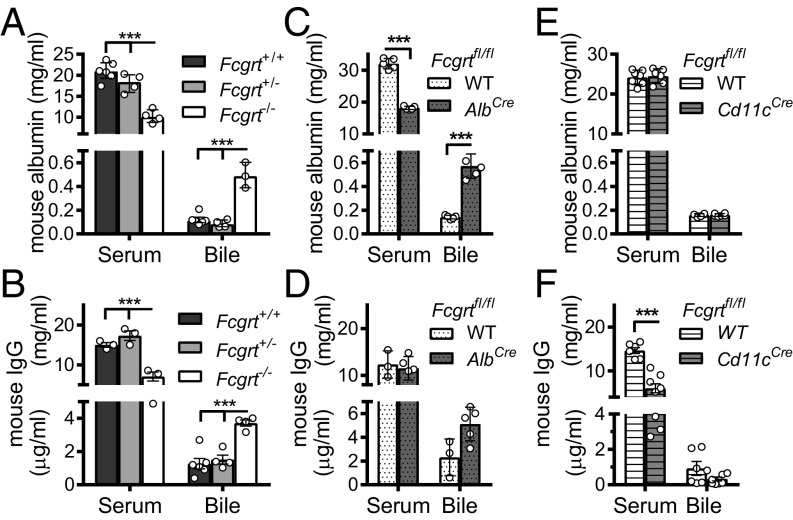
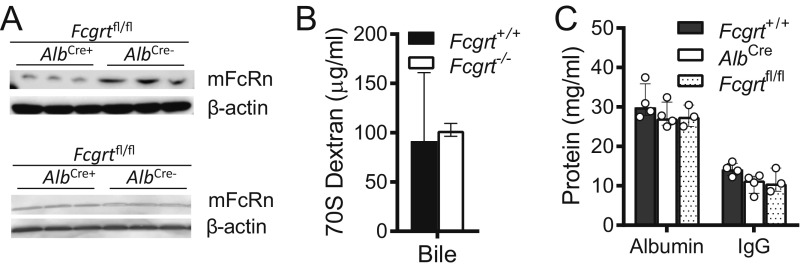
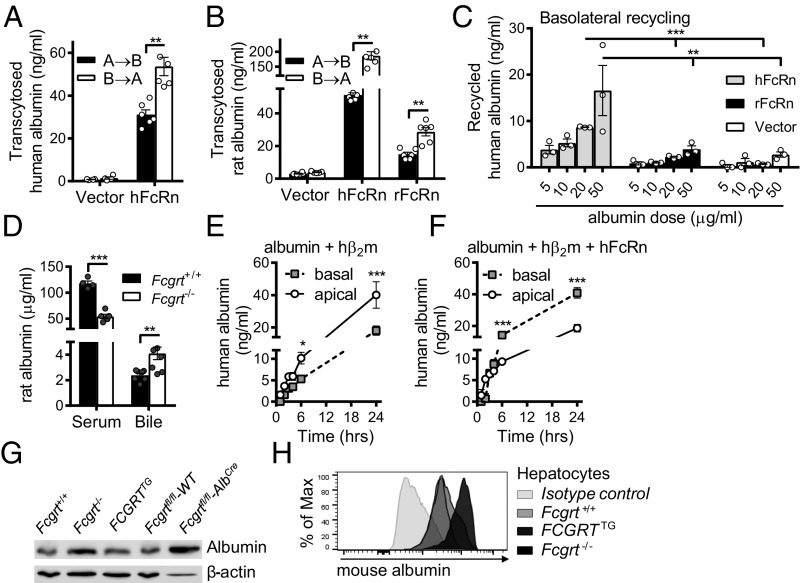
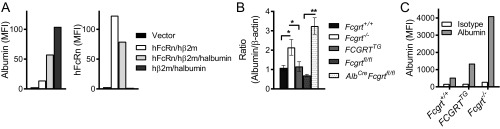
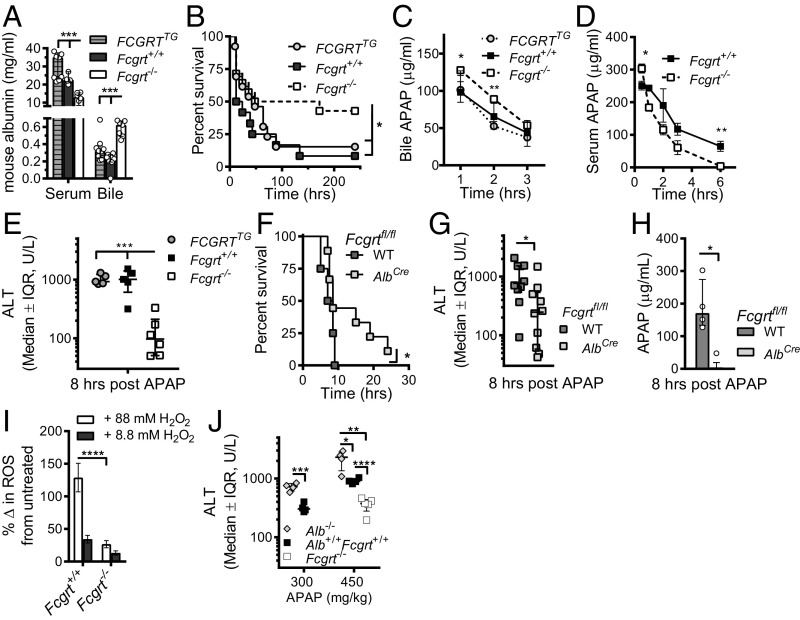
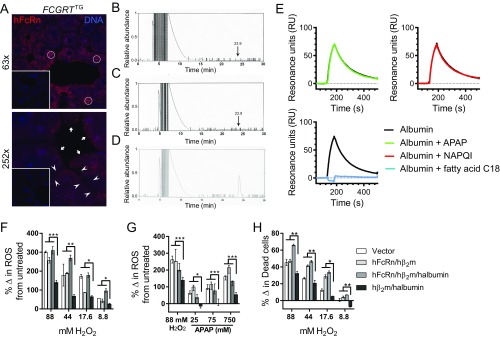
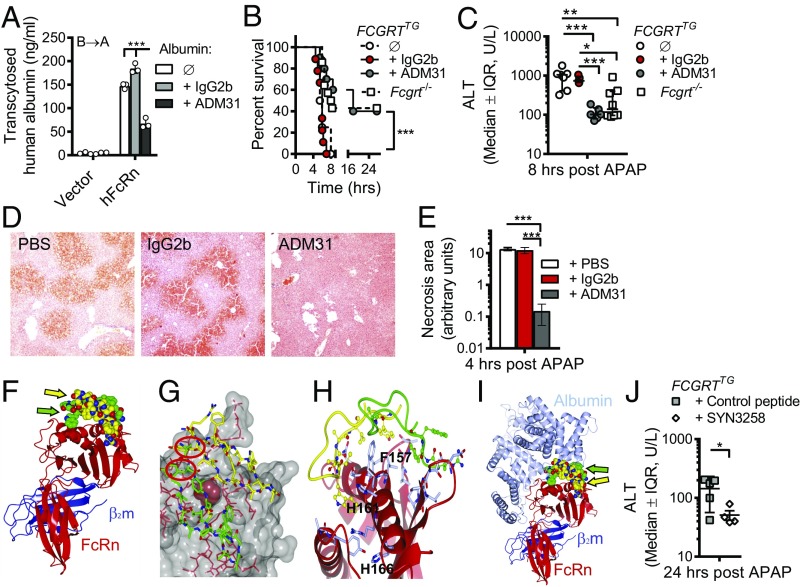
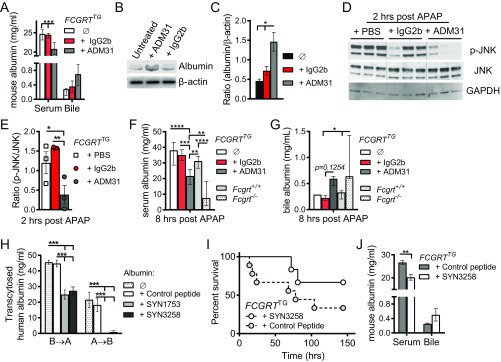
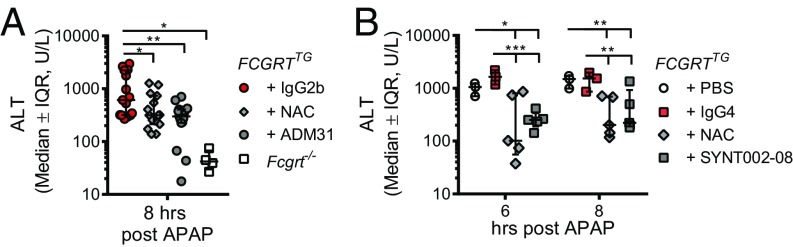
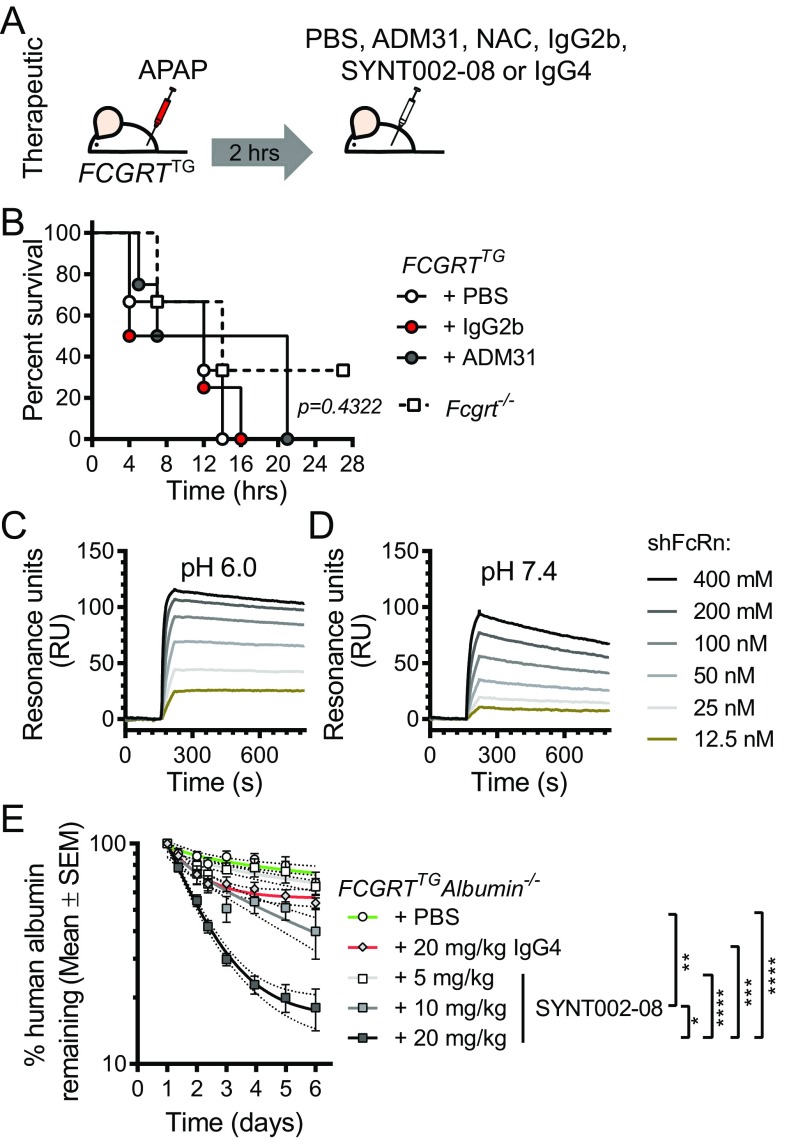
The neonatal crystallizable fragment receptor (FcRn) is responsible for maintaining the long half-life and high levels of the two most abundant circulating proteins, albumin and IgG. In the latter case, the protective mechanism derives from FcRn binding to IgG in the weakly acidic environment contained within endosomes of hematopoietic and parenchymal cells, whereupon IgG is diverted from degradation in lysosomes and is recycled. The cellular location and mechanism by which FcRn protects albumin are partially understood. Here we demonstrate that mice with global or liver-specific FcRn deletion exhibit hypoalbuminemia, albumin loss into the bile, and increased albumin levels in the hepatocyte. In vitro models with polarized cells illustrate that FcRn mediates basal recycling and bidirectional transcytosis of albumin and uniquely determines the physiologic release of newly synthesized albumin into the basal milieu. These properties allow hepatic FcRn to mediate albumin delivery and maintenance in the circulation, but they also enhance sensitivity to the albumin-bound hepatotoxin, acetaminophen (APAP). As such, global or liver-specific deletion of FcRn results in resistance to APAP-induced liver injury through increased albumin loss into the bile and increased intracellular albumin scavenging of reactive oxygen species. Further, protection from injury is achieved by pharmacologic blockade of FcRn-albumin interactions with monoclonal antibodies or peptide mimetics, which cause hypoalbuminemia, biliary loss of albumin, and increased intracellular accumulation of albumin in the hepatocyte. Together, these studies demonstrate that the main function of hepatic FcRn is to direct albumin into the circulation, thereby also increasing hepatocyte sensitivity to toxicity.

Keywords: FcRn; albumin; bile; liver; toxin.


Conflict of interest statement

Conflict of interest statement: R.S.B., W.I.L., D.C.R., and I.S. serve as consultants to Syntimmune, Inc., which is developing therapeutic agents directed at FcRn.

Figures

Fig. 1.
Fig. 1.
FcRn deficiency causes albumin-losing biliopathy. (A and B) Bile and serum levels of mouse albumin (A) or IgG (B) in Fcgrt/−, Fcgrt+/−, and Fcgrt+/+ mice (n = 3–6 mice per group; ***P < 0.001). (C and D) Bile and serum levels of mouse albumin (C) or IgG (D) in WT (Fcgrtfl/fl-WT) and Fcgrt liver-specific–deficient (Fcgrtfl/fl-AlbCre) mice (n = 3–5; ***P < 0.001). (E and F) Bile and serum levels of mouse albumin (E) or IgG (F) in WT (Fcgrtfl/fl-WT) mice and mice with CD11c-specific deletion of Fcgrt (Fcgrtfl/fl-Cd11cCre) (n = 6–7; ***P < 0.001). Data were statistically analyzed by two-way ANOVA with Fisher’s LSD post hoc test (Fig. 2 AF). Open circles represent biological replicates.
Fig. S1.
Fig. S1.
Liver-specific Fcgrt deletion. (A) Total mouse FcRn and β-actin levels in liver (Upper) and spleen (Lower) homogenates from Fcgrtfl/fl (AlbCre−) and AlbCre Fcgrtfl/fl (AlbCre+) PBS-perfused mice (n = 3). (B) 70S FITC-labeled dextran was injected i.v. into Fcgrt+/+ and Fcgrt/− mice. The mice were killed 24 h later, and dextran levels in bile were quantified (n = 5–8). (C) Circulating albumin and IgG levels in AlbCre, Fcgrtfl/fl, and Fcgrt+/+ mice (n = 3–4). Data were statistically analyzed by one-way ANOVA (Fig. 5 B and C). Open circles represent biological replicates.
Fig. 2.
Fig. 2.
Mechanisms of FcRn-mediated albumin transport. (A) Transcytosis of human albumin by MDCK II cells expressing hβ2m only (vector) or coexpressing hFcRn and hβ2m (hFcRn) (**P < 0.01). (B) Transcytosis of rat albumin by MDCK II cells expressing rβ2m only (vector), coexpressing hFcRn and hβ2m (hFcRn), or coexpressing rFcRn and rβ2m (rFcRn) (**P < 0.01). (C) Basolateral recycling of human albumin by MDCK II cells expressing hFcRn/hβ2m (hFcRn), rFcRn/rβ2m (rFcRn), or rβ2m only (vector) (**P < 0.01, ***P < 0.001). (D) Bile and serum levels of rat albumin in WT and Fcgrt/− mice 24 h after i.v. administration of 100 μg rat albumin (n = 4–6; **P < 0.01, ***P < 0.0001). (E and F) Detection of newly biosynthesized albumin in polarized MDCK II cells coexpressing hβ2m and human albumin (E) or hβ2m, human albumin, and hFcRn (F) (*P < 0.05; ***P < 0.01). (G) Total albumin levels in liver homogenates from Fcgrt/−, Fcgrt+/+, FCGRTTG, Fcgrtfl/fl-WT, and Fcgrtfl/fl-AlbCre mice. Representative blots from one mouse are displayed (n = 2–3). (H) Primary mouse hepatocytes were isolated from Fcgrt/−, Fcgrt+/+, and FCGRTTG mice and were fixed, permeabilized, and stained for intracellular albumin. Representative histograms of albumin staining vs. isotype control are displayed. Open circles represent replicates. Gray-filled circles represent replicates. Gray-filled circles represent biological replicates. Data were statistically analyzed by unpaired Student t test (AC, E, and F) or two-way ANOVA with Fisher’s LSD post hoc test (D).
Fig. S2.
Fig. S2.
Intracellular retention of albumin in hepatocytes in the absence of FcRn expression. (A) Detection of newly biosynthesized albumin (Left) or hFcRn (Right) in MDCK II cells expressing human albumin or coexpressing human albumin and hFcRn. MDCK II cells expressing hβ2m (vector) only, hβ2m and hFcRn (hFcRn/hβ2m), hβ2m and human albumin (hAlbumin/hβ2m), or hβ2m, hFcRn, and human albumin (hFcRn/hβ2m /hAlbumin) were stained for intracellular albumin and hFcRn. The bar graph shows the mean fluorescence intensity (MFI) of albumin and hFcRn staining. (B) Total albumin levels in liver homogenates from Fcgrt/−, Fcgrt+/+, FCGRTTG, Fcgrtfl/fl (WT), and Fcgrtfl/fl-AlbCre mice. Each experiment was performed twice. Compiled results are shown in the bar graph (n = 2–3; *P < 0.05, **P < 0.01). (C) Primary mouse hepatocytes were isolated from Fcgrt/−, Fcgrt+/+, and FCGRTTG mice and were stained for intracellular albumin. The bar graph shows compiled results expressed as the MFI of albumin staining vs. that of isotype control. Data were statistically analyzed by one-way ANOVA.
Fig. 3.
Fig. 3.
Relevance of FcRn deficiency in an APAP toxicity model. (A) Bile and serum levels of mouse albumin in Fcgrt/−, Fcgrt+/+, and FCGRTTG mice (n = 4–7 mice per group; ***P < 0.001). (B) Survival curves after lethal APAP administration (600 mg/kg) in Fcgrt−/− (n = 14), Fcgrt+/+ (n = 12), and FCGRTTG (n = 13) (*P = 0.0486). (C) Excretion of APAP into the bile after a lethal dose of APAP in Fcgrt+/+, Fcgrt−/−, and FCGRTTG mice (n = 4 per group; *P < 0.05, **P < 0.01). (D) Serum APAP levels in WT and Fcgrt−/− mice after a lethal dose of APAP (n = 7 per group; *P = 0.0185 **P = 0.0049). (E) Serum ALT levels 8 h after sublethal APAP administration (400 mg/kg) to Fcgrt−/−, Fcgrt+/+, and FCGRTTG mice (n = 5–6; ***P < 0.001). (F) Survival curves after lethal APAP administration (600 mg/kg) to WT (Fcgrtfl/fl-WT) and Fcgrt liver-specific–deficient (Fcgrtfl/flAlbCre) mice (n = 5–9; *P < 0.05). (G and H) Serum ALT (G) and APAP (H) levels 8 h after sublethal APAP administration (400 mg/kg) to Fcgrtfl/fl-WT and Fcgrtfl/fl-AlbCre mice [n = 9 or 10, pooled from three experiments (G) or n = 4 (H), *P < 0.05]. (I) Intracellular levels of ROS in Fcgrt+/+ or Fcgrt−/− mouse primary hepatocytes (****P < 0.0001). Levels of oxidative stress were determined using a cell-permeable fluorescence probe, the chloromethyl derivative of H2DCF-DA (CM-H2DCF-DA), which is oxidized to fluorescent DCF. Cells were left untreated or were treated with different concentrations of H2O2 to increase intracellular levels of oxidative stress. The percent of change (%Δ) in ROS was calculated by subtracting the DCF mean fluorescence intensity (MFI) of untreated cells from the DCF MFI of H2O2-treated cells. (J) Serum ALT levels 8 h after administration of two different sublethal doses of APAP (300 and 450 mg/kg) in Alb−/−, Alb+/+Fcgrt+/+, and Fcgrt−/− mice (n = 4–5; *P = 0.019; **P < 0.0013; ***P = 0.0006; ****P < 0.00011). Open circles represent biological replicates. Data were statistically analyzed by one-way ANOVA (A and E), two-way ANOVA (I), unpaired Student t test (C, D, G, H, and J), or Mantel–Cox test (B and F). IQR, interquartile range; U/L, units per liter.
Fig. S3.
Fig. S3.
FcRn controls the loss of albumin-bound APAP into the bile and hepatocyte sensitivity to oxidative stress. (A) hFcRn staining and confocal microscopy of livers from FCGRTTG and Fcgrt/− mice (Inset). White circles indicate areas of intracellular vesicular FcRn expression, white arrows indicate FcRn expression on sinusoidal membranes, and white arrowheads indicate canalicular FcRn expression (red: FcRn, rabbit anti-hFcRn-CT, anti-Rabbit Alexa568; blue: DAPI). (Magnification: Top, 63×; Bottom, 252×; Insets were taken with the same magnification and subsequently reduced (scaled down) by 60%.) (B and C) Detection of albumin-bound APAP (arrow) using HPLC after albumin was isolated from the bile of Fcgrt−/− mice administered with a sublethal dose of APAP (B) and from untreated mice (C). (D) As positive control, albumin isolated from the bile of Fcgrt−/− mice was mixed with 200 μM APAP and was applied for the HPLC analysis. (E) SPR analysis of human albumin binding to immobilized shFcRn upon association with APAP, NAPQI, or fatty acid C18 at pH 6.0. (FH) Intracellular levels of ROS (F and G) and viability (H) of MDCK II cells expressing hβ2m (vector), hFcRn and hβ2m (hFcRn/hβ2m), hFcRn, hβ2m, and human albumin (hFcRn/hβ2m/hAlbumin), or hβ2m and human albumin only (hβ2m/hAlbumin) (***P < 0.0005; **P < 0.005; *P < 0.05). Levels of oxidative stress were determined using CM-H2DCFDA, which is oxidized to fluorescent DCF. Viability was determined by 7-AAD staining. Cells were left untreated or were treated with different concentrations of H2O2 (F and H) or APAP (G) to increase intracellular levels of oxidative stress and mortality. The percentage change (%Δ) in ROS (F and G) was calculated by subtracting the DCF mean fluorescence intensity (MFI) of untreated cells from the DCF MFI of cells treated with H2O2 (F) or APAP (G). (H) The percentage change in dead cells was determined by subtracting the percentage of dead cells in the untreated cell population from the percentage of dead cells in the population of cells treated with 7-AAD+ or H2O2. Data in FH were statistically analyzed by two-way ANOVA with Fisher’s LSD post hoc test.
Fig. 4.
Fig. 4.
Antibody- or peptide-mediated disruption of the human FcRn–albumin interactions decreases chemical hepatotoxicity. (A) Transcytosis of human albumin in MDCK II cells expressing hFcRn and hβ2m (hFcRn) or hβ2m alone (vector) in the presence of ADM31 or IgG2b (***P < 0.001). Open circles represent replicates. (B and C) Survival curves after lethal (600 mg/kg) APAP administration (B) and serum ALT levels 8 h after sublethal APAP administration (400 mg/kg) (C) in Fcgrt−/− mice (n = 8–14), untreated FCGRTTG mice (n = 4–7), and FCGRTTG mice that received either ADM31 (n = 6–10) or IgG2b isotype control (n = 5–9) (30 mg/kg) 16 h before APAP administration (***P = 0.0002 in B; *P = 0.0391, **P = 0.0021, ***P < 0.0004 in C). (D and E) Liver H&E staining (D) and cumulative pathology scores (E) from PBS-treated FCGRTTG mice and FCGRTTG mice that received either ADM31 or IgG2b isotype control 16 h before APAP administration, as above (n = 3; ***P < 0.0002). (F) Illustration of the solved cocrystal structure of the shFcRn:hβ2m:(SYN1753)2 complex. The FcRn heavy chain (red) with hβ2m (blue) interacts with two SYN1753 peptides (yellow and green spheres indicated by yellow and green arrows). These figures were drawn using the PyMOL program (www.pymol.org). (G) Space-fill representation highlighting the pair of SYN1753 peptides bound to the FcRn surface around Phe157 (magenta) and the close proximity (red circles) of the N terminus of the first SYNT1753 peptide (yellow sticks) to the C terminus of the second SYNT1753 peptide (green sticks) that led to the generation of SYNT3258 peptide. (H) Both SYN1753 peptides are centered around FcRn residues F157, H161, and H166. (I) The area of SYN1753 peptides interaction with FcRn spans the area of FcRn-albumin (metallic blue) interaction. (J) Serum ALT levels 24 h after a lethal dose of APAP was administered to FCGRTTG mice to which SYN3258 or a cyclic control peptide were continuously delivered at a dose of 40 mg/kg body weight per day via an i.p. pump (n = 6, *P < 0.05). Data were analyzed statistically by one-way ANOVA (E and J), two-way ANOVA with Fisher’s LSD post hoc test (A and C), or Mantel–Cox test (B). IQR, interquartile range; U/L, units per liter. (Magnification: 40× in D.)
Fig. S4.
Fig. S4.
Blockade of human FcRn–albumin interactions with a monoclonal antibody or peptide mimetic protects against hepatotoxicity. (A) Serum and bile albumin levels in FCGRTTG mice 24 h after treatment with 30 mg/kg ADM31 or IgG2b isotype control (n = 3–5; ***P < 0.0001). (B and C) Primary hepatocytes were isolated from FCGRTTG mice and were treated with 50 μg/mL ADM31 or IgG2b isotype control for 16 h; then hepatocytes were collected, lysed in radioimmunoprecipitation (RIPA) buffer, and immunoblotted for mouse albumin and β-actin. (B) Representative blots. (C) Compiled results are presented as a bar graph of the albumin:β-actin ratio; *P = 0.043. (D and E) FCGRTTG mice were treated with PBS, 30 mg/kg ADM31, or IgG2b isotype control 16 h before APAP administration. Livers were collected 2 h post APAP administration, lysed, and immunoblotted for p-JNK, JNK, or GAPDH. (D) Representative blots. (E) Compiled results are presented as a bar graph of the p-JNK:JNK ratio (n = 3; *P = 0.036; **P = 0.007). (F and G) Serum (F) and bile (G) albumin levels 8 h after sublethal APAP administration (400 mg/kg) in Fcgrt+/+ mice, Fcgrt−/− mice, untreated FCGRTTG mice, or FCGRTTG mice that received either ADM31 or IgG2b isotype control (30 mg/kg) 16 h before APAP administration (n = 8–10 in F; n = 3 in G except for untreated FCGRTTG mice, n = 1); *P = 0.0181, **P < 0.006; ***P < 0.0007, ****P < 0.0001. (H) Transcytosis of human albumin in MDCK II cells coexpressing hFcRn and hβ2m in the presence of the monomeric peptide inhibitor SYN1753, the dimeric peptide inhibitor SYN3258, or a scrambled peptide control (***P < 0.001). (I and J) Survival curves (I) and serum and bile albumin levels (J) 24 h after a lethal dose of APAP (600 mg/kg) was administered to FCGRTTG mice that were delivered SYN3258 or a cyclic control peptide continuously via an i.p. pump at a dose of 40 mg/kg body weight per day (n = 6; **P < 0.01). Data were statistically analyzed by one-way ANOVA (C and EG), two-way ANOVA with Fisher’s LSD post hoc test (A, H, and J), or Mantel–Cox test (I).
Fig. 5.
Fig. 5.
Therapeutic disruption of the human FcRn–albumin interaction decreases chemical toxicity. (A) Serum ALT levels 8 h after sublethal APAP administration (400 mg/kg) in Fcgrt−/− mice or FCGRTTG mice that received NAC (140 mg/kg), ADM31, or IgG2b isotype control (30 mg/kg) via i.v. injection 2 h after APAP administration. (n = 4–15 from three pooled experiments; *P < 0.05; **P < 0.01). (B) Serum ALT levels 6 and 8 h after APAP administration (400 mg/kg) in FCGRTTG mice that received PBS, NAC (140 mg/kg), SYNT002-8, or IgG4 isotype control (10 mg/kg) 2 h after APAP administration (n = 3–5; *P < 0.05; **P < 0.0038; ***P < 0.001). Data were statistically analyzed by one-way ANOVA (A) or two-way ANOVA with Fisher’s LSD post hoc test (B). IQR, interquartile range; U/L, units per liter.
Fig. S5.
Fig. S5.
Characterization of humanized monoclonal antibody SYNT002-08 that blocks hFcRn–albumin interactions. (A) Schematic of therapeutic antibody treatment in FCGRTTG mice. (B) Survival curves of Fcgrt−/− mice or FCGRTTG mice that received PBS, ADM31, or IgG2b isotype control antibodies (30 mg/kg) 2 h after the administration of a lethal dose APAP (600 mg/kg) (n = 4–8 animals per group). (C and D) Binding of titrated amounts of shFcRn injected over immobilized SYNT002-8 at acidic (pH 6.0) (C) or neutral (pH 7.4) (D) conditions. (E) Administration of SYNT002-08 antibody increases albumin serum elimination in FCGRTTGAlb−/− mice. Results are presented as the log10 of the mean percentage (±SEM) of human albumin remaining at the indicated time points (compared with the 24-h baseline). Curves represent a nonlinear regression analysis with 90% confidence intervals. The slopes of these curves ± SD were analyzed by one-way ANOVA (n = 5–11; *P = 0.031; **P = 0.0069; ***P = 0.0003; ****P < 0.0001). Data in B were statistically analyzed by Mantel–Cox test.

Similar articles

Cited by

References

    1. Roopenian DC, et al. The MHC class I-like IgG receptor controls perinatal IgG transport, IgG homeostasis, and fate of IgG-Fc-coupled drugs. J Immunol. 2003;170(7):3528–3533. - PubMed
    1. Ober RJ, Martinez C, Lai X, Zhou J, Ward ES. Exocytosis of IgG as mediated by the receptor, FcRn: An analysis at the single-molecule level. Proc Natl Acad Sci USA. 2004;101(30):11076–11081. - PMC - PubMed
    1. Chaudhury C, et al. The major histocompatibility complex-related Fc receptor for IgG (FcRn) binds albumin and prolongs its lifespan. J Exp Med. 2003;197(3):315–322. - PMC - PubMed
    1. Raghavan M, Bonagura VR, Morrison SL, Bjorkman PJ. Analysis of the pH dependence of the neonatal Fc receptor/immunoglobulin G interaction using antibody and receptor variants. Biochemistry. 1995;34(45):14649–14657. - PubMed
    1. Ward ES, Zhou J, Ghetie V, Ober RJ. Evidence to support the cellular mechanism involved in serum IgG homeostasis in humans. Int Immunol. 2003;15(2):187–195. - PubMed

Publication types

MeSH terms

Associated data