. 2017 May;35(5):463-474.
doi: 10.1038/nbt.3834. Epub 2017 Mar 20.

Synergistic drug combinations for cancer identified in a CRISPR screen for pairwise genetic interactions

Affiliations

Synergistic drug combinations for cancer identified in a CRISPR screen for pairwise genetic interactions

Kyuho Han et al. Nat Biotechnol. 2017 May.

Abstract

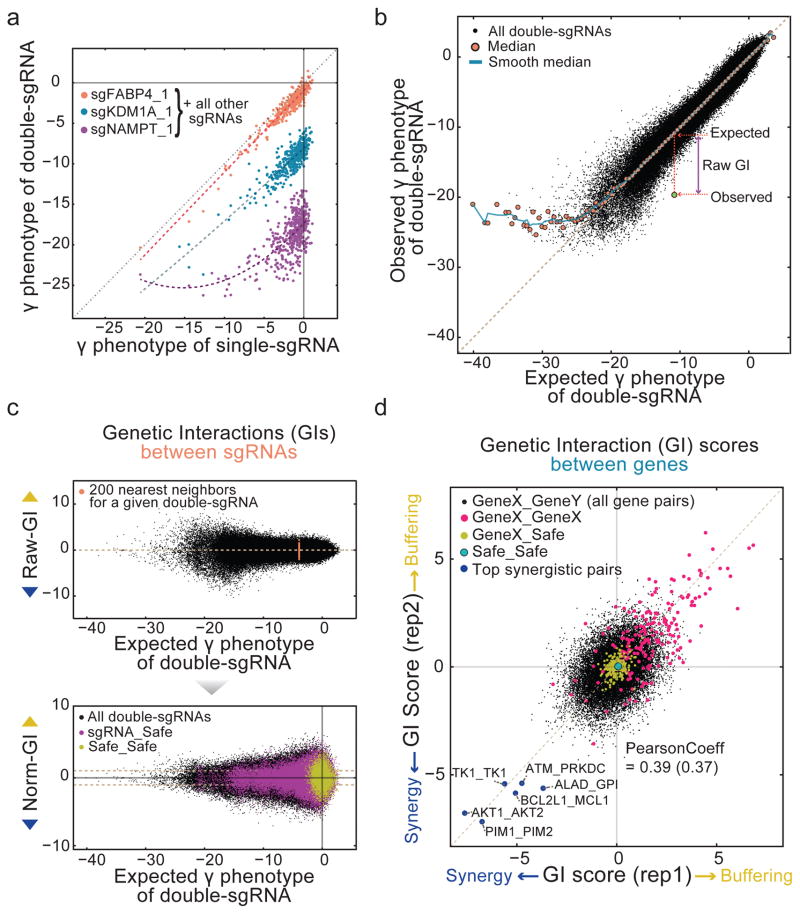
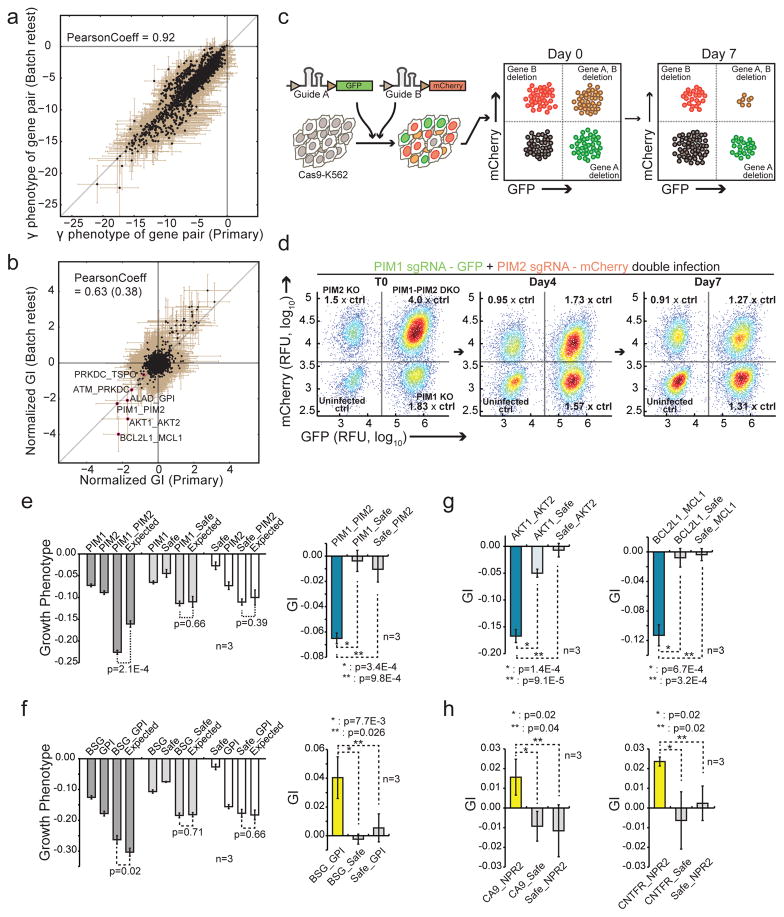
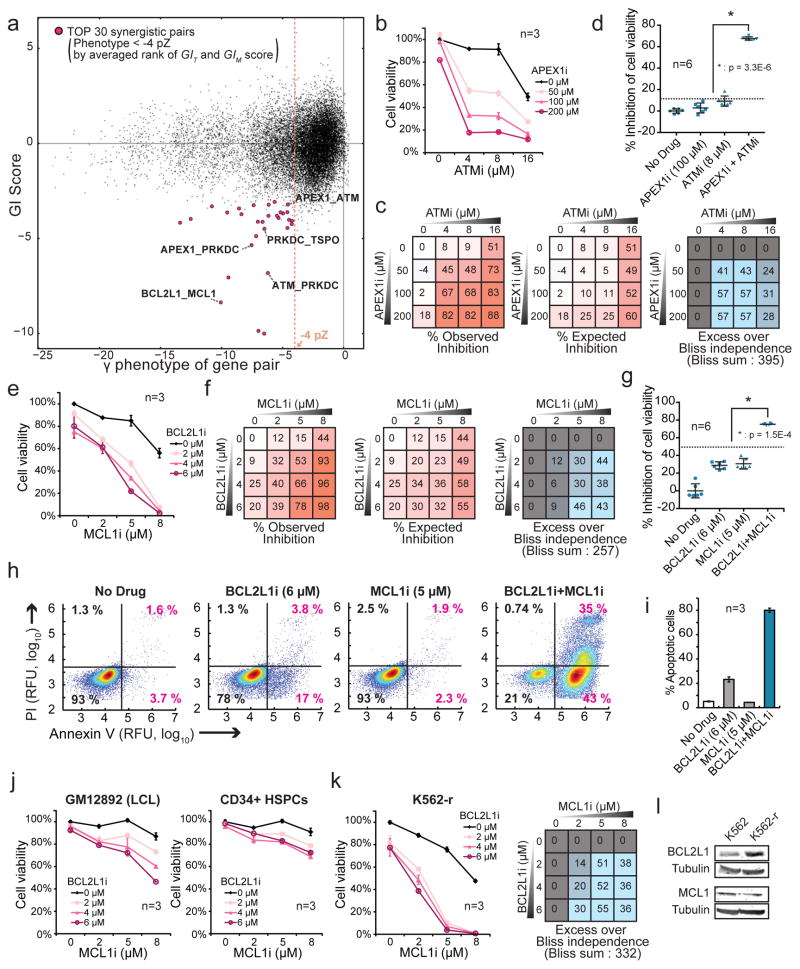
Identification of effective combination therapies is critical to address the emergence of drug-resistant cancers, but direct screening of all possible drug combinations is infeasible. Here we introduce a CRISPR-based double knockout (CDKO) system that improves the efficiency of combinatorial genetic screening using an effective strategy for cloning and sequencing paired single guide RNA (sgRNA) libraries and a robust statistical scoring method for calculating genetic interactions (GIs) from CRISPR-deleted gene pairs. We applied CDKO to generate a large-scale human GI map, comprising 490,000 double-sgRNAs directed against 21,321 pairs of drug targets in K562 leukemia cells and identified synthetic lethal drug target pairs for which corresponding drugs exhibit synergistic killing. These included the BCL2L1 and MCL1 combination, which was also effective in imatinib-resistant cells. We further validated this system by identifying known and previously unidentified GIs between modifiers of ricin toxicity. This work provides an effective strategy to screen synergistic drug combinations in high-throughput and a CRISPR-based tool to dissect functional GI networks.


Conflict of interest statement

COMPETING FINANCIAL INTERESTS

The authors declare no competing financial interest.

Figures

Figure 1
Figure 1. Development of a CRISPR double knockout (CDKO) platform to identify novel cancer drug combinations in high throughput
(a) Drug combinations will be modeled by developing a dual sgRNA system to simultaneously knock out corresponding drug targets. (b) Design of i) a Csy4-based double-sgRNA expression system and ii) a dual promoter-based system; flow cytometry analysis of GFP and mCherry knockout efficiency. (c) Schematic of double-sgRNA library generation. Two sets of pooled oligos were synthesized, amplified, and ligated into separate lentiviral vectors with either human or mouse U6 promoters. sgRNA cassettes were digested out from the hU6 library and ligated into the mU6 library as a pool to create the double-sgRNA CDKO library. (d) Design of drug-targeting sgRNA library. (e) Experimental strategy: Separate mU6-driven and hU6-driven single sgRNA libraries were ligated together into a pooled dual sgRNA library. Cas9-expressing K562 cells were infected with the pooled high-coverage CDKO library, selected with puromycin, and grown in bioreactors at 1000X coverage for ~14 days. The frequency of the dual sgRNA elements in the final population and original plasmid library were quantified by deep sequencing to calculate the growth phenotype and genetic interaction of each DKO gene pair. Potent synergistic pairs were validated in vitro using pairs of drugs.
Figure 2
Figure 2. 490,000-element DrugTarget-CDKO library can be efficiently assembled and delivered into cells and shows no positional bias
(a) Cumulative distribution of sequencing reads for double-sgRNAs. Read counts were normalized by total reads of each sample and the cumulative sums of double-sgRNAs were plotted as relative percentages of the number of expected double-sgRNAs. (b) Histogram showing the number of double-sgRNAs per gene pair. 98.7% of the 42,319 detected gene pairs have more than 6 double-sgRNA combinations. (c) Growth (γ) phenotypes for two single genes and the corresponding gene pair were calculated from the double-sgRNA frequencies in the T14 sample and plasmid library. For γ phenotypes of single genes, all possible double-sgRNA combinations of the 3 gene-targeting sgRNAs and 79 safe-sgRNAs were measured. For the γ phenotype of a given gene pair, 9 double-sgRNA combinations were measured. Blue dotted lines mark the minimum threshold for read counts (50). (d) Minimal positional bias in the DrugTarget-CDKO library. γ phenotypes of double-sgRNAs were compared between both orientations. (e) High reproducibility of measured γ phenotypes between two experimental replicates.
Figure 3
Figure 3. Strategy to calculate quantitative genetic interaction scores
(a) Single-sgRNA γ phenotypes plotted against corresponding double-sgRNA γ phenotypes in combination with a sgRNA of interest. sgRNAs paired with a weak or moderate γ phenotype sgRNA (FABP4 or KDM1A) showed a linear relationship between single-sgRNA and double-sgRNA γ phenotypes. For sgRNAs paired with a strong γ phenotype sgRNA (NAMPT), γ phenotypes of double-sgRNAs quickly leveled off as γ phenotypes of single-sgRNAs become more negative. Dotted lines mark polynomial fitting (n=2). (b) Measuring genetic interactions of double-sgRNAs as deviations from the expected double-sgRNA γ phenotype. Observed and expected γ phenotypes of all double-sgRNAs were plotted (black dots). Expected γ phenotypes were calculated by sum of the two single sgRNA γ phenotypes. Medians of binned data were plotted (orange closed circle) and connected by a smooth median line (blue line). Deviations from the median line were defined as genetic interactions (see methods). (c) Raw-GIs were plotted against the expected γ phenotypes of double-sgRNAs (top panel). Positive raw-GIs are buffering while negative Raw-GIs are synergistic. Each Raw-GI was normalized by the standard deviation of the 200 nearest neighbors in terms of the expected γ phenotype. Normalized GIs (Norm-GI) were then plotted (bottom panel). In this plot, double-sgRNAs comprised of only safe-sgRNA pairs (yellow dots) and all sgRNAs paired with safe-sgRNAs (purple dots) showed symmetric distributions centering around 0 Norm-GI, confirming that safe-sgRNAs generally do not interact with other sgRNAs. (d) T-value based GIT scores (see methods) plotted between two experimental replicates. GI scores of control pairs - genes paired with safe-sgRNAs (yellow dots) and Safe_Safe pairs (cyan closed circle) - showed negligible genetic interactions as expected. Gene pairs comprised of same genes are marked as pink dots. The five most synergistic pairs by rank-sum of GIT scores of two replicates are marked as dark blue dots. The Pearson correlation after same-gene targeting pairs were removed is reported in parentheses.
Figure 4
Figure 4. A CRISPR-based GI map of ricin pathway regulators validates the CDKO platform
(a) Correlations of GI profiles between two sgRNAs were compared between two experimental replicates. sgRNAs targeting the same gene are marked in pink. The pearson correlation after same-gene targeting pairs were removed is reported in parentheses. (b) The distributions of correlations of GI profiles for all sgRNA pairs (blue) and for sgRNAs pairs targeting the same gene (orange). Medians of the distributions are marked with the dotted lines. (c) GI map of ricin modulators. GIM scores of all gene pairs were calculated and color-coded by a yellow-cyan heatmap. Genes were hierarchically clustered by their correlation of GI profiles. ρ phenotypes of individual genes were marked in sidebars with a red-blue heatmap. Previously reported protein complexes are labeled. (d) Plot showing the percentage of the top N gene pairs that have corresponding protein interactions in the STRING database, sorted by correlation of GI profiles (orange), buffering GIs (blue), or synergistic GIs (brown) for known protein interactions. Randomly sorted gene pairs were marked in pink. Data were plotted for N>10. (e) Relationship between the correlation of GI profiles and the predictive power for known protein interactions. Percentage of reported PPIs from STRING were averaged over a moving window of 20 data points against the correlation of GI profiles.
Figure 5
Figure 5. Validation of predicted genetic interactions using individual sgRNAs
(a) Reproducibility between γ phenotypes in the primary and batch retest DrugTarget-CDKO screens. Data represent mean ± SEM. (b) Reproducibility between Norm-GIs in the primary and batch retest screens. Data represent mean ± SEM. The Pearson correlation after same-gene targeting pairs were removed is reported in parentheses. (c) Schematic for dual sgRNA validation assay. Cas9-expressing K562 cells were infected with lentiviruses expressing one sgRNA in a GFP vector and another sgRNA in an mCherry vector. The abundances of the four resulting fluorescent populations (uninfected, GFP, mCherry, and GFP+mCherry) were measured after 7 days. (d) K562 cells expressing a PIM1-targeting sgRNA (GFP) and a PIM2-targeting sgRNA (mCherry). The growth phenotype is calculated by measuring the relative depletion of the single-infected and double-infected cells at day 7 vs. day 0. (e,f) Quantification of growth phenotypes and genetic interaction scores for indicated double sgRNA infections compared to single sgRNA_safe-targeting controls (see methods). The PIM1_PIM2 sgRNA pair is synergistic as predicted while the BSG_GPI pair is buffering as predicted. Data represent mean ± SD from 3 replicate cultures. (g,h) Additional high-confidence synergistic and buffering gene pairs validate with predicted genetic interactions. Data represent mean ± SD (n=3) from replicate cultures.
Figure 6
Figure 6. Predicted synergistic gene pairs translate to synergistic drug combinations
(a) GIT scores and γ phenotypes of gene pairs were plotted together. We set a γ phenotype cutoff of −4 pZ for strongly toxic drug combinations and highlight the 30 most synergistic gene pairs by rank-sum of GIT and GIM scores (marked in pink). (b,e) K562 cells were treated with (b) APEX1 (CRT0044876) and ATM (KU-60019) inhibitors or (e) BCL2L1 (A-1155463) and MCL1(A-1210477) inhibitors alone and in combination at the indicated concentrations for 72 h. Cell viability relative to the no drug control was determined by measuring live cell number using flow cytometry (FSC/SSC). (c,f) Drug synergy represented by excess over Bliss independence is calculated by subtracting the % expected inhibition from the % observed inhibition at each combination of drug doses. (d,g) % inhibition of cell viability upon treatment with the indicated inhibitors in a separate experiment with 6 replicate cultures. P-values represent significant differences by one-tailed t-test between the observed effect of the drug combination and the expected effect (dotted lines) based on the Bliss independence model. (h,i) K562 cells were treated with indicated drugs for 48 h and assessed by flow cytometry for Annexin V-FITC and propidium iodide (PI) staining. Plots in h are representative of three independent experiments and the percentages of Annexin V positive cells are quantified in i. (j,k) Cell viability plots for GM12892 (LCL) and CD34+ (bone marrow-derived hematopoietic stem-progenitor) cells in j or imatinib-resistant K562 cells in m treated with BCL2L1 (A-1155463) and MCL1(A-1210477) inhibitors alone and in combination at the indicated doses for 72 h. (l) BCL2L1 and MCL1 protein levels were compared by immunoblot analysis between lysates from parental and imatinib-resistant K562 cells. Data represent mean ± SD from 3 replicate cultures unless otherwise noted.

Comment in

Similar articles

Cited by

  • A genome-wide atlas of co-essential modules assigns function to uncharacterized genes.
    Wainberg M, Kamber RA, Balsubramani A, Meyers RM, Sinnott-Armstrong N, Hornburg D, Jiang L, Chan J, Jian R, Gu M, Shcherbina A, Dubreuil MM, Spees K, Meuleman W, Snyder MP, Bassik MC, Kundaje A. Wainberg M, et al. Nat Genet. 2021 May;53(5):638-649. doi: 10.1038/s41588-021-00840-z. Epub 2021 Apr 15. Nat Genet. 2021. PMID: 33859415 Free PMC article.
  • Characterization of cancer omics and drug perturbations in panels of lung cancer cells.
    Suzuki A, Onodera K, Matsui K, Seki M, Esumi H, Soga T, Sugano S, Kohno T, Suzuki Y, Tsuchihara K. Suzuki A, et al. Sci Rep. 2019 Dec 20;9(1):19529. doi: 10.1038/s41598-019-55692-9. Sci Rep. 2019. PMID: 31863083 Free PMC article.
  • A case of mistaken identity.
    Hanna RE, Doench JG. Hanna RE, et al. Nat Biotechnol. 2018 Sep 6;36(9):802-804. doi: 10.1038/nbt.4208. Nat Biotechnol. 2018. PMID: 30188534 No abstract available.
  • Gene editing and its applications in biomedicine.
    Li G, Li X, Zhuang S, Wang L, Zhu Y, Chen Y, Sun W, Wu Z, Zhou Z, Chen J, Huang X, Wang J, Li D, Li W, Wang H, Wei W. Li G, et al. Sci China Life Sci. 2022 Apr;65(4):660-700. doi: 10.1007/s11427-021-2057-0. Epub 2022 Feb 18. Sci China Life Sci. 2022. PMID: 35235150 Free PMC article. Review.
  • CRISPR in cancer biology and therapy.
    Katti A, Diaz BJ, Caragine CM, Sanjana NE, Dow LE. Katti A, et al. Nat Rev Cancer. 2022 May;22(5):259-279. doi: 10.1038/s41568-022-00441-w. Epub 2022 Feb 22. Nat Rev Cancer. 2022. PMID: 35194172 Review.

References

    1. Jia J, et al. Mechanisms of drug combinations: interaction and network perspectives. Nat Rev Drug Discov. 2009;8:111. - PubMed
    1. Ashburn TT, Thor KB. Drug repositioning: identifying and developing new uses for existing drugs. Nat Rev Drug Discov. 2004;3:673–683. - PubMed
    1. Al-Lazikani B, Banerji U, Workman P. Combinatorial drug therapy for cancer in the post-genomic era. Nat Biotechnol. 2012;30:679–692. - PubMed
    1. Sun X, Vilar S, Tatonetti NP. High-Throughput Methods for Combinatorial Drug Discovery. Sci Transl Med. 2013;5:205rv1–205rv1. - PubMed
    1. Collins SR, Weissman JS, Krogan NJ. From information to knowledge: new technologies for defining gene function. Nat Methods. 2009;6:721–723. - PMC - PubMed

Publication types

MeSH terms

Substances