. 2017 Mar 9;4(1):ENEURO.0255-16.2017.
doi: 10.1523/ENEURO.0255-16.2017. eCollection 2017 Jan-Feb.

NEUROD2 Regulates Stim1 Expression and Store-Operated Calcium Entry in Cortical Neurons

Affiliations

NEUROD2 Regulates Stim1 Expression and Store-Operated Calcium Entry in Cortical Neurons

Gokhan Guner et al. eNeuro. .

Abstract

Calcium signaling controls many key processes in neurons, including gene expression, axon guidance, and synaptic plasticity. In contrast to calcium influx through voltage- or neurotransmitter-gated channels, regulatory pathways that control store-operated calcium entry (SOCE) in neurons are poorly understood. Here, we report a transcriptional control of Stim1 (stromal interaction molecule 1) gene, which is a major sensor of endoplasmic reticulum (ER) calcium levels and a regulator of SOCE. By using a genome-wide chromatin immunoprecipitation and sequencing approach in mice, we find that NEUROD2, a neurogenic transcription factor, binds to an intronic element within the Stim1 gene. We show that NEUROD2 limits Stim1 expression in cortical neurons and consequently fine-tunes the SOCE response upon depletion of ER calcium. Our findings reveal a novel mechanism that regulates neuronal calcium homeostasis during cortical development.

Keywords: Neurod2; calcium; genomics; store-operated calcium entry; transcription factor.


Figures
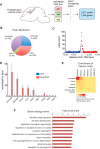
Figure 1.
Figure 1.
Identification of genome-wide NEUROD2 binding sites at postnatal day 0 cerebral cortex. A, NEUROD2 ChIP-Seq was performed on cerebral cortex tissue using three separate antibodies. Selecting for overlapping peaks in all three datasets revealed 2,071 high confidence binding sites mapping to 1,328 annotated genes. B, Distribution of midpoints of NEUROD2 binding sites based on mouse Ensembl transcripts. Midpoints mapping within ± 1000 bp of TSSs are accepted as promoter binding. C, The number of NEUROD2 binding regions is plotted as a function of the distance of their midpoints to the closest TSS. A clear binding preference for NEUROD2 within ± 1000 bp is observed. D, Quantification of NEUROD2 binding to target and nontarget regions by ChIP-qPCR. Template DNA is immunoprecipitated with NEUROD2 antibody or an unrelated GFP antibody as a negative control. Amount of DNA immunoprecipitated is expressed as percentage of input DNA (% input). NEUROD2 % input values are normalized to GFP % input values as described in Materials and Methods. Enrichment of NEUROD2 is detected at target regions located on Neurod6, Bhlhe22, Nrcam, and Cux1 genes, but not at nontarget regions on Dlx2, Npy, and Gad1 genes. Slight enrichment is also observed in nontarget genes Gsx2 and Calb2. Bars represent SEM. p < 0.0001 determined by one-way ANOVA followed by unpaired t test, *p < 0.05, **p < 1 × 10⁻⁴ (Table 2). E, Enrichment of histone marks within NEUROD2 peaks located within different genomic regions is represented as a heat map. Genome-wide enrichment of histone marks, including NEUROD2 target and nontarget sequences, are plotted as baseline controls. F, Gene ontology analysis of all 1,328 genes identifies dendrite morphogenesis and synaptic organization as the two main NEUROD2-regulated biological processes. Significantly enriched GO categories (p < 0.01) are ranked based on their fold enrichment.
Figure 2.
Figure 2.
NEUROD2 binds to a conserved intronic element within the Stim1 gene. A, Input DNA or ChIP-Seq tracks acquired from three separate NEUROD2 antibodies or various histone modifications along the Stim1 gene are plotted. B, The midpoint of a 50 bp sliding window across a 550 bp stretch is plotted as a function of its average evolutionary conservation score (PhyloP score). Blue and green traces represent the average of 20 randomly selected exonic or intronic sequences within the Stim1 gene, respectively. The red trace represents the NEUROD2 binding sequence within intron 2. C, The midpoint of a 50 bp sliding window encompassing the NEUROD2 binding sequence within intron 2 is plotted as a function of NEUROD2 ChIP-Seq score (MACS score from NEUROD2 ChIP-Seq with antibody 2). Red lines denote the locations of E-boxes. D, E, A closer view of Stim1 promoter and intronic element are presented. Enrichment of promoter-associated histone modifications H3K4me3 and H3K27ac are observed proximal to Stim1 TSS. While no NEUROD2 binding is observed at the Stim1 promoter, all three antibodies reveal strong enrichment at a specific sequence within intron 2.
Figure 3.
Figure 3.
Verification of NEUROD2 binding to the conserved element within Stim1 intron 2. A, NEUROD2 binding to Stim1 intronic element is confirmed in E14.5 and P0 cortices by ChIP-qPCR. ChIP DNA acquired with an unrelated GFP antibody is used as a negative control. Amount of DNA immunoprecipitated with either a NEUROD2 antibody (NEUROD2 ChIP DNA) or GFP antibody (GFP ChIP DNA) is expressed as percentage of input DNA (% input). NEUROD2 % input values are then normalized to GFP % input values. Strong enrichment of NEUROD2 is detected at the NEUROD2 binding element located in Stim1 intron 2 both in E14.5 and P0 cortices. Slight enrichments are observed for Stim1 introns 1 and 3. Data are representative of six biological replicates each composed of three technical replicates. Bars represent SEM. p < 0.0001 determined by one-way ANOVA followed by unpaired t test, *p < 0.05, **p < 1 × 10⁻⁴, ***p < 1 × 10⁻⁵ (Table 2). B, Luciferase activity is measured from HEK 293T cell lysates that are transfected either with an empty luciferase reporter plasmid (pXPG) or with a luciferase reporter downstream of a wild-type (WT-570) or mutated 570 bp fragment (MUT-570) Stim1 intronic element. In addition, cells are also cotransfected with either an empty (pc4) or NEUROD2 expressing (ND2) pcDNA4 vector. Firefly luciferase activity is normalized to Renilla luciferase signal. Data represent three independent experiments with each sample measured in triplicates. Bars represent SEM. D’Agostino–Pearson test showed normal distribution of the data (α = 0.05). One-way ANOVA and post hoc Tukey’s multiple-comparison analysis was performed, ****p < 0.0001 (Table 2).
Figure 4.
Figure 4.
NEUROD2 suppresses Stim1 expression. A, Immunoblotting analysis reveals that two separate shRNAs (shND2-1 and shND-2) can suppress Neurod2 expression compared with a nonsilencing shRNA (NS) in primary cortical cultures with different efficiencies. B, Neurod2 mRNA levels normalized to Gapdh mRNA is measured by RT-qPCR in cortical cultures transfected with either shND2-1 or shND2-2. While both shRNAs induce an upregulation of Stim1 mRNA, the effect of the more potent shND2-1 is greater. Data represent three biological replicates, each with three technical replicates. One-way ANOVA followed by post hoc Tukey’s test, *p = 0.023. C, D, Primary cortical cultures were transfected with NS shRNA and shND2-1. STIM1 protein levels were quantified by immunoblotting and normalized to histone H3 loading control. Data are presented as bar graphs; the line marks the median; the box represents the 25th and 75th percentiles; top and bottom whiskers mark minima and maxima, respectively. Unpaired t test, p = 0.057. E, resND2-myc, a cDNA resistant to shND2-1, was generated. HEK293T cells were transfected with NS shRNA or shND2-1, along with either ND2-myc or resND2-myc cDNAs. Immunoblotting analysis against the myc epitope revealed that while shND2-1 completely knocked down the expression of ND2-myc, resND2-myc expression was not affected. F, Primary cortical neurons were transfected at low efficiency with shND2-1 either alone or together with resND2-myc and immunofluorescently stained against STIM1 protein. Transfected cells were identified based on their coexpression of mCherry from the shRNA-expressing plasmid. G, H, Quantification of STIM1 immunofluorescence signals from experiments presented in F. Experimenter was blinded to all sample identity during staining and quantification. n = 30 for each condition from two independent experiments. Scale bar, 20 µm. Data are presented as bar graphs; the line marks the median; the box represents the 25th and 75th percentiles; top and bottom whiskers mark minima and maxima, respectively. Nonparametric Kruskal–Wallis test was followed by Dunn’s multiple-comparison analysis, *p < 0.02, **p = 0.0012, ****p < 0.0001 (Table 2).
Figure 5.
Figure 5.
NEUROD2 and STIM1 expression are inversely correlated across cortical development. A, B, Immunoblotting analysis and quantification of protein levels across development in cerebral cortical tissue revealed an inverse correlation between NEUROD2 and STIM1 protein expression. STIM1 protein levels are normalized to the amount of β-actin. Data represents two biological replicates, each quantified as duplicates. Bars represent the SEM. C, Stim1 and Neurod2 mRNA levels were plotted as a function of age in human prefrontal cortex using postmortem tissue. Plots were acquired from braincloud.jhmi.edu (Colantuoni et al., 2011). Similar to mouse data, an inverse correlation in Neurod2 and Stim1 expression was observed in humans as well.
Figure 6.
Figure 6.
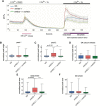
Suppression of Neurod2 expression results in increased SOCE response. A, Primary cortical cultures were transfected with NS shRNA or shND2-1 together with either an empty or shRNA-resistant Neurod2 (resND2) expressing pcDNA4 vector. On the day of imaging, cultures were loaded with calcium-sensitive dye Fluo-3 and imaged by live imaging. Baseline signal was acquired by bathing the cells in Ringer’s buffer containing 2 µm Ca2+. Upon treatment with thapsigargin (Tg) and withdrawal of extracellular Ca2+, a first wave of rise in signal was observed that corresponded to emptying of ER Ca2+ stores (at ∼100 s). A second wave of signal was observed on providing Ca2+ containing Ringer’s buffer that corresponded to store-operated calcium entry (at ∼400 s). B, C, Quantification of initial peak heights for first wave (ER Ca2+ release) and second wave (SOCE) of Ca2+ signals unveiled an increase in SOCE on Neurod2 knockdown that was rescued by coexpression of resND2. D–F, Measurement of the total area under the peaks revealed that ER Ca2+ release was not affected; however, the early phase (∼50 s) but not the late phase of SOCE was significantly upregulated upon Neurod2 suppression. Traces are color coded as follows: NS shRNA (blue); shND2-1 (red); and shND2-1 + resND2 (green). Data are presented as bar graphs; the line marks the median; the box represents the 25th and 75th percentiles; top and bottom whiskers mark minima and maxima, respectively. Neurod2 is abbreviated as ND2. Nonparametric Kruskal–Wallis test was followed by Dunn’s multiple-comparison analysis, **p = 0.0073, ***p = 0.0008 (Table 2).
Figure 7.
Figure 7.
Overexpression of Neurod2 reduces the SOCE response. A, Primary cortical neurons were transfected with either empty or resND2 expressing pcDNA4 vector, and calcium imaging was performed as described in Figure 6A. B, C, Measurement of peak heights of first- and second-wave of Ca2+ signals revealed that overexpression of Neurod2 in otherwise wild-type neurons causes a suppression of SOCE but does not affect steady-state levels of ER Ca2+. D–F, Calculation of total area under peaks demonstrated that both late and early phases of SOCE are downregulated upon Neurod2 overexpression. Traces are color coded as follows: pcDNA4 (blue) and resND2 (orange). Bars represent the SEM. Unpaired t test determined the p value: *p < 0.05. Data are presented as bar graphs; the line marks the median; the box represents the 25th and 75th percentiles; top and bottom whiskers mark minima and maxima, respectively (Table 2). ND2, Neurod2.

Similar articles

Cited by

References

    1. Aizawa H, Hu SC, Bobb K, Balakrishnan K, Ince G, Gurevich I, Cowan M, Ghosh A (2004) Dendrite development regulated by CREST, a calcium-regulated transcriptional activator. Science 303:197–202. 10.1126/science.1089845 - DOI - PubMed
    1. Ashburner M, Ball CA, Blake JA, Botstein D, Butler H, Cherry JM, Davis AP, Dolinski K, Dwight SS, Eppig JT, Harris MA, Hill DP, Issel-Tarver L, Kasarskis A, Lewis S, Matese JC, Richardson JE, Ringwald M, Rubin GM, Sherlock G (2000) Gene ontology: tool for the unification of biology. The Gene Ontology Consortium. Nat Genet 25:25–29. 10.1038/75556 - DOI - PMC - PubMed
    1. Bayam E, Sahin GS, Guzelsoy G, Guner G, Kabakcioglu A, Ince-Dunn G (2015) Genome-wide target analysis of NEUROD2 provides new insights into regulation of cortical projection neuron migration and differentiation. BMC Genomics 16:681 10.1186/s12864-015-1882-9 - DOI - PMC - PubMed
    1. Bert AG, Burrows J, Osborne CS, Cockerill PN (2000) Generation of an improved luciferase reporter gene plasmid that employs a novel mechanism for high-copy replication. Plasmid 44:173–182. 10.1006/plas.2000.1474 - DOI - PubMed
    1. Bormuth I, Yan K, Yonemasu T, Gummert M, Zhang M, Wichert S, Grishina O, Pieper A, Zhang W, Goebbels S, Tarabykin V, Nave KA, Schwab MH (2013) Neuronal basic helix-loop-helix proteins Neurod2/6 regulate cortical commissure formation before midline interactions. J Neurosci 33:641–651. 10.1523/JNEUROSCI.0899-12.2013 - DOI - PMC - PubMed

MeSH terms