. 2017 Jun 1;312(6):L797-L811.
doi: 10.1152/ajplung.00379.2016. Epub 2017 Mar 10.

Alveolar nonselective channels are ASIC1a/α-ENaC channels and contribute to AFC

Affiliations

Alveolar nonselective channels are ASIC1a/α-ENaC channels and contribute to AFC

Phi T Trac et al. Am J Physiol Lung Cell Mol Physiol. .

Abstract

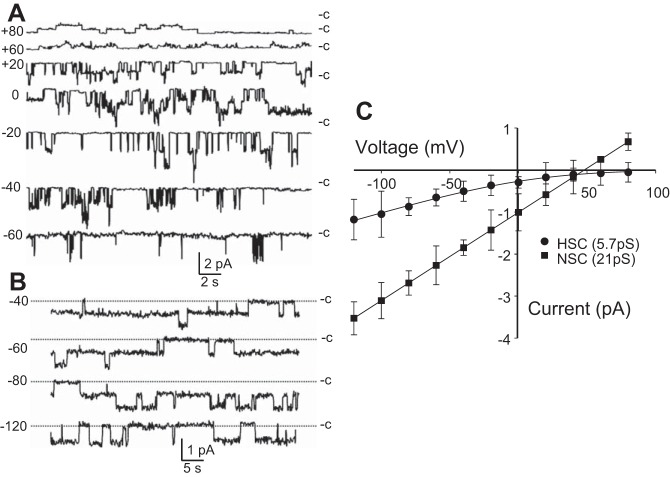
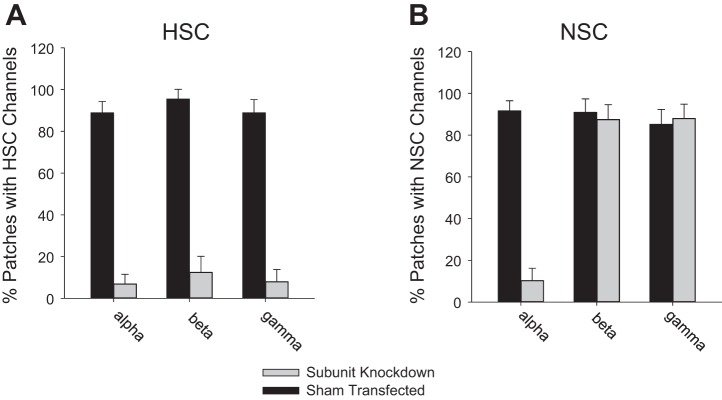
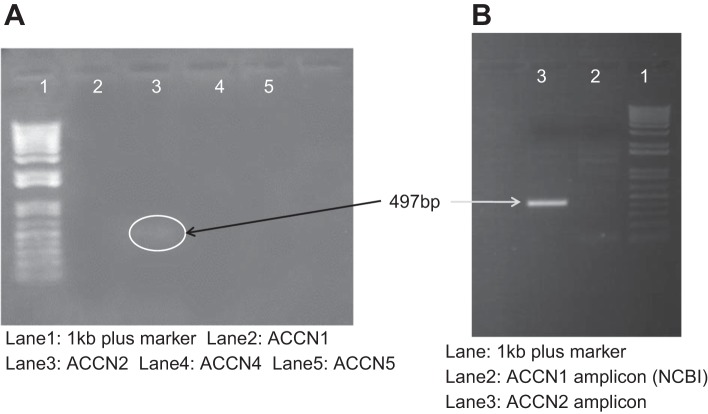
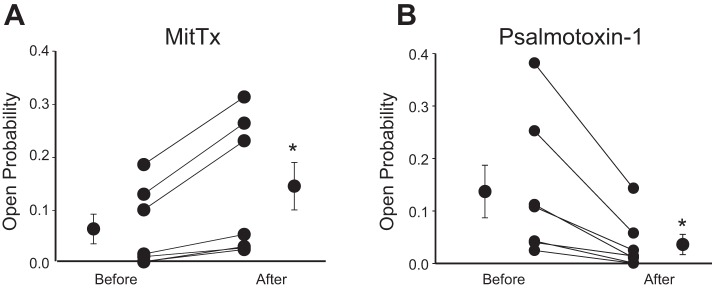
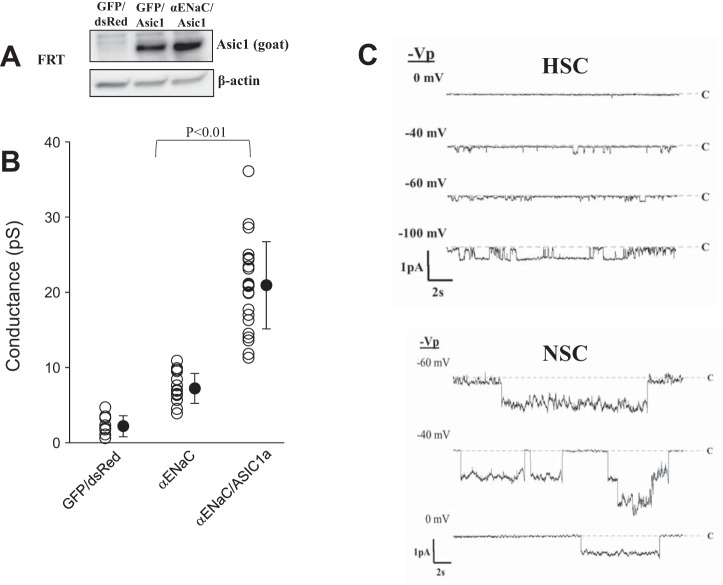
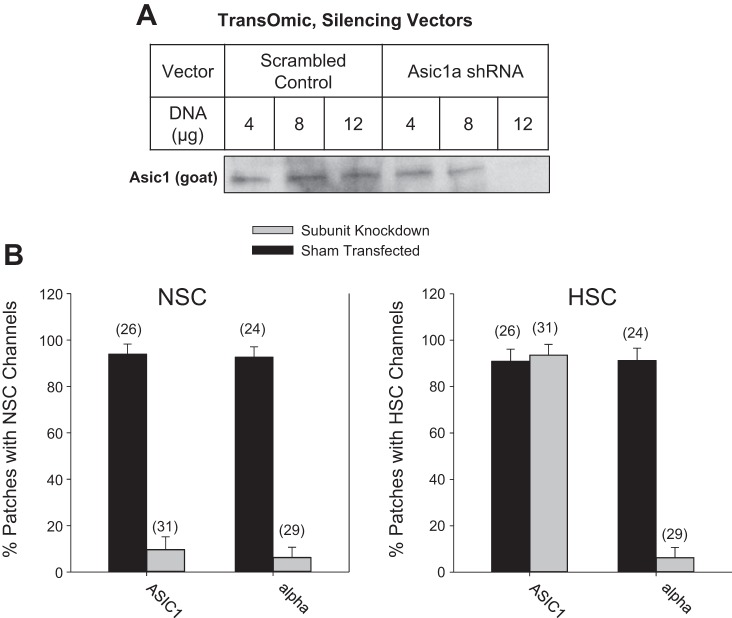
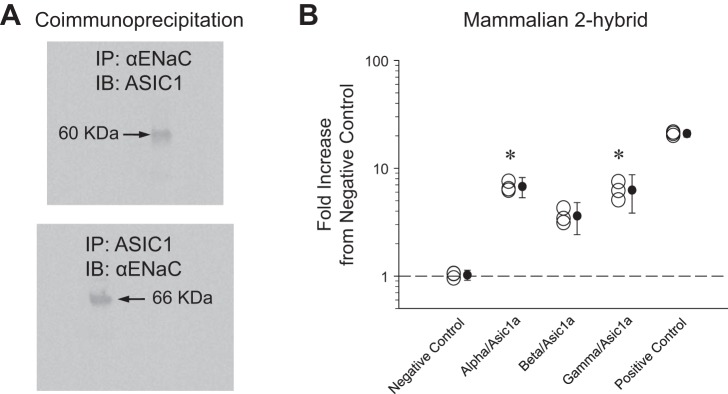
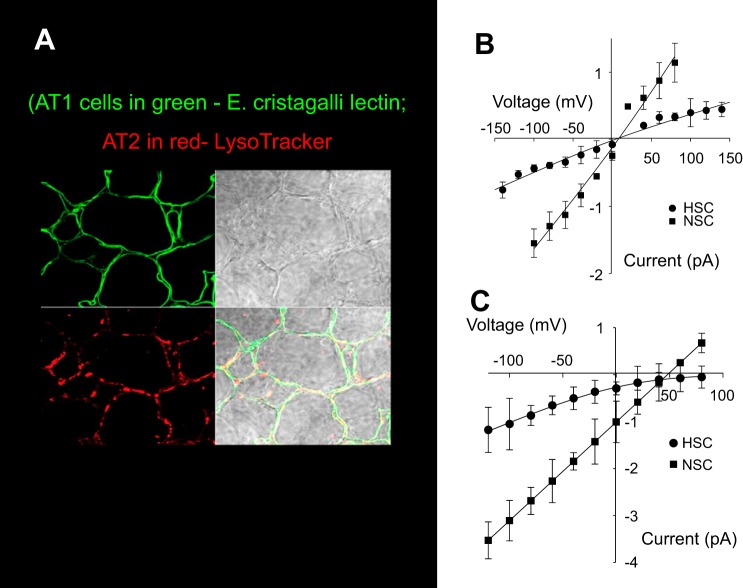
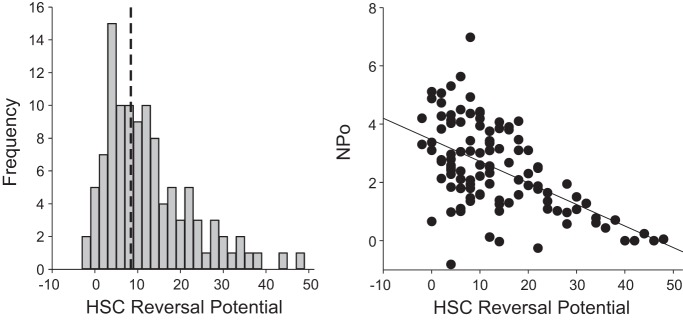
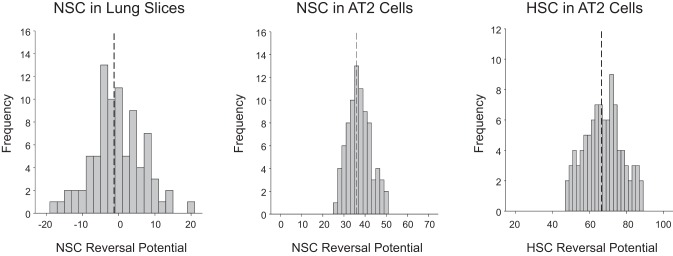
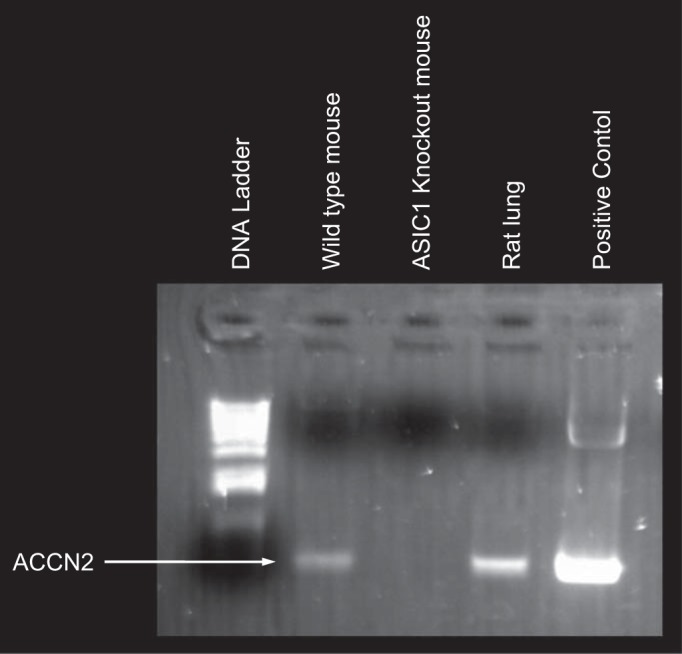
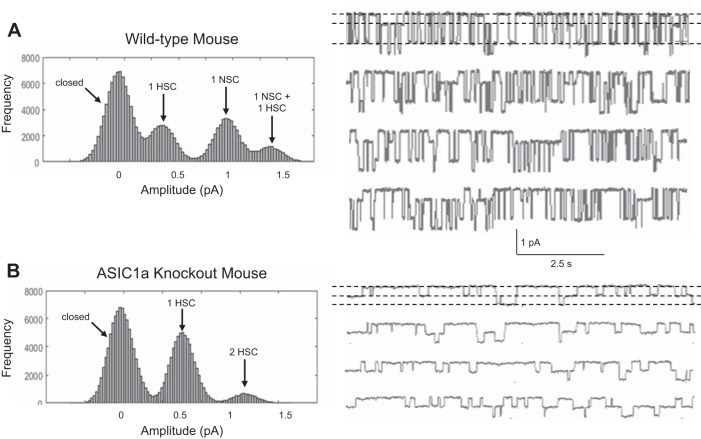
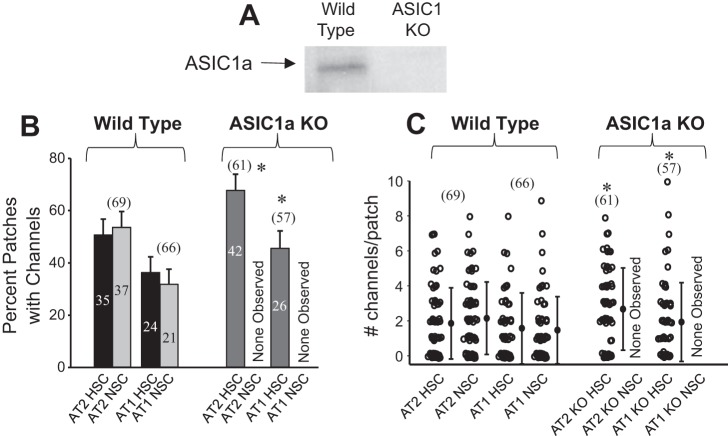
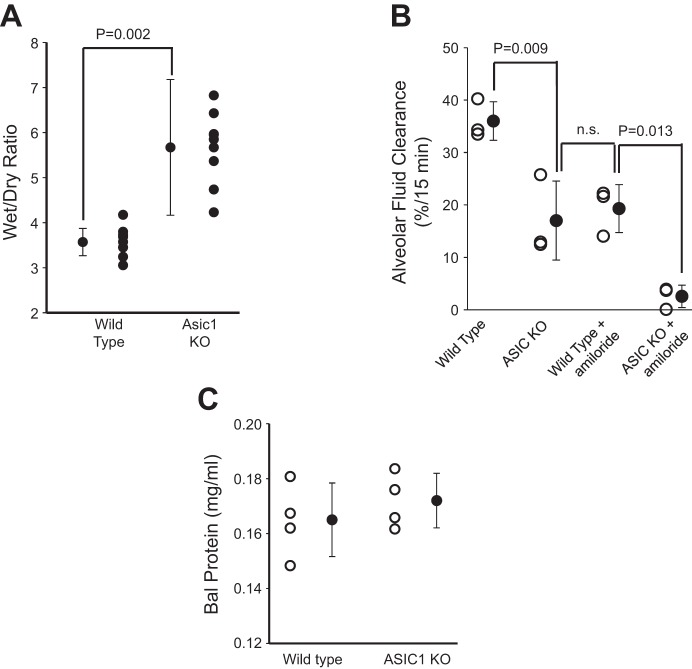
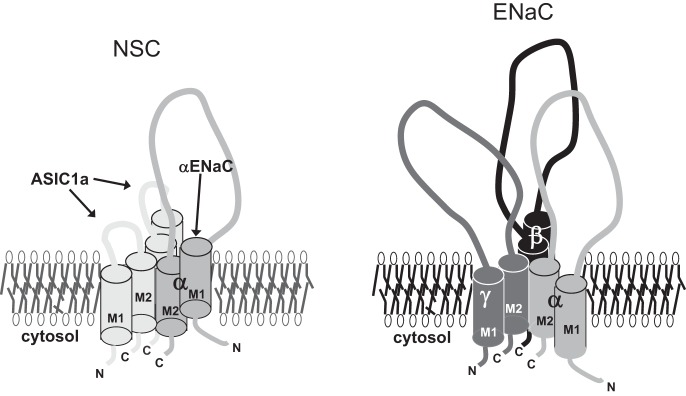
A thin fluid layer in alveoli is normal and results from a balance of fluid entry and fluid uptake by transepithelial salt and water reabsorption. Conventional wisdom suggests the reabsorption is via epithelial Na+ channels (ENaC), but if all Na+ reabsorption were via ENaC, then amiloride, an ENaC inhibitor, should block alveolar fluid clearance (AFC). However, amiloride blocks only half of AFC. The reason for failure to block is clear from single-channel measurements from alveolar epithelial cells: ENaC channels are observed, but another channel is present at the same frequency that is nonselective for Na+ over K+, has a larger conductance, and has shorter open and closed times. These two channel types are known as highly selective channels (HSC) and nonselective cation channels (NSC). HSC channels are made up of three ENaC subunits since knocking down any of the subunits reduces HSC number. NSC channels contain α-ENaC since knocking down α-ENaC reduces the number of NSC (knocking down β- or γ-ENaC has no effect on NSC, but the molecular composition of NSC channels remains unclear). We show that NSC channels consist of at least one α-ENaC and one or more acid-sensing ion channel 1a (ASIC1a) proteins. Knocking down either α-ENaC or ASIC1a reduces both NSC and HSC number, and no NSC channels are observable in single-channel patches on lung slices from ASIC1a knockout mice. AFC is reduced in knockout mice, and wet wt-to-dry wt ratio is increased, but the percentage increase in wet wt-to-dry wt ratio is larger than expected based on the reduction in AFC.

Keywords: acid-sensing ion channel 1a; alveolar fluid clearance; alveoli; lung fluid balance; nonselective cation channels; α-epithelial Na+ channels.


Figures

Fig. 1.
Fig. 1.
Electrophysiologic characteristics of NSC and HSC channels in AT2 cells in primary culture. A: representative traces for NSC channels with a conductance of γ = 21 pS. B: representative traces for HSC channels with a conductance of γ = 6 pS. “C” marks the level with all channels closed. C: current-voltage plots for HSC and NSC. Nonlinear HSC current-voltage relationship and very positive reversal potential are characteristic of ENaC in other cell types and heterologous expression systems. Each point is the mean ± SD of three or more determinations. Fits (solid lines) are to the Goldman-Hodgkin-Katz equation (7, 38, 44).
Fig. 2.
Fig. 2.
Expression of α-ENaC regulates NSC channel frequency. Knockdown of α-, β-, or γ-ENaC subunits in an AT2 cell line, L2, with shRNA silencing vectors in lentivirus. A: percentage of patches with HSC channels in knockdown or sham conditions. B: percentage of patches with NSC channels in knockdown/sham conditions. Only knocking down α-ENaC reduces the surface expression of both HSC and NSC channels (n = 4 for all conditions; HSC reduction and NSC reduction are significant, P < 0.01 by z-test).
Fig. 3.
Fig. 3.
AT2 cells contain ACCN2. A: PCR analysis showing expression of ACCN isoforms in cDNA prepared from AT2 cells. Only ACCN2 (ASIC1) has a visible band. B: PCR reamplification showing expression of ACCN2 variant 2 (ASIC1a, lane 3) and lack of expression of ACCN2 variant 1 (ASIC1b, lane 2). NCBI, National Center for Biotechnology Information.
Fig. 4.
Fig. 4.
NSC channels are sensitive to ASIC1-modifying toxins. A: NSC channels were activated by venom of the Texas coral snake (Micrurus tener tener; MitTx). It is a potent, persistent, and selective agonist for acid-sensing ion channels and is highly selective for ASIC1 at neutral pH (11). B: psalmotoxin-1 isolated from the venom of the spider, Psalmopoeus cambridgei (Trinidad chevron tarantula), is a potent and selective acid-sensing ion channel 1a (ASIC1a) blocker (IC50 = 0.9 nM) with no effect on ASIC1b, ASIC2a, ASIC3, and ENaC channels at concentrations up to 100 nM (13, 14, 19). When applied to AT2 cells in primary culture, it uniformly decreased NSC open probability. Neither toxin had any effect on HSC channels. *P < 0.05.
Fig. 5.
Fig. 5.
Coexpression of α-ENaC/ASIC1a produces high-conductance NSC channels. A: Western blot showing ASIC1a detection in FRT cells with and without α-ENaC. Although the blot is cropped, there are no other bands in the blot. B: conductance of channels found in patches on FRT cells transfected with GFP/dsRed vector only, GFP α-ENaC, or dsRed ASIC1a + GFP α-ENaC. C, top: representative traces from FRT cell transfected with GFP α-ENaC. Bottom: representative traces from FRT cells transfected with dsRed ASIC1a + GFP α-ENaC. Vp, voltage of the pipette.
Fig. 6.
Fig. 6.
NSC channel frequency strongly depends on ASIC1a and α-ENaC presence. A: Western blot showing ASIC1 expression in L2 cells treated with scrambled shRNA or ASIC1 silencing vectors. Although the blot is cropped, there are no other bands in the blot. Reduction of ASIC1 protein positively correlates to amount of ASIC1a shRNA used. B, left: percentage patches with NSC channels present under ASIC1 or α-ENaC knockdown conditions. Right: percentage patches with HSC channels under ASIC1 or α-ENaC knockdown conditions. Numbers above bars indicate total number of patches.
Fig. 7.
Fig. 7.
Interaction of ASIC1a and α-ENaC subunits. A, top: L2 cell protein lysate immunoprecipitated (IP) for α-ENaC and immunoblotted (IB) for ASIC1. Bottom: L2 cell protein lysate immunoprecipitated for ASIC1 and immunoblotted for α-ENaC. B: quantification of mammalian two-hybrid assay between ASIC1a and ENaC subunits. Normalized luciferase luminescence is proportional to binding affinity to ASIC1a. Negative control represents random association, and positive control represents maximum affinity. Fold increase for α-ENaC (6.6 ± 0.73) indicates a high affinity for ASIC1a. Data represent a total n of 15 (n = 3 for each condition); *P < 0.05.
Fig. 8.
Fig. 8.
Lung slice preparation. A: representative image of a lung slice used for single-channel patch clamp recording. Lung slice was obtained from lower left lobe of mouse lung. AT1 cells are labeled green with Erythrina cristagalli lectin, and AT2 cells are labeled red with LysoTracker red. B: current-voltage relationships for HSC and NSC channels from AT2 cells in lung slices. Solid line is the best fit to Goldman equation. Symbols represent means ± SE for each condition for at least three measurements. C: for comparison purposes, the current-voltage relationships of HSC and NSC channels from channels in AT2 cells in culture (reproduced from Fig. 1).
Fig. 9.
Fig. 9.
Properties of HSC channels in lung slices. A: we reviewed the properties of 100 HSC channels from patches made on alveolar cells in lung slices. We found that the reversal potentials of HSC channels fell in a distribution skewed toward small positive reversal potentials with the majority clustered at less than +20 mV [9.12 ± 3.99 (mean ± SD), n = 100] although there were some channels that had higher positive potentials (some as high as +60 mV). B: we examined the channel activity associated with the different HSC reversal potentials and found an inverse linear relationship between channel activity and reversal potential: the closer to zero the reversal potential, the higher the channel activity [measured as the product of the number of channels per patch and the open probability (NPo)].
Fig. 10.
Fig. 10.
Distribution of reversal potentials for NSC in lung slices and distribution in cultured AT2 cells. Left: distribution of reversal potentials for NSC in lung slices [−1.28 ± 7.13 mV (mean ± SD), n = 84]. Middle: distribution of NSC in cultured AT2 cells. Right: distribution of HSC in cultured AT2 cells. The distributions in cultured cells suggest an apical membrane potential near −40 mV and much lower channel activity (mean number of channels/patch is <1).
Fig. 11.
Fig. 11.
KO mice have no detectable ASIC1a. PCR analysis shows expression of ACCN2 in cDNA prepared from wild-type lungs and from rat lung as a positive control. The cDNA prepared from ASIC1 KO lung has no detectable ACCN2 (ASIC1).
Fig. 12.
Fig. 12.
NSC channels are not observable in single-channel patches on lung slices from ASIC1 KO mice. Single-channel recordings were measured from AT2 cells in lung slices. A: single-channel currents (right) and distribution of current amplitudes (left) in a patch on an AT2 cell from a wild-type lung slice, which has both NSC and HSC channels (sometimes overlapping). B: single-channel currents (right) and distribution of current amplitudes (left) in a patch on an AT2 cell from an ASIC1 KO lung slice, which has only HSC channels.
Fig. 13.
Fig. 13.
ASIC1a KO mice have no NSC channels. A: Western blot showing ASIC1a expression in lungs from wild-type mice and lack of expression in ASIC1a KO mice. Although the blot is cropped, there are no other bands in the blot. B: single-channel frequency from patches on lung slices of wild-type mice and ASIC1a KO mice. Patches on AT1 and AT2 cells from ASIC1a KO mice have similar numbers of HSC channels in AT1 and AT2 cells to wild-type mice but have no observable NSC channels in either cell. Numbers above bars in parentheses represent total number of patches for each experiment. Numbers within bars indicate the number of each type of channel observed in each type of cell. Some cell patches on both types of cells have both NSC and HSC channels (as in Fig. 8). C: number of channels per patch. Data are from the same patches as shown in B. All values for number of channels in a patch are integer values. To visualize the distribution and the density of the data, a small amount of stochastic noise was added to every data point. *P < 0.05.
Fig. 14.
Fig. 14.
ASIC1a KO increases lung water content and reduces alveolar fluid clearance. A: lung wet wt-to-dry wt ratios. Higher wet wt-to-dry wt ratio indicates increased lung water content and decreased alveolar fluid clearance. The difference in the two groups is significant. Data represent n = 8 for each treatment group. B: Evans blue dye assay showed that alveolar fluid clearance was significantly reduced in ASIC1a KO mice compared with wild-type mice. Amiloride blocked about half of AFC in wild-type mice, but there is little residual AFC after amiloride in ASIC1 KO mice. Data represent a total n = 3 mice for each treatment group; n.s., not significant. C: bronchalveolar lavage (BAL) fluid protein from wild-type and ASIC1 KO mice. There is no significant difference in BAL protein between the two groups (n = 4 mice for each treatment group; P = 0.424).
Fig. 15.
Fig. 15.
Expression of ASIC1a is dependent on oxygen tension. AT2 cells grown on permeable supports with an air interface (21% O2, high oxygen) express less ASIC1a than AT2 cells grown under liquid to reduce oxygen tension (calculated to be 12–15% O2).
Fig. 16.
Fig. 16.
Schematic diagram of a possible configuration of ASIC1a and ENaC subunits in NSC and HSC channels.

Similar articles

Cited by

References

    1. Adir Y, Factor P, Dumasius V, Ridge KM, Sznajder JI. Na,K-ATPase gene transfer increases liquid clearance during ventilation-induced lung injury. Am J Respir Crit Care Med 168: 1445–1448, 2003. doi:10.1164/rccm.200207-702OC. - DOI - PubMed
    1. Alli AA, Bao HF, Alli AA, Aldrugh Y, Zhou Y, Yu L, Eaton DC. Calmodulin and CaM kinase II govern MARCKS-mediated PIP2-dependent regulation of ENaC. FASEB J 26, Suppl: 867.815, 2012.
    1. Askwith CC, Benson CJ, Welsh MJ, Snyder PM. DEG/ENaC ion channels involved in sensory transduction are modulated by cold temperature. Proc Natl Acad Sci USA 98: 6459–6463, 2001. doi:10.1073/pnas.111155398. - DOI - PMC - PubMed
    1. Azzam ZS, Dumasius V, Saldias FJ, Adir Y, Sznajder JI, Factor P. Na,K-ATPase overexpression improves alveolar fluid clearance in a rat model of elevated left atrial pressure. Circulation 105: 497–501, 2002. doi:10.1161/hc0402.102848. - DOI - PubMed
    1. Babinski K, Lê KT, Séguéla P. Molecular cloning and regional distribution of a human proton receptor subunit with biphasic functional properties. J Neurochem 72: 51–57, 1999. doi:10.1046/j.1471-4159.1999.0720051.x. - DOI - PubMed

Publication types

MeSH terms

LinkOut - more resources