. 2017 Apr 28;91(10):e00320-17.
doi: 10.1128/JVI.00320-17. Print 2017 May 15.

Quantitative Evaluation of Protein Heterogeneity within Herpes Simplex Virus 1 Particles

Affiliations

Quantitative Evaluation of Protein Heterogeneity within Herpes Simplex Virus 1 Particles

Nabil El Bilali et al. J Virol. .

Abstract

Several virulence genes have been identified thus far in the herpes simplex virus 1 genome. It is also generally accepted that protein heterogeneity among virions further impacts viral fitness. However, linking this variability directly with infectivity has been challenging at the individual viral particle level. To address this issue, we resorted to flow cytometry (flow virometry), a powerful approach we recently employed to analyze individual viral particles, to identify which tegument proteins vary and directly address if such variability is biologically relevant. We found that the stoichiometry of the UL37, ICP0, and VP11/12 tegument proteins in virions is more stable than the VP16 and VP22 tegument proteins, which varied significantly among viral particles. Most interestingly, viruses sorted for their high VP16 or VP22 content yielded modest but reproducible increases in infectivity compared to their corresponding counterparts containing low VP16 or VP22 content. These findings were corroborated for VP16 in short interfering RNA experiments but proved intriguingly more complex for VP22. An analysis by quantitative Western blotting revealed substantial alterations of virion composition upon manipulation of individual tegument proteins and suggests that VP22 protein levels acted indirectly on viral fitness. These findings reaffirm the interdependence of the virion components and corroborate that viral fitness is influenced not only by the genome of viruses but also by the stoichiometry of proteins within each virion.IMPORTANCE The ability of viruses to spread in animals has been mapped to several viral genes, but other factors are clearly involved, including virion heterogeneity. To directly probe whether the latter influences viral fitness, we analyzed the protein content of individual herpes simplex virus 1 particles using an innovative flow cytometry approach. The data confirm that some viral proteins are incorporated in more controlled amounts, while others vary substantially. Interestingly, this correlates with the VP16 trans-activating viral protein and indirectly with VP22, a second virion component whose modulation profoundly alters virion composition. This reaffirms that not only the presence but also the amount of specific tegument proteins is an important determinant of viral fitness.

Keywords: FACS; HSV-1; VP16; VP22; flow cytometry; flow virometry; herpes simplex virus; heterogeneity; tegument; viral particle.


Figures

FIG 1
FIG 1
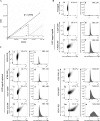
Analysis of Syto-stained HSV-1 virions by FACS. Vero cells were infected with wild-type HSV-1 at an MOI of 5 for 18 hpi. Extracellular virions were stained with 1 μM Syto 13 and analyzed by flow cytometry. (A) Schematic description of the gating strategy. Note that aggregated particles were first excluded by gating them out in the SSC versus FSC plots and by specific flow cytometry parameters (see Materials and Methods). (B) The graphs on the left for each condition (dot plots) show the fluorescence profiles of all nonaggregated particles, while only Syto 13+ samples (fluorescence above the buffer control) were considered on the right (histograms). Percentages denote the amount of Syto 13-positive particles relative to the starting population, which includes inert particles inherently present in the FACS buffer (24). Meanwhile, the mean fluorescence signal (MFI) is only that of the Syto 13+ viral particles.
FIG 2
FIG 2
Analysis of GFP-tagged virions by FACS. Vero cells were infected with wild-type HSV-1 (untagged) or fluorescent recombinant viruses tagging the viral capsid (UL25-GFP), the tegument (VP11/12-GFP), or envelope (GFP-gB) at an MOI of 5 for 18 hpi. Virions were diluted and directly analyzed by flow cytometry. (A) Schematic description of the gating strategy. Virion aggregates were first removed by gating them out, and GFP+ particles were analyzed. (B) The proportion (%) and mean fluorescence levels (MFI) of the GFP particles are indicated in each graph (averages from 3 independent experiments). As described for Fig. 1, these percentages denote the amount of GFP-positive particles relative to the starting population, which includes inert particles inherently present in the FACS buffer (24). Meanwhile, the mean fluorescence signal (MFI) is only that of the GFP+ viral particles. Note the sharp edge on the left of the GFP histograms, a direct consequence of the gating.
FIG 3
FIG 3
Flow cytometry detects all structural constituents of the virus. (A) Linear detection of AcGFP flow cytometer calibration beads analyzed by flow cytometry using a 488-nm laser line. Note the blow-up of the first few points. (B and C) Extracellular virions were purified from wild-type (i.e., nonfluorescent)-infected cells or from cells infected with fluorescent recombinant viruses and examined by flow cytometry as described for Fig. 1. The graphs on the left show total individual particles (i.e., excluding aggregates), while those on the right show the histogram profiles of the GFP-positive gated material for each virus. The MFI and the proportion (percentage) in each graph are averages from 4 independent experiments. Once again, these percentages denote the amount of GFP-positive particles relative to the starting population, which includes inert particles inherently present in the FACS buffer (24). Meanwhile, the mean fluorescence signal (MFI) is only that of the GFP+ viral particles. Once again, the sharp edge on the left of the GFP histograms is a direct consequence of the gating rather than a binomial distribution of the signal.
FIG 4
FIG 4
Variability of the tegument among individual viral particles. Extracellular virions were purified from wild-type (i.e., nonfluorescent)-infected cells or from cells infected with the indicated fluorescent recombinant viruses and analyzed by flow cytometry. Tegument variability was measured by the coefficient of variability based on the medians (% rCV). Error bars represent the standard deviations from 4 independent experiments. Student t tests were performed to analyze the significance of the data (**, P < 0.01; ***, P < 0.001).
FIG 5
FIG 5
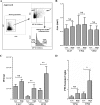
VP16 and VP22 abundance correlate with infectivity. Extracellular virions were purified from cells infected with K37eGFP, VP16-GFP, or GFP-VP22 viruses and sorted by flow cytometry, as described for Fig. 1, for their low or high levels of UL37, VP16, or VP22, respectively. (A) Schematic description of the gating strategy applied for the sorting of viruses by FACS. Virion aggregates were first removed by gating them out. (B and C) Viral spread of the sorted viruses. The infectivity of the sorted virions was assessed by plaque assays on Vero cells, and plaque size (B) and abundance (C) were evaluated. (D) PFU/genome copy number ratios. The PFU/genome copy number ratio was obtained by dividing the PFU values by the corresponding values of genome copies measured by qPCR for the same viral samples. Error bars represent the standard deviations derived from 3 independent experiments and analyzed with the Student t test (NS, not significant, i.e., P > 0.05; **, P < 0.01).
FIG 6
FIG 6
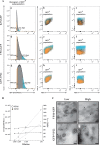
Sorted viruses are single viral particles. (A) Extracellular virions were purified from cells infected with VP16-GFP or GFP-VP22 viruses, analyzed, and then sorted by flow cytometry as described for Fig. 5A for their low or high levels of VP16 or VP22 content, respectively. All images are only GFP+ particles, i.e., those already depleted of aggregates and nonfluorescent components. FSC-H and FSC-A are the height and area under the curve of the forward-scattering signal, respectively, while SSC-A measures the area under the side-scattering signal. Orange, particles with the lowest 10% GFP signal; blue, particles with the top 10% GFP signal; black, particles exhibiting an intermediate GFP signal and not subsequently analyzed. The linear edges around the dot blots reflect the gate used to sort the samples. (B) Extracellular virions purified from infected cells were first diluted 1:50, and then serial dilutions of 1:2 were prepared and analyzed by flow cytometry by continuous recording of events during a fixed time (60 s in these experiments). (C) Sorted viruses were concentrated on 0.1-μm filters, which were embedded and processed for electron microscopy (see Materials and Methods). For clarity, the presence of some capsids with their envelope is indicated by asterisks. Bars represent 100 nm.
FIG 7
FIG 7
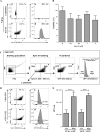
Difference in infectivity is not linked to L-particles. (A) Staining of virions with Syto 61. Vero cells were infected with untagged wild-type viruses at an MOI of 5 for 18 hpi. Purified extracellular virions were stained with 1 μM Syto 61 or mock treated and analyzed by flow cytometry. Aggregates were gated out and Syto 61 fluorescence evaluated. The percentages denote the amount of Syto 61+ particles relative to the starting population, which includes inert particles inherently present in the FACS buffer (24). Meanwhile, the mean fluorescence signal (MFI) is only that of the Syto 61+ viral particles. (B) Syto 61 does not affect the viability of the stained virions. Wild-type strain F extracellular virions were stained with 0 to 5 μM Syto 61 for 1 h at 4°C. The viability of the Syto 61-labeled virions was assessed by standard plaque assays. For comparison, the number of plaques obtained for the untreated sample was set at 100%. Error bars represent the standard deviations from 2 independent experiments. (C) Schematic description of the approach to deplete L-particles and enrich for heavy particles (H-particles). Once aggregates were gated out (leftmost image), VP16-GFP or GFP-VP22 Syto 61-positive events were selected to exclude L-particles (second image from the left). A second gating was then applied to select GFP-positive particles (third image from the left). The samples were finally sorted on the basis of their low or high levels of VP16 or VP22 (rightmost image). As before, all sorting took place under conditions where only single individual viral particles were present (see Materials and Methods). (D) Sorting of DNA-containing GFP-positive virions. High-content and low-content viral particles were sorted according to the scheme depicted in panel C. Percentages denote the amount of GFP+ particles, which only includes heavy particles with a potential contamination of a mere 5 to 6% by L-particles or H-particles that were not labeled with the Syto 61 dye. (E) Infectivity of the sorted virions. The infectivity of the Syto 61+/GFP+ sorted virions was assessed by plaque assay on Vero cells. Error bars represent the standard deviations from 2 independent experiments, and results were analyzed with the Student t test (***, P < 0.001).
FIG 8
FIG 8
Analysis of VP16 and VP22 siRNA-depleted virions. 143B cells were transfected for 48 h using PepMute with a unique RNAi against VP16 or two pooled siRNAs targeting VP22. Cells were then infected with HSV-1 KOS at an MOI of 5 for 24 h. (A) Immunoblot of mock-treated or siRNA-transfected and HSV-1-infected cell lysate. Thirty micrograms of cell lysate was separated by SDS-PAGE, transferred to PVDF membrane, and probed with antibodies against VP16 and VP22. Calnexin was used as a loading control. (B) Impact on VP16/VP22 incorporation in virions. The amount of VP16 or VP22 in extracellular virions produced by cells transfected with the indicated siRNA was evaluated by Western blotting in 5 independent experiments, each normalized to the untreated sample (i.e., PepMute set at 100%). (C) Impact on infectivity. The infectivity of the VP16- or VP22-depleted extracellular virions was assessed in standard plaque assays. Error bars represent the standard deviations from 3 independent experiments (*, P < 0.05; **, P < 0.01).
FIG 9
FIG 9
Interconnectivity of the virion components. (A) Western blot analyses. Extracellular virions indicated at the top of the blots were purified from infected cells and analyzed by Western blotting using antibodies indicated to the right of each blot. (B and C) Tegument quantification. The amounts of various tegument proteins present in virions tagged on the capsid (B) or the tegument (C) were determined by quantitative Western blotting. The data were normalized to VP5 to ensure even loading of the gels. These tegument/VP5 ratios were finally compared to those of the wild type for each strain, arbitrarily set at 1, to avoid biases among viral strains. Error bars represent the standard deviations from 3 independent experiments. Student t tests were performed to analyze the significance of the data (*, P < 0.05; **, P < 0.01; ***, P < 0.001). Note that throughout this study, a ChemiDoc was used, not film, which is notoriously nonlinear.

Similar articles

Cited by

References

    1. Loret S, Guay G, Lippé R. 2008. Comprehensive characterization of extracellular herpes simplex virus type 1 virions. J Virol 82:8605–8618. doi:10.1128/JVI.00904-08. - DOI - PMC - PubMed
    1. Mettenleiter TC. 2006. Intriguing interplay between viral proteins during herpesvirus assembly or: the herpesvirus assembly puzzle. Vet Microbiol 113:163–169. doi:10.1016/j.vetmic.2005.11.040. - DOI - PubMed
    1. Taha MY, Brown SM, Clements GB. 1988. Neurovirulence of individual plaque stocks of herpes simplex virus type 2 strain HG 52. Arch Virol 103:15–25. doi:10.1007/BF01319805. - DOI - PubMed
    1. Johnson DC, Baines JD. 2011. Herpesviruses remodel host membranes for virus egress. Nat Rev Microbiol 9:382–394. doi:10.1038/nrmicro2559. - DOI - PubMed
    1. Smith G. 2012. Herpesvirus transport to the nervous system and back again. Annu Rev Microbiol 66:153–176. doi:10.1146/annurev-micro-092611-150051. - DOI - PMC - PubMed

Publication types

MeSH terms

Substances

Grants and funding

LinkOut - more resources