

Compartmentalized cGMP Responses of Olfactory Sensory Neurons in Caenorhabditis elegans
- PMID: 28270568
- PMCID: PMC6596710
- DOI: 10.1523/JNEUROSCI.2628-16.2017
Compartmentalized cGMP Responses of Olfactory Sensory Neurons in Caenorhabditis elegans
Abstract
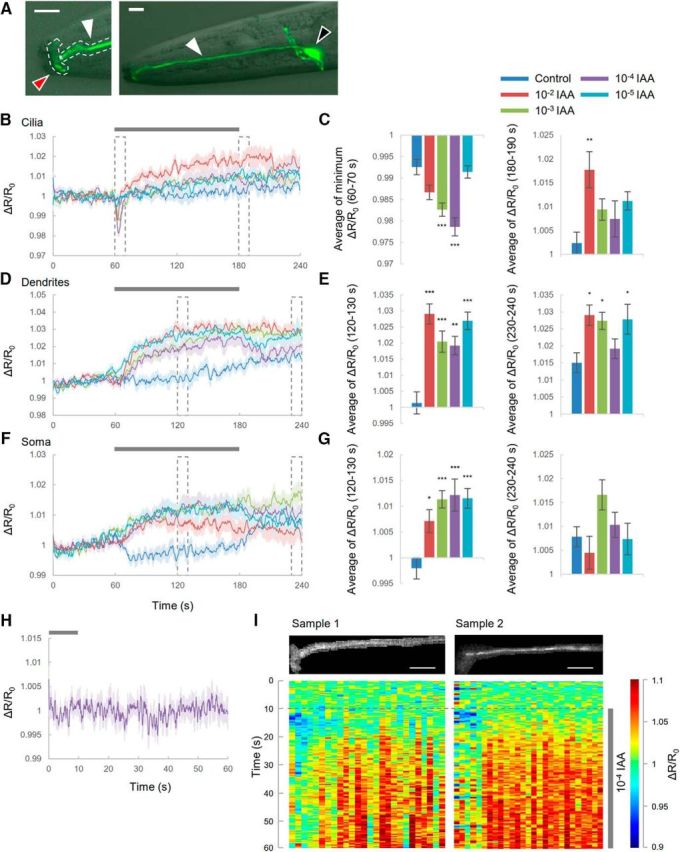
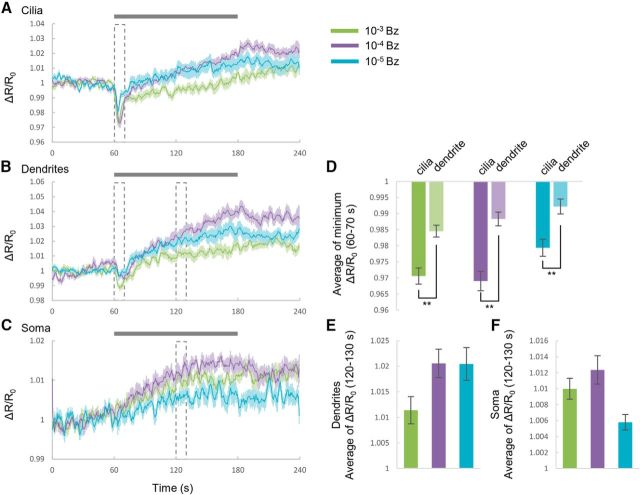
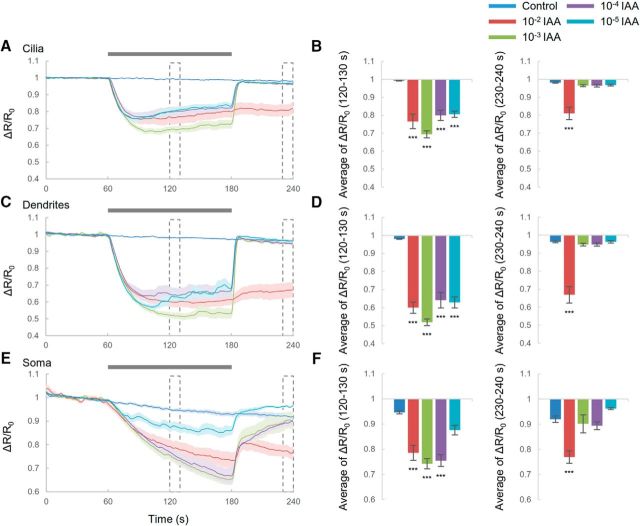
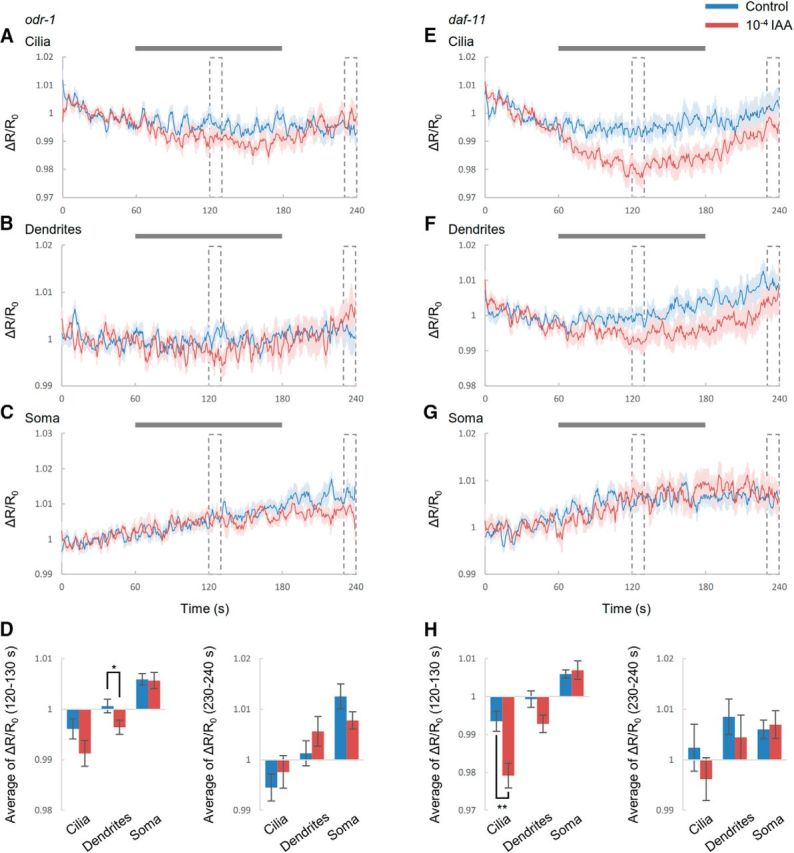
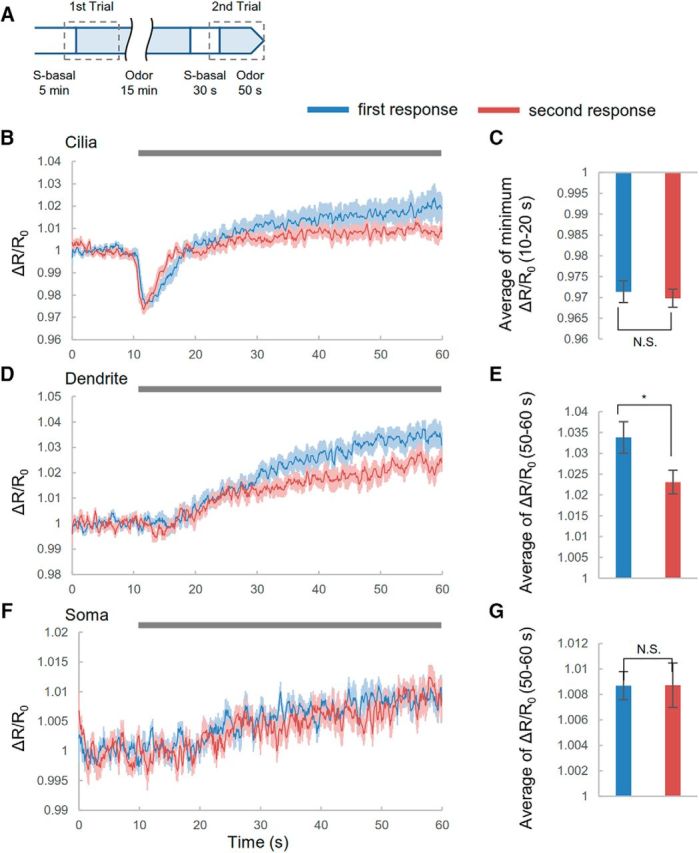
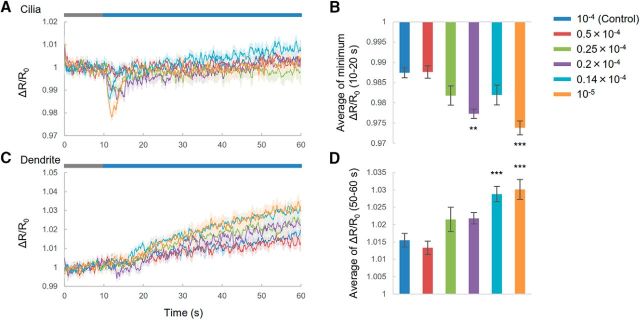
Cyclic guanosine monophosphate (cGMP) plays a crucial role as a second messenger in the regulation of sensory signal transduction in many organisms. In AWC olfactory sensory neurons of Caenorhabditis elegans, cGMP also has essential and distinctive functions in olfactory sensation and adaptation. According to molecular genetic studies, when nematodes are exposed to odorants, a decrease in cGMP regulates cGMP-gated channels for olfactory sensation. Conversely, for olfactory adaptation, an increase in cGMP activates protein kinase G to modulate cellular physiological functions. Although these opposing cGMP responses in single neurons may occur at the same time, it is unclear how cGMP actually behaves in AWC sensory neurons. A hypothetical explanation for opposing cGMP responses is region-specific behaviors in AWC: for odor sensation, cGMP levels in cilia could decrease, whereas odor adaptation is mediated by increased cGMP levels in soma. Therefore, we visualized intracellular cGMP in AWC with a genetically encoded cGMP indicator, cGi500, and examined spatiotemporal cGMP responses in AWC neurons. The cGMP imaging showed that, after odor exposure, cGMP levels in AWC cilia decreased transiently, whereas levels in dendrites and soma gradually increased. These region-specific responses indicated that the cGMP responses in AWC neurons are explicitly compartmentalized. In addition, we performed Ca2+ imaging to examine the relationship between cGMP and Ca2+ These results suggested that AWC sensory neurons are in fact analogous to vertebrate photoreceptor neurons.SIGNIFICANCE STATEMENT Cyclic guanosine monophosphate (cGMP) plays crucial roles in the regulation of sensory signal transduction in many animals. In AWC olfactory sensory neurons of Caenorhabditis elegans, cGMP also has essential and distinctive functions involving olfactory sensation and adaptation. Here, we visualized intracellular cGMP in AWC neurons with a genetically encoded cGMP indicator and examined how these different functions could be regulated by the same second messenger in single neurons. cGMP imaging showed that, after odor application, cGMP levels in cilia decreased transiently, whereas levels in dendrites and soma gradually increased. These region-specific responses indicated that the responses in AWC neurons are explicitly compartmentalized. In addition, by combining cGMP and Ca2+ imaging, we observed that AWC neurons are analogous to vertebrate photoreceptor neurons.
Keywords: C. elegans; cGMP imaging; compartment; sensory neuron.
Copyright © 2017 the authors 0270-6474/17/373753-11$15.00/0.
Figures

Similar articles
-
Changes in cGMP levels affect the localization of EGL-4 in AWC in Caenorhabditis elegans.PLoS One. 2012;7(2):e31614. doi: 10.1371/journal.pone.0031614. Epub 2012 Feb 3. PLoS One. 2012. PMID: 22319638 Free PMC article.
-
Nuclear entry of a cGMP-dependent kinase converts transient into long-lasting olfactory adaptation.Proc Natl Acad Sci U S A. 2010 Mar 30;107(13):6016-21. doi: 10.1073/pnas.1000866107. Epub 2010 Mar 10. Proc Natl Acad Sci U S A. 2010. PMID: 20220099 Free PMC article.
-
Multiple Signaling Pathways Coordinately Regulate Forgetting of Olfactory Adaptation through Control of Sensory Responses in Caenorhabditis elegans.J Neurosci. 2017 Oct 18;37(42):10240-10251. doi: 10.1523/JNEUROSCI.0031-17.2017. Epub 2017 Sep 18. J Neurosci. 2017. PMID: 28924007 Free PMC article.
-
[Molecular and cell biological mechanism of olfactory adaptation in Caenorhabditis elegans].Zhejiang Da Xue Xue Bao Yi Xue Ban. 2018 May 25;47(3):307-312. doi: 10.3785/j.issn.1008-9292.2018.06.15. Zhejiang Da Xue Xue Bao Yi Xue Ban. 2018. PMID: 30226334 Free PMC article. Review. Chinese.
-
The olfactory signal transduction for attractive odorants in Caenorhabditis elegans.Biotechnol Adv. 2014 Mar-Apr;32(2):290-5. doi: 10.1016/j.biotechadv.2013.10.010. Epub 2013 Nov 2. Biotechnol Adv. 2014. PMID: 24189094 Review.
Cited by
-
Visualizing and quantifying molecular and cellular processes in Caenorhabditis elegans using light microscopy.Genetics. 2022 Jul 30;221(4):iyac068. doi: 10.1093/genetics/iyac068. Genetics. 2022. PMID: 35766819 Free PMC article. Review.
-
Context-dependent reversal of odorant preference is driven by inversion of the response in a single sensory neuron type.PLoS Biol. 2022 Jun 13;20(6):e3001677. doi: 10.1371/journal.pbio.3001677. eCollection 2022 Jun. PLoS Biol. 2022. PMID: 35696430 Free PMC article.
-
Biophysical modeling of the whole-cell dynamics of C. elegans motor and interneurons families.PLoS One. 2024 Mar 29;19(3):e0298105. doi: 10.1371/journal.pone.0298105. eCollection 2024. PLoS One. 2024. PMID: 38551921 Free PMC article.
-
Serotonin modulates behavior-related neural activity of RID interneuron in Caenorhabditis elegans.PLoS One. 2019 Dec 4;14(12):e0226044. doi: 10.1371/journal.pone.0226044. eCollection 2019. PLoS One. 2019. PMID: 31800640 Free PMC article.
-
Interneurons Regulate Locomotion Quiescence via Cyclic Adenosine Monophosphate Signaling During Stress-Induced Sleep in Caenorhabditis elegans.Genetics. 2019 Sep;213(1):267-279. doi: 10.1534/genetics.119.302293. Epub 2019 Jul 10. Genetics. 2019. PMID: 31292211 Free PMC article.
References
Publication types
MeSH terms
Substances
Grants and funding
LinkOut - more resources
Full Text Sources
Other Literature Sources
Miscellaneous