. 2017 Mar;101(3):683-692.
doi: 10.1189/jlb.2A0316-141RR. Epub 2016 Oct 17.

CXCL12-induced macropinocytosis modulates two distinct pathways to activate mTORC1 in macrophages

Affiliations

CXCL12-induced macropinocytosis modulates two distinct pathways to activate mTORC1 in macrophages

Regina Pacitto et al. J Leukoc Biol. 2017 Mar.

Abstract

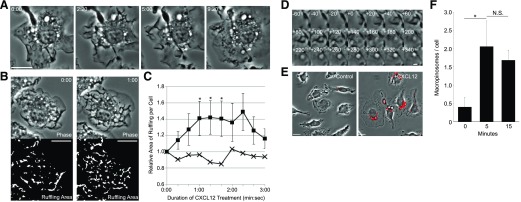
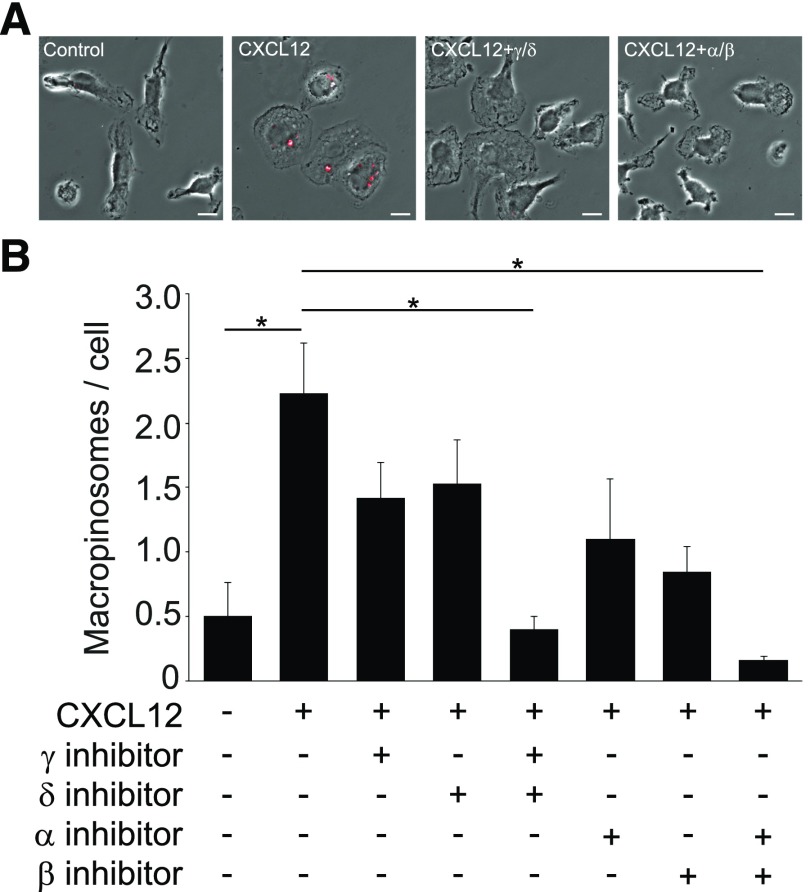
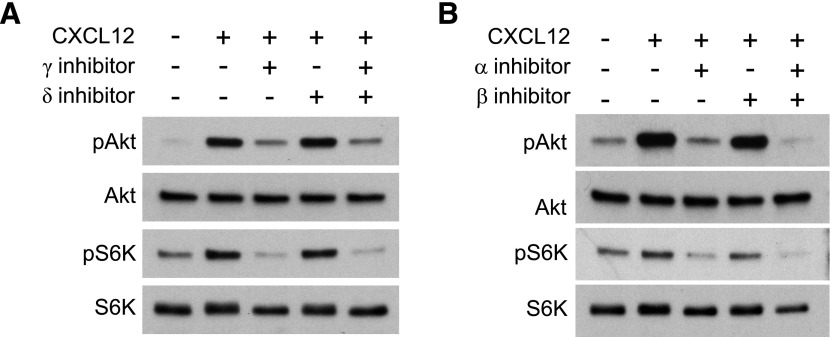
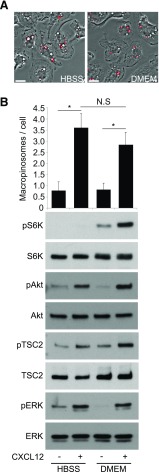
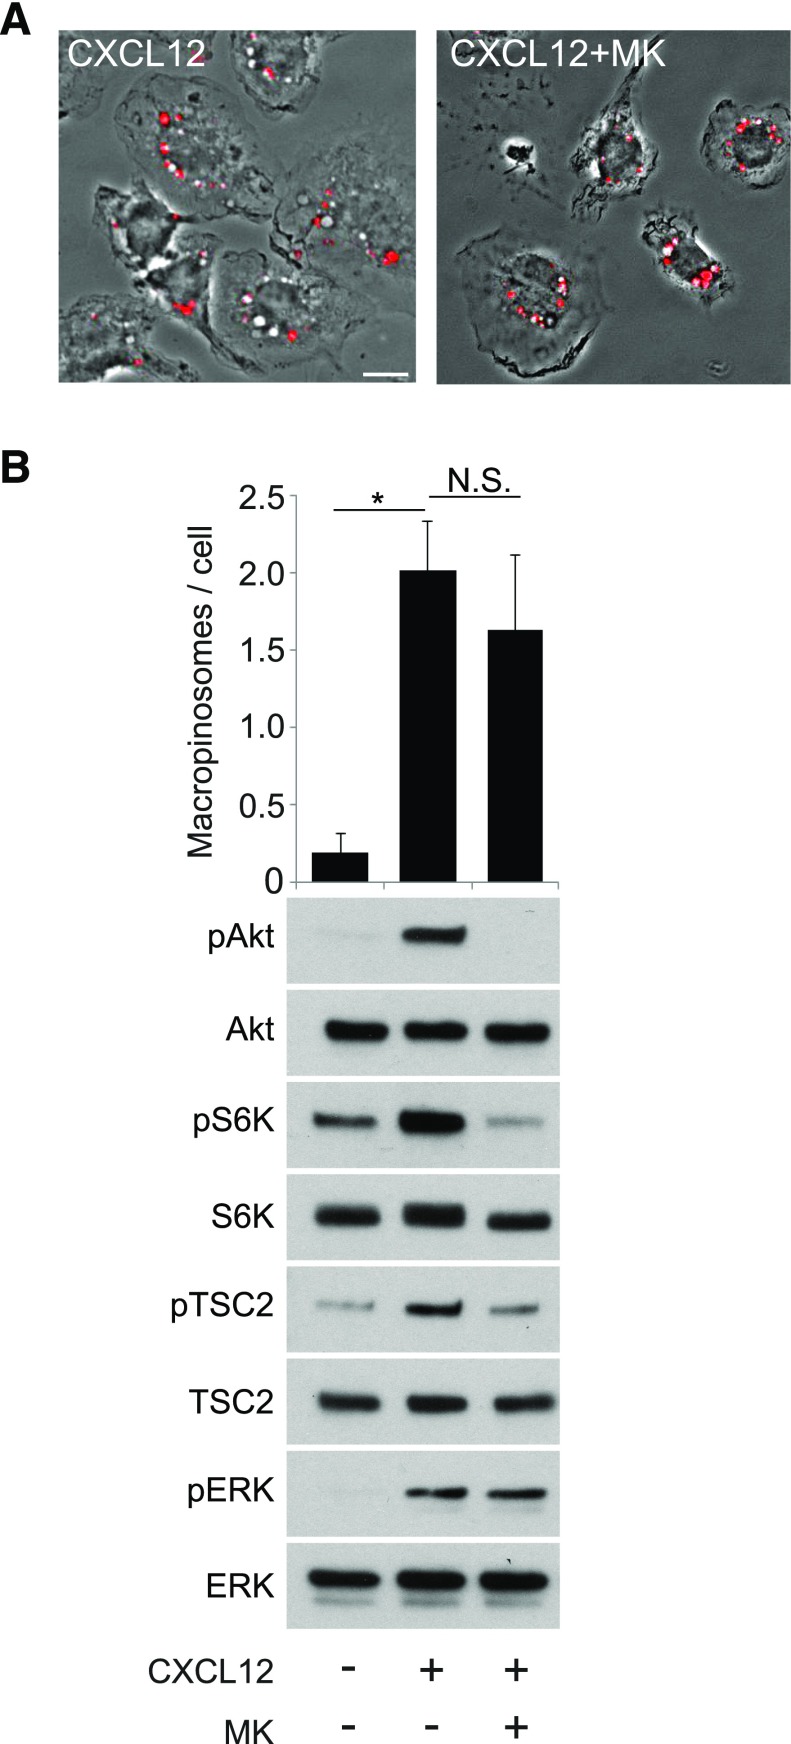
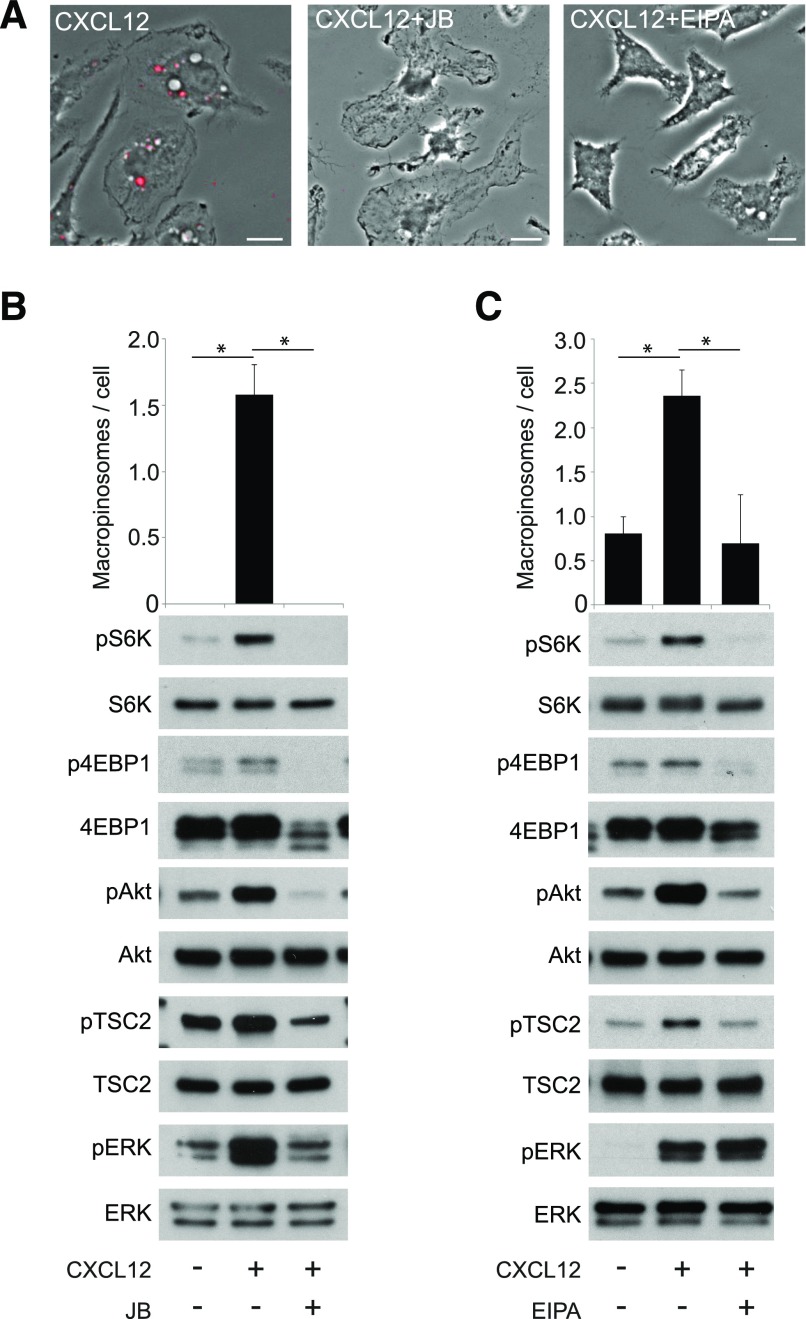
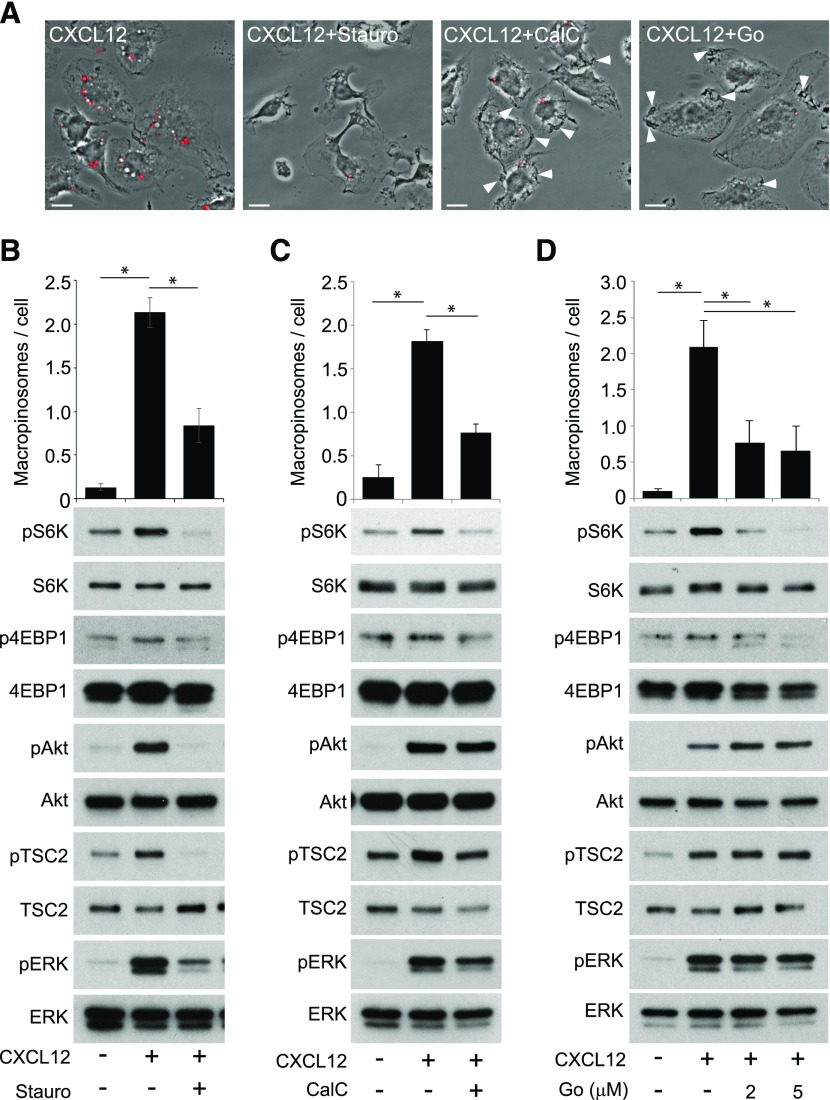
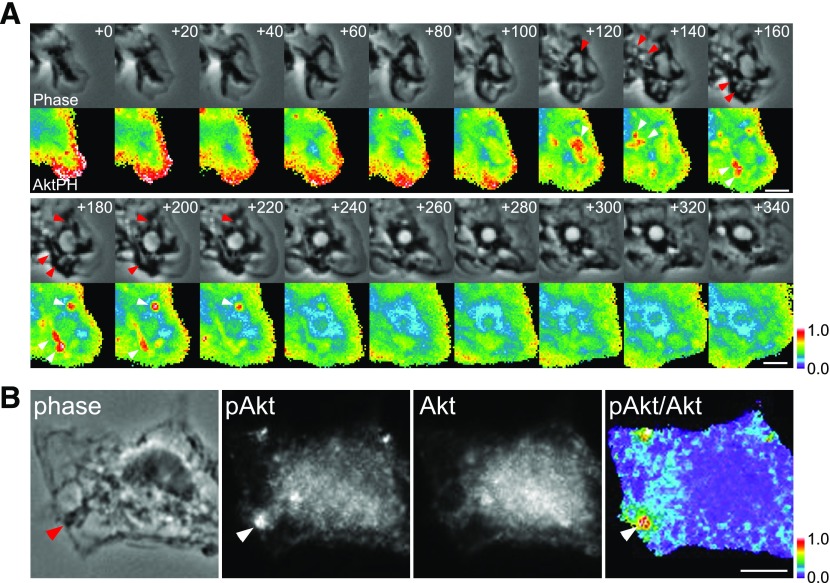
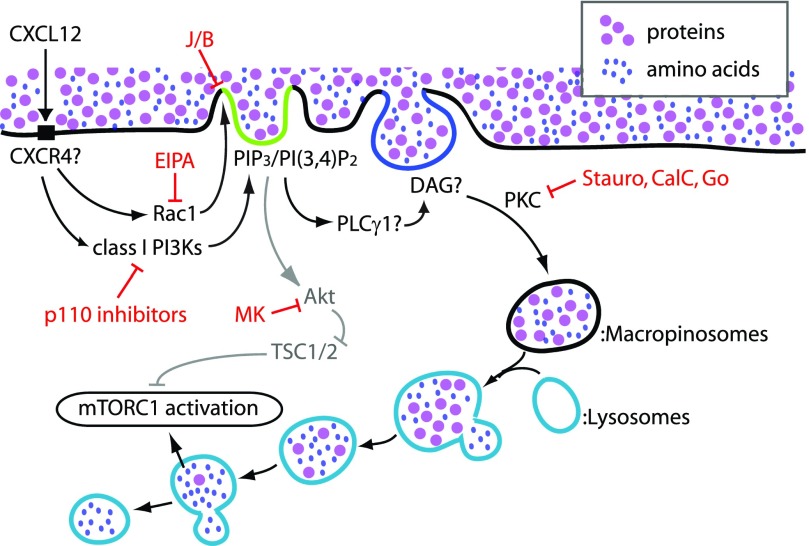
Although growth factors and chemokines elicit different overall effects on cells-growth and chemotaxis, respectively-and activate distinct classes of cell-surface receptors, nonetheless, they trigger similar cellular activities and signaling pathways. The growth factor M-CSF and the chemokine CXCL12 both stimulate the endocytic process of macropinocytosis, and both activate the mechanistic target of rapamycin complex 1 (mTORC1), a protein complex that regulates cell metabolism. Recent studies of signaling by M-CSF in macrophages identified a role for macropinocytosis in the activation of mTORC1, in which delivery of extracellular amino acids into lysosomes via macropinocytosis was required for activation of mTORC1. Here, we analyzed the regulation of macropinosome (MP) formation in response to CXCL12 and identified 2 roles for macropinocytosis in the activation of mTORC1. Within 5 min of adding CXCL12, murine macrophages increased ruffling, macropinocytosis and amino acid-dependent activation of mTORC1. Inhibitors of macropinocytosis blocked activation of mTORC1, and various isoform-specific inhibitors of type 1 PI3K and protein kinase C (PKC) showed similar patterns of inhibition of macropinocytosis and mTORC1 activity. However, unlike the response to M-CSF, Akt phosphorylation (pAkt) in response to CXCL12 required the actin cytoskeleton and the formation of macropinocytic cups. Quantitative fluorescence microscopy showed that phosphatidylinositol (3,4,5)-trisphosphate (PIP3), a product of PI3K and an upstream activator of Akt, localized to macropinocytic cups and that pAkt occurred primarily in cups. These results indicate that CXCL12 activates mTORC1 via 2 mechanisms: 1) that the macropinocytic cup localizes Akt signaling and 2) that MPs convey extracellular nutrients to lysosomes.

Keywords: Akt; PI3K; live-cell imaging.


Figures

Figure 1.
Figure 1.. CXCL12 induces membrane ruffling and macropinocytosis in BMMs.
(A) CXCL12 treatment induced membrane ruffles and MPs (arrows). Times after addition of CXCL12 are indicated at top left (minutes:seconds). Original scale bar, 10 μm. (B) Quantification of membrane ruffling induced by CXCL12. The area of membrane ruffling was defined as phase-dark patches in the phase-contrast image. Time after addition of CXCL12 is indicated [upper, top right (minutes:seconds)]. Original scale bars, 10 μm. (C) Quantitative analysis of ruffling area with (n = 7; squares) and without (n = 8; crosses) CXCL12. The area of membrane ruffling was measured from the binary images (as shown in B). The ruffling areas increased significantly after CXCL12 stimulation (*P < 0.05). (D) Montage image of MP formation in the cell shown in A. MP formation began with membrane ruffling (t = −60 to +0 s). A C-shaped ruffle (t = +0 s) curved into an O-shaped cup (t = +60 s) and then pinched shut (from t = +200 s). Original scale bar, 2 μm. (E) Phase-contrast images of BMM incubated 5 min in the presence of FDx70 without (Control) or with (+CXCL12) CXCL12. The vesicles labeled with red overlay indicate FDx70-positive MPs. Original scale bars, 10 μm. (F) CXCL12 induces macropinocytosis within 5 min. BMMs were treated with CXCL12 and FDx70 for the indicated times and then were fixed and scored for FDx70-positive MPs. More than 75 cells from 3 independent experiments were observed. *P < 0.05. N.S., No significant difference.
Figure 2.
Figure 2.. PI3K p110 isoform inhibitors inhibit macropinocytosis.
(A) Fixed-cell imaging of MP formation following treatment with inhibitors. FDx-positive vesicles (MPs) are labeled with red overlay. CXCL12 treatment induced MP formation. Compared with the +CXCL12 sample (CXCL12), cells treated with a combination of p110δ and p110γ inhibitors (CXCL12+γ/δ) or a combination of p110α and p110β inhibitors (CXCL12+α/β) contained few or no MPs. Original scale bars, 10 μm. (B) Quantification of the MP assay. Partial inhibition of pinocytosis was evident when cells were treated with the p110γ inhibitor (AS252424), p110δ inhibitor (IC87114), p110α inhibitor (A66), or p110β inhibitor (TGX221) independently. When used in combination, however, the cocktail of p110γ/δ inhibitors or p110α/β inhibitors yielded nearly complete inhibition of macropinocytosis (*P < 0.05). More than 75 cells from 3 independent experiments were observed.
Figure 3.
Figure 3.. p110γ and p110α inhibitors attenuated CXCL12-induced pAkt and pS6K.
(A) The p110γ inhibitor (AS252424), but not the p110δ inhibitor (IC87114), blocked pAkt and pS6K. (B) The p110α inhibitor (A66), but not the p110β inhibitor (TGX221), blocked CXCL12-induced pAkt and pS6K.
Figure 4.
Figure 4.. Depletion of extracellular amino acids diminishes CXCL12-induced mTORC1activation without inhibiting macropinocytosis.
(A) Phase-contrast images of BMM treated with CXCL12 and FDx70 for 5 min in HBSS (no amino acids) versus DMEM (physiologic levels of amino acids). Fluorescence microscopy showed many FDx70-positive MPs (red overlay) both in HBSS and in DMEM. Original scale bars, 10 μm. (B) The bar graph displays quantitative analysis of CXCL12-induced macropinocytosis. Western blot analysis showed no pS6K after CXCL12 treatment in HBSS but increased pS6K after CXCL12 treatment in DMEM. More than 75 cells from 3 independent experiments were observed. *P < 0.05. N.S., No significant difference.
Figure 5.
Figure 5.. PI3K regulates CXCL12-induced macropinocytosis independent of Akt function.
(A) Phase-contrast images of BMM treated with FDx70 and CXCL12 for 5 min without inhibitor (CXCL12) or with (CXCL12+MK) the Akt inhibitor MK2206. FDx70 fluorescent images (red signal) overlay the phase-contrast images. CXCL12-induced macropinocytosis was not inhibited by MK2206. Original scale bar, 10 μm. (B, upper) The bar graph displays the quantified results of MP assays with no treatment, CXCL12 treatment, and CXCL12 treatment with MK2206. (Lower) Western blot analysis shows that MK2206 completely blocked pAkt and inhibited pTSC2 and pS6K compared with the positive stimulus condition (+CXCL12). CXCL12-induced pERK was not affected. More than 75 cells from 3 independent experiments were observed. *P < 0.05. N.S., No significant difference.
Figure 6.
Figure 6.. Inhibition of membrane ruffling and macropinocytic cup formation attenuates CXCL12-induced pAkt and mTORC1 activation.
(A) Phase-contrast images of BMM treated with FDx70 and CXCL12 for 5 min without inhibitor (CXCL12), with a combination of cytoskeleton inhibitors J/.B (CXCL12+J/B), or with macropinocytosis inhibitor EIPA (CXCL12+EIPA). FDx70 fluorescent images (red signal) overlay the phase-contrast images. Red-filled vesicles are MPs. J/B and EIPA blocked CXCL12-induced membrane ruffling and macropinocytosis. Original scale bars, 10 μm. (B) MP formation after no treatment, CXCL12, and CXCL12 with J/B. J/B significantly decreased the average number of MPs per cell. Western blot analysis shows a decrease in pAkt, pS6K, p4EBP1, pTSC2, and pERK in J/B + CXCL12-treated cells compared with the CXCL12 (no inhibitor) sample. (C) EIPA significantly decreased the average number of MPs per cell. Western blot analysis shows a decrease in pAkt, pS6K, p4EBP1, and pTSC2 in the EIPA + CXCL12 treatment compared with the CXCL12 (no inhibitor) condition. More than 75 cells from 3 independent experiments were observed. *P < 0.05.
Figure 7.
Figure 7.. Inhibition of PKC attenuates CXCL12-induced macropinocytosis and pS6K.
(A) Phase-contrast images of BMM treated with FDx70 and CXCL12 for 5 min without inhibitors (CXCL12), with staurosporine (CXCL12+Stauro), calphostin C (CXCL12+CalC), or Gö6976 (CXCL12+Go). FDx70 fluorescent images (red signal) overlay the phase-contrast images; red-filled vesicles are MPs induced by the experimental conditions. Staurosporine blocked CXCL12-induced membrane ruffling and macropinocytosis. Calphostin C and Gö6976 blocked macropinocytosis but not macropinocytic cup formation (white arrowheads). Original scale bars, 10 μm. (B) Staurosporine significantly decreased the average number of CXCL12-induced MPs per cell and inhibited pAkt, pS6K, pTSC2, and pERK. (C) Calphostin C significantly decreased the average number of MPs per cell. Western blot analysis shows that pAkt, pTSC2, and pERK, after CXCL12 treatment, was unaffected by calphostin C, and calphostin C inhibited pS6K and induced a slight decrease in p4EBP1. (D) Gö6976 significantly decreased the average number of MPs per cell. Western blot analysis showed that pAkt, pTSC2, and pERK, after CXCL12 treatment, with and without Gö6976, were equivalent, whereas pS6K and p4EBP1 were decreased. More than 75 cells from 3 independent experiments were observed. *P < 0.05.
Figure 8.
Figure 8.. CXCL12-induced membrane ruffles and macropinocytic cups activate Akt.
(A) BMMs expressing YFP-Akt-PH and CFP were imaged during CXCL12-stimulated macropinocytosis, and ratio images (YFP/CFP) were processed. The numbers at the top right in each frame indicate time following addition of CXCL12 (seconds). Red and white arrowheads indicate macropinocytic cups and corresponding YFP-Akt-PH signal, respectively. YFP-Akt-PH localized at lamellipodia and membrane ruffles (t = +0 to t = +80) then accumulated in macropinocytic cups (t = +120 to t = +220 s). Color bar indicates relative value of ratio intensities. Original scale bars, 3 μm. (B) Immunofluorescent staining of pAkt (Thr308) and Akt demonstrates that Akt was phosphorylated at the cup structure (arrowheads indicate macropinocytic cup) in a cell fixed 1 min after addition of CXCL12. Comparison of the phase-contrast image (phase) and the ratio image (pAkt/Akt) displays a strong ratio value at the macropinocytic cup. Color bar indicates relative value of ratio intensities. Original scale bar, 5 μm.
Figure 9.
Figure 9.. Proposed model of CXCL12 signaling to mTORC1 in BMM.
CXCL12 activates Rac1 and class I PI3Ks in BMM, presumably via CXCR4. Rac1 stimulates membrane ruffling and macropinocytic cup formation. Class I PI3Ks also regulate MP formation and generate PIP3 and/or PI(3,4)P2 in the cup (green). Akt is then recruited to the cup structure and phosphorylated. pAkt induces pTSC2 (deactivation of TSC2). PKC function is required for cup closure. Given that PKC is regulated by DAG (blue), which is generated by PLCγ, the PLCγ/DAG pathway likely acts upstream of PKC in MP formation. Whereas the Akt/TSC pathway activates Rheb, the macropinocytic pathway conveys extracellular nutrients to the lysosome to activate Rag. Thus, these 2 pathways coordinately activate mTORC1. EIPA blocks macropinocytosis by inhibiting Rac1 function. J/B block membrane ruffling, as well as macropinocytosis. Staurosporine (Stauro), calphostin C (CalC), and Gö6976 (Go) all block MP closure by inhibiting PKC function. MK2206 (MK) inhibits Akt function but not macropinocytosis. p110 isoform-specific inhibitors block cup formation and cup closure, resulting in the attenuation of mTORC1 activity.

Similar articles

Cited by

References

    1. Lewis W. H. (1931) Pinocytosis. Bull. Johns Hopkins Hosp. Bull. 49, 17–27.
    1. Liu Z., Roche P. A. (2015) Macropinocytosis in phagocytes: regulation of MHC class-II-restricted antigen presentation in dendritic cells. Front. Physiol. 6, 1. - PMC - PubMed
    1. Mercer J., Greber U. F. (2013) Virus interactions with endocytic pathways in macrophages and dendritic cells. Trends Microbiol. 21, 380–388. - PubMed
    1. Kerr M. C., Teasdale R. D. (2009) Defining macropinocytosis. Traffic 10, 364–371. - PubMed
    1. Commisso C., Davidson S. M., Soydaner-Azeloglu R. G., Parker S. J., Kamphorst J. J., Hackett S., Grabocka E., Nofal M., Drebin J. A., Thompson C. B., Rabinowitz J. D., Metallo C. M., Vander Heiden M. G., Bar-Sagi D. (2013) Macropinocytosis of protein is an amino acid supply route in Ras-transformed cells. Nature 497, 633–637. - PMC - PubMed

MeSH terms