Characterization of the Circumlimbal Suture Model of Chronic IOP Elevation in Mice and Assessment of Changes in Gene Expression of Stretch Sensitive Channels
- PMID: 28239332
- PMCID: PMC5301305
- DOI: 10.3389/fnins.2017.00041
Characterization of the Circumlimbal Suture Model of Chronic IOP Elevation in Mice and Assessment of Changes in Gene Expression of Stretch Sensitive Channels
Abstract
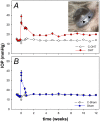
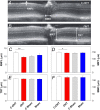
To consider whether a circumlimbal suture can be used to chronically elevate intraocular pressure (IOP) in mice and to assess its effect on retinal structure, function and gene expression of stretch sensitive channels. Anesthetized adult C57BL6/J mice had a circumlimbal suture (10/0) applied around the equator of one eye. In treated eyes (n = 23) the suture was left in place for 12 weeks whilst in sham control eyes the suture was removed at day two (n = 17). Contralateral eyes served as untreated controls. IOP was measured after surgery and once a week thereafter. After 12 weeks, electroretinography (ERG) was performed to assess photoreceptor, bipolar cell and retinal ganglion cell (RGC) function. Retinal structure was evaluated using optical coherence tomography. Retinae were processed for counts of ganglion cell density or for quantitative RT-PCR to quantify purinergic (P2x7, Adora3, Entpd1) or stretch sensitive channel (Panx1, Trpv4) gene expression. Immediately after suture application, IOP spiked to 33 ± 3 mmHg. After 1 day, IOP had recovered to 27 ± 3 mmHg. Between weeks 2 and 12, IOP remained elevated above baseline (control 14 ± 1 mmHg, ocular hypertensive 19 ± 1 mmHg). Suture removal at day 2 (Sham) restored IOP to baseline levels, where it remained through to week 12. ERG analysis showed that 12 weeks of IOP elevation reduced photoreceptor (-15 ± 4%), bipolar cell (-15 ± 4%) and ganglion cell responses (-19 ± 6%) compared to sham controls and respective contralateral eyes (untreated). The retinal nerve fiber layer was thinned in the presence of normal total retinal thickness. Ganglion cell density was reduced across all quadrants (superior -12 ± 5%; temporal, -7% ± 2%; inferior -9 ± 4%; nasal -8 ± 5%). Quantitative RT-PCR revealed a significant increase in Entpd1 gene expression (+11 ± 4%), whilst other genes were not significantly altered (P2x7, Adora3, Trpv4, Panx1). Our results show that circumlimbal ligation produces mild chronic ocular hypertension and retinal dysfunction in mice. Consistent with a sustained change to purinergic signaling we found an up-regulation of Entpd1.
Keywords: P2X7; TRPV; eNTDPase; electroretinography; glaucoma; intraocular pressure; pannexin; retinal ganglion cells.
Figures


Similar articles
-
Reversal of functional loss in a rat model of chronic intraocular pressure elevation.Ophthalmic Physiol Opt. 2017 Jan;37(1):71-81. doi: 10.1111/opo.12331. Epub 2016 Oct 24. Ophthalmic Physiol Opt. 2017. PMID: 27774623
-
Chronic ocular hypertension induced by circumlimbal suture in rats.Invest Ophthalmol Vis Sci. 2015 May;56(5):2811-20. doi: 10.1167/iovs.14-16009. Invest Ophthalmol Vis Sci. 2015. PMID: 25829414
-
Reversibility of Retinal Ganglion Cell Dysfunction From Chronic IOP Elevation.Invest Ophthalmol Vis Sci. 2019 Sep 3;60(12):3878-3886. doi: 10.1167/iovs.19-27113. Invest Ophthalmol Vis Sci. 2019. PMID: 31529082
-
[A challenge to primary open-angle glaucoma including normal-pressure. Clinical problems and their scientific solution].Nippon Ganka Gakkai Zasshi. 2012 Mar;116(3):233-67; discussion 268. Nippon Ganka Gakkai Zasshi. 2012. PMID: 22568103 Review. Japanese.
-
[Aiming for zero blindness].Nippon Ganka Gakkai Zasshi. 2015 Mar;119(3):168-93; discussion 194. Nippon Ganka Gakkai Zasshi. 2015. PMID: 25854109 Review. Japanese.
Cited by
-
The Effect of Aging on Retinal Function and Retinal Ganglion Cell Morphology Following Intraocular Pressure Elevation.Front Aging Neurosci. 2022 May 12;14:859265. doi: 10.3389/fnagi.2022.859265. eCollection 2022. Front Aging Neurosci. 2022. PMID: 35645783 Free PMC article.
-
Characterization of retinal function and structure in the MPTP murine model of Parkinson's disease.Sci Rep. 2022 May 9;12(1):7610. doi: 10.1038/s41598-022-11495-z. Sci Rep. 2022. PMID: 35534594 Free PMC article.
-
Neuroprotective Effect of Statins in a Rat Model of Chronic Ocular Hypertension.Int J Mol Sci. 2021 Nov 19;22(22):12500. doi: 10.3390/ijms222212500. Int J Mol Sci. 2021. PMID: 34830387 Free PMC article.
-
Retinal alpha-synuclein accumulation correlates with retinal dysfunction and structural thinning in the A53T mouse model of Parkinson's disease.Front Neurosci. 2023 May 5;17:1146979. doi: 10.3389/fnins.2023.1146979. eCollection 2023. Front Neurosci. 2023. PMID: 37214398 Free PMC article.
-
Comparison of laser and circumlimbal suture induced elevation of intraocular pressure in albino CD-1 mice.PLoS One. 2017 Nov 30;12(11):e0189094. doi: 10.1371/journal.pone.0189094. eCollection 2017. PLoS One. 2017. PMID: 29190824 Free PMC article.
References
-
- Beckel J. M., Argall A. J., Lim J. C., Xia J., Lu W., Coffey E. E., et al. . (2014). Mechanosensitive release of adenosine 5′-triphosphate through pannexin channels and mechanosensitive upregulation of pannexin channels in optic nerve head astrocytes: a mechanism for purinergic involvement in chronic strain. Glia 62, 1486–1501. 10.1002/glia.22695 - DOI - PMC - PubMed
-
- Benozzi J., Nahum L. P., Campanelli J. L., Rosenstein R. E. (2002). Effect of hyaluronic acid on intraocular pressure in rats. Invest. Ophthalmol. Vis. Sci. 43, 2196–2200. - PubMed
LinkOut - more resources
Full Text Sources
Other Literature Sources
Research Materials

