Review
. 2017 May;28(5):319-339.
doi: 10.1016/j.tem.2017.01.004. Epub 2017 Feb 22.

The Complex Roles of Mechanistic Target of Rapamycin in Adipocytes and Beyond

Affiliations
Review

The Complex Roles of Mechanistic Target of Rapamycin in Adipocytes and Beyond

Peter L Lee et al. Trends Endocrinol Metab. 2017 May.

Abstract

Having healthy adipose tissue is essential for metabolic fitness. This is clear from the obesity epidemic, which is unveiling a myriad of comorbidities associated with excess adipose tissue including type 2 diabetes, cardiovascular disease, and cancer. Lipodystrophy also causes insulin resistance, emphasizing the importance of having a balanced amount of fat. In cells, the mechanistic target of rapamycin (mTOR) complexes 1 and 2 (mTORC1 and mTORC2, respectively) link nutrient and hormonal signaling with metabolism, and recent studies are shedding new light on their in vivo roles in adipocytes. In this review, we discuss how recent advances in adipose tissue and mTOR biology are converging to reveal new mechanisms that maintain healthy adipose tissue, and discuss ongoing mysteries of mTOR signaling, particularly for the less understood complex mTORC2.


Figures

Figure 1
Figure 1. Current model of mTOR signaling pathways
(A) Simplified view of mTORC1 signaling. Multiple inputs converge upon mTORC1; amino acids and growth factor signaling are the best described and are depicted here. In the cytoplasm, the Sestrin and Castor proteins function as sensors for leucine and arginine. In response to direct amino acid binding, they release a break on the Gator2 and Gator1 complexes, which promote mTORC1 localization to the lysosome by allowing activation of the Rag-GTPases. This requires RagA/B conversion to the GTP bound form and RagC/D conversion to the GDP bound form respectively. Insulin and other growth factors activate mTORC1 through AKT, which phosphorylates the TSC GAP complex and thereby activates the Rheb GTPase. mTORC2 directly phosphorylates AKT and is required for full AKT activity; however, many studies indicate that mTORC2 is not essential for mTORC1 activity. Therefore, we have illustrated the connection between mTORC2 and AKT with a grey arrow in this panel. The mTORC1 activator Rheb also resides at the lysosome. Thus, amino acid sufficiency enables growth factor-driven mTORC1 activation by putting mTORC1 in proximity to its activator. Mechanisms of amino acid sensing from within the lysosome through the Slc38A9 and v-ATPase have also been described. Once activated, mTORC1 phosphorylates many substrates involved in anabolic metabolism and cell growth. Some mTORC1 targets such as S6K and GRB10 can feedback and inhibit insulin signaling. (B) Simplified view of mTORC2 signaling, which is less well understood. mTORC2 directly phosphorylates AKT at S473 in a C-terminal hydrophobic motif, which along with T308 phosphorylation by PDK1 in the kinase domain, is required for full AKT activity. These phosphosite locations correspond to AKT1; however, AKT exists in three isoforms (AKT1, AKT2, and AKT3) each containing structurally identical phosphorylation sites that are all thought to be regulated similarly by mTORC2. The classic model is that AKT is activated at the plasma membrane and this is facilitated by PI3K-generated PI(3,4,5)P3, which recruits PDK1 and AKT to the membrane through their PH domains. Traditionally, S473 phosphorylation was thought to be essential for subsequent T308 phosphorylation, which is critical for AKT kinase activity. However, genetic studies showed that a certain level of T308 phosphorylation can occur independently of S473 and that this is sufficient for AKT activity towards many downstream substrates including the TSC-Rheb-mTORC1 pathway. Thus, the essential role of AKT-S473 phosphorylation remains unclear. mTORC2 can also phosphorylate the SGK and PCKα kinases, which like AKT belong to the AGC kinase family. Unlike the case for AKT, mTORC2 is thought to be essential for all PKCα and SGK activity. It is unclear whether there are additional direct mTORC2 substrates though this has been speculated. Many upstream inputs to mTORC2 and potential intracellular sites of localization of mTORC2 have been described although a unifying mechanism of activation remains elusive. (C) Recent studies suggest that catecholamines might also stimulate mTORC1 through PKA signaling, and that this is important form promoting the browning of white adipose tissue.
Figure 2
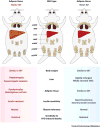
Figure 2. Adipose tissue specific Raptor (mTORC1) or Rictor (mTORC2) ablation causes severe but different metabolic complications
(Left) Congenital adipose tissue-specific Raptor/mTORC1 loss in mice progressively causes generalized lipodystrophy. At the cellular level, the depots are composed of heterogeneous adipocytes varying dramatically in cell size. Adipose tissue Raptor KO mice also have metabolic defects in other organs such as hepatomegaly, severe hepatic steatosis, insulin resistance, hyperphagy, and impaired gut lipid absorption. (Right) Adipose specific Rictor/mTORC2 loss in mice has little effect on fat morphology under standard dietary conditions; however, these mice develop profound insulin resistance associated with hyperinsulinemia. These mice also have mild hepatomegaly and hepatic lipid accumulation. Moreover, their livers are insulin resistant and have elevated hepatic glucose production; however, insulin stimulated muscle glucose uptake is normal. Interestingly, both mouse models are resistant to high fat diet (HFD) induced obesity. [Abbreviations] iBAT, interscapular brown fat; asWAT, anterior subcutaneous WAT; psWAT, posterior subcutaneous WAT; mWAT, mesenteric WAT; rWAT, retroperitoneal WAT; pgWAT, perigonadal WAT.
Figure 3
Figure 3. Metabolic and Transcriptional pathways in white adipocytes that are regulated by mTORC2
(Left) In normal white adipocytes, insulin simulates glucose uptake and its immediate conversion to glucose-6-phosphate (G-6-P). Some G-6-P is converted to pyruvate, which enters the mitochondria, and is converted to acetyl-CoA for entry into the TCA cycle. Some G-6-P is converted to glyceraldehyde-3-phosphate, which forms the glycerol backbone for triacylglycerol (TAG) synthesis. TAGs are stored in lipid droplets. When nutrients are plentiful, for example after a meal, TAGs are synthesized de novo from acetyl-CoA, which is exported from the mitochondria as citrate. The major enzymes that drive de novo lipogenesis, ATP-citrate Lyase (ACLY), ACC (Acetyl-CoA Carboxylase), FASN (Fatty Acid Synthase), and Elovl6 (Elongation of Very Long Chain Fatty Acids Protein 6) are transcriptionally regulated by the ChREBPα/β transcription factors. ChREBPβ is a more potent activator that is transcribed by ChREBPα in response to glucose uptake and metabolism. Non-esterified fatty acids are also taken up from circulation and converted to TAGs. When circulating nutrients are low, for example when fasting, TAGs and hydrolyzed through the process of lipolysis producing NEFAs and glycerol for release into circulation. (Right) In vivo genetic studies indicate that in the chronic absence of mTORC2 in white fat, glucose uptake and de novo lipogenesis are reduced and this correlates with lack of Chrebpβ mRNA expression and a large reduction in expression of its target genes, acly, acc, fasn, and elovl6. Whether G-3-P production or NEFA fatty acid uptake and TAG conversion is impaired is not known. In addition, lipolysis is elevated. Insulin normally functions to promote glucose uptake and suppress lipolysis and these effects are thought to be largely mediated by the mTORC2-subsrate AKT. However, insulin-stimulated AKT signaling appears to be intact in mTORC2-deficient adipocytes. Thus, the mechanism by which mTORC2 loss alters adipocyte glucose uptake and metabolism remains unclear.
Figure 4
Figure 4. Model of brown adipocyte pathways regulated by mTORC2
(Left) Brown adipocytes are specialized for adaptive thermogenesis, which is mediated by their unique expression of the mitochondrial localized uncoupling protein 1 (Ucp1) protein. Compared to white adipocytes, active brown adipocytes characteristically have multiple smaller lipid droplets (i.e. multi-locular), more mitochondria, increased glucose and lipid uptake, increased lipolysis and lipogenesis, and elevated fatty acid oxidation. (Right) Mice in which the mTORC2 subunit Rictor is conditionally deleted in Myf5+ precursor cells (e.g. with Myf5-Cre), which give rise to the major brown fat depots in mice, results in decreased BAT size, decreased markers of lipogenesis, smaller lipid droplets, and increased characteristics of fatty acid oxidation and thermogenesis. This suggests mTORC2 loss in BAT may reprogram BAT metabolism in favor of energy expenditure over energy storage. However, Myf5+ precursors also give rise to skeletal muscle cells and many other non-brown adipocyte cell types, and moreover, Myf5-Cre deletes Rictor early in development prior to BAT specification, so many questions remain as to the specificity of this phenotype and the role that BAT mTORC2 plays in glucose and lipid uptake, ChREBP activity, lipolysis, and UCP1-mediated thermogenesis.
Figure 5
Figure 5. Potential downstream mechanisms of mTORC2 function
(Left) Canonical mode of AKT activation in which PDK1 and AKT are co-localized at the plasma membrane through their N-terminal Pleckstrin Homology (PH) domains, which bind to PI(3,4,5)P3 (PIP3). At the plasma membrane PDK1 phosphorylates AKT at T308 in the kinase domain, which is critical for AKT activation. mTORC2 also functions at the plasma membrane to phosphorylate AKT at S473 in the C-terminal hydrophobic motif (HM), which is also required for full AKT activation. However, several studies (described in the text) suggest mTORC2 may be dispensable for pan-AKT signaling to all of its substrates, yet mTORC2 loss often has profound phenotypes. (Right) Possible alternative models of mTORC2-associated signaling pathways that might explain some mTORC2 loss-of-function phenotypes. (a) A non-canonical PI(3,4,5)P3-independent AKT signaling pathway could exist at an intracellular location that is distinct from the plasma membrane in which mTORC2-dependent phosphorylation is essential for PDK1 activation of AKT towards a distinct set of substrates; (b) mTORC2 also directly phosphorylates other AGC group kinases, such as SGK, PKC-α, and possibly unidentified effector kinases, which could cause mTORC2 loss-of-function phenotypes; (C) Rictor and mSin1 may function independently of mTOR to control metabolism.
Box 1, Figure 1
Box 1, Figure 1. The mTOR complexes and the domain structures of their individual subunits
(Left) Graphical representation of the mTOR complex 1 and mTOR complex 2 structures, which exist as dimers. (Right) Domain structure and relative sizes of the individual mTORC1 and mTORC22 subunits. The amino acid length of each subunit is indicated to the right. The Sin1 subunit has been detected as multiple isoforms and biochemical studies have shown that at least three isoforms are expressed that can define three unique mTORC2 formations.

Similar articles

Cited by

References

    1. Laplante M, Sabatini David M. mTOR Signaling in Growth Control and Disease. Cell. 2012;149(2):274–293. - PMC - PubMed
    1. Wullschleger S, Loewith R, Hall MN. TOR Signaling in Growth and Metabolism. Cell. 2006;124(3):471–484. - PubMed
    1. Chantranupong L, et al. The CASTOR proteins are arginine sensors for the mTORC1 pathway. Cell. 2016;165(1):153–164. - PMC - PubMed
    1. Ben-Sahra I, et al. mTORC1 induces purine synthesis through control of the mitochondrial tetrahydrofolate cycle. Science. 2016;351(6274):728–33. - PMC - PubMed
    1. Liu P, et al. Sin1 phosphorylation impairs mTORC2 complex integrity and inhibits downstream Akt signalling to suppress tumorigenesis. Nat Cell Biol. 2013;15(11):1340–50. - PMC - PubMed

Publication types

MeSH terms

Substances