. 2017 May;65(5):773-789.
doi: 10.1002/glia.23125. Epub 2017 Feb 16.

A sweet taste receptor-dependent mechanism of glucosensing in hypothalamic tanycytes

Affiliations

A sweet taste receptor-dependent mechanism of glucosensing in hypothalamic tanycytes

Heather Benford et al. Glia. 2017 May.

Abstract

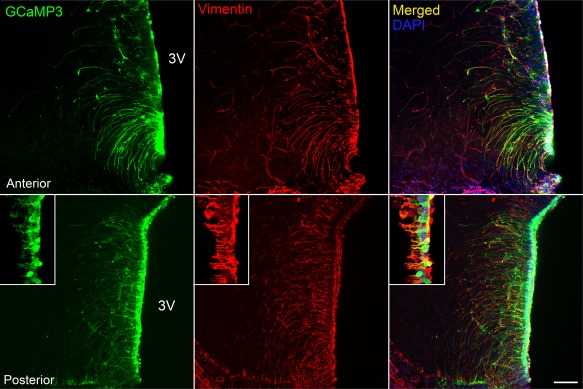
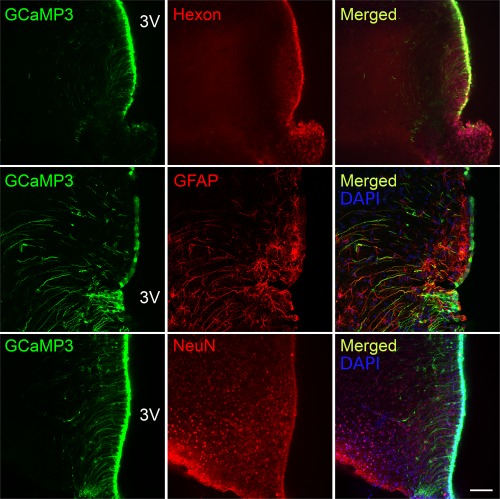
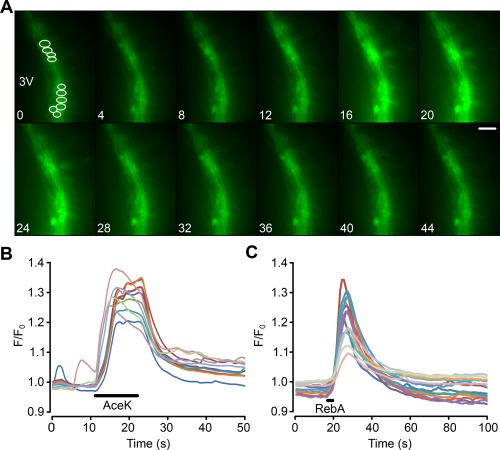
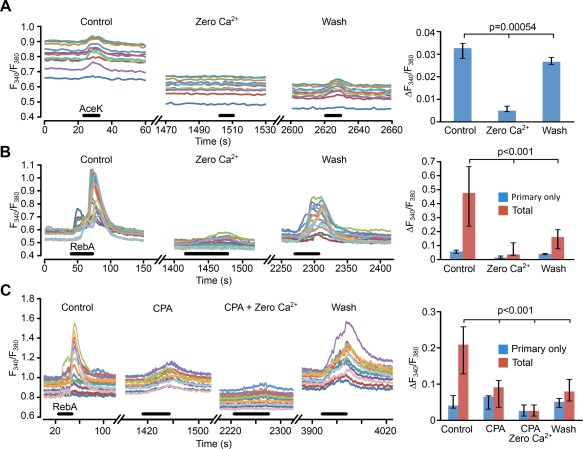
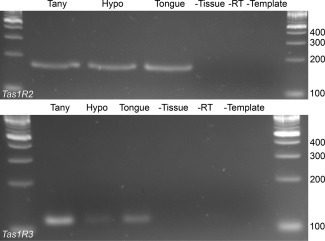
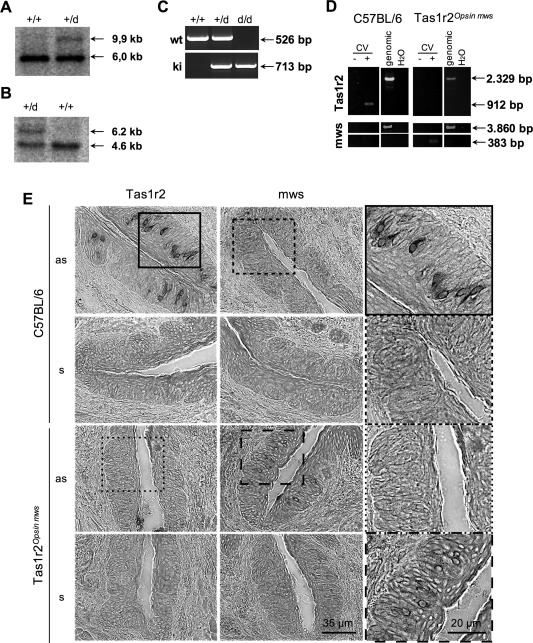
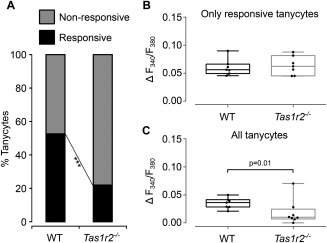
Hypothalamic tanycytes are glial-like glucosensitive cells that contact the cerebrospinal fluid of the third ventricle, and send processes into the hypothalamic nuclei that control food intake and body weight. The mechanism of tanycyte glucosensing remains undetermined. While tanycytes express the components associated with the glucosensing of the pancreatic β cell, they respond to nonmetabolisable glucose analogues via an ATP receptor-dependent mechanism. Here, we show that tanycytes in rodents respond to non-nutritive sweeteners known to be ligands of the sweet taste (Tas1r2/Tas1r3) receptor. The initial sweet tastant-evoked response, which requires the presence of extracellular Ca2+ , leads to release of ATP and a larger propagating Ca2+ response mediated by P2Y1 receptors. In Tas1r2 null mice the proportion of glucose nonresponsive tanycytes was greatly increased in these mice, but a subset of tanycytes retained an undiminished sensitivity to glucose. Our data demonstrate that the sweet taste receptor mediates glucosensing in about 60% of glucosensitive tanycytes while the remaining 40% of glucosensitive tanycytes use some other, as yet unknown mechanism.

Keywords: energy balance; hypothalamus; tanycyte.


Figures

Figure 1
Figure 1
Generation of Tas1r2 null mice. Schematic presentation showing the structure of Tas1r2 gene and the strategy for generating knock‐out mice. From top to bottom, targeting construct, the Tas1r2 wild type allele, the targeted Tas1r2 allele before (neo+) and after (neo) self‐induced deletion of the neomycin selection cassette (ACN) are shown. Light gray boxes represent coding sequences for either the Tas1r2 gene or the inserted mouse opsin 1 mws gene. The inserted sequence was composed of the coding sequence for opsin mws and the ACN cassette. This cassette, flanked by LoxP sites, contained the testis‐specific angiotensin‐converting enzyme promoter to drive Cre‐recombinase expression, and a murine RNA polymerase II promoter to drive expression of the neomycin resistance gene
Figure 2
Figure 2
Tanycytes in hypothalamic slices from juvenile rats respond to non‐nutritive sweeteners. (a) Montage of pseudo color images showing the response of tanycytes to a puff of RebA, scale bar 20 µm. The tip of the puffer pipette is shown in the first image. The ROIs for drawn around individual tanycytes to measure their activation are indicated in the first image of the montage (in white). Numbers correspond to timings in (b). The white arrows indicate responses individual tanycyte cell bodies in which the Ca2+ elevation is clearly distinguishable during the response. (b) Quantification of the responses to RebA, sucralose, and AceK in ROIs drawn around individual tanycytes in the same slice for each graph. Each sweetener tested on a different slice. Only Ca2+ recordings from ROIs of responding tanycytes shown
Figure 3
Figure 3
Tanycytes in hypothalamic slices from adult mice respond to non‐nutritive sweeteners. (a) Montage of pseudo color images showing the response of tanycytes to a puff of RebA, scale bar 20 µm. The tip of the puffer pipette is shown in the first image. The ROIs for drawn around individual tanycytes to measure their activation are indicated in the first image of the montage (in white). Numbers correspond to timings in (b). (b) Quantification of the responses to RebA, sucralose, and AceK in ROIs drawn around individual tanycytes in the same slice for each graph. Only Ca2+ traces from ROIs of responding tanycytes are shown. Each sweetener tested on a different slice
Figure 4
Figure 4
The AdV‐pTSHR‐GCaMP3 construct for targeting genetically encoded Ca2+ reporter to tanycytes [Color figure can be viewed at wileyonlinelibrary.com]
Figure 5
Figure 5
AdV‐pTSHR‐GCaMP3 specifically transduces tanycytes. Cells expressing GCaMP3 express vimentin, a marker of tanycytes, in cell body and soma, and have a morphology [soma lining the third ventricle (3V), and a single inwardly directed process] typical of tanycytes. The inset shows colocalization of vimentin with GCaMP3 in cell body and processes at higher magnification from different section. Scale bar 100 and 25 µm for inset
Figure 6
Figure 6
AdV‐pTSHR‐GCaMP3 does not transduce astrocytes or neurons. The cells that express GCaMP3 are a subset of the cells that express the hexon protein of the virus capsid, indicating selective promoter driven expression of GCaMP3 only in a subset of transduced cells. Astrocytes expressing GFAP do not express GCaMP3 even when close to ventricle wall. A subset of tanycytes also express GFAP. NeuN+ neurons in the brain parenchyma do not express GCaMP3. Scale bar 100 µm
Figure 7
Figure 7
Genetically identified tanycytes in mice, expressing GCaMP3, respond to non‐nutritive sweeteners. (a) Montage showing tanycyte response to a puff of AceK. Fluorescence increases in both the cell bodies and the processes of the tanycytes. Numbers correspond to the time scale in (b). Scale bar 20 µm. 3V indicates third ventricle. ROIs shown in first image of montage. (b,c) Quantification of the responses to AceK and RebA in ROIs drawn around individual tanycytes. The analysis in (b) is from the same experiment as (a). (b,c) from different slices [Color figure can be viewed at wileyonlinelibrary.com]
Figure 8
Figure 8
The secondary responses to non‐nutritive sweeteners depend upon activation of P2Y1 receptors. (a) 100 nM MRS2500 greatly reduces tanycyte responses to RebA. Left panel, ROI measurements from individual tanycytes in control MRS2500 and wash in the same slice. Right panel, histograms showing grouped data from 7 slices, which quantify the primary‐only and total responses to RebA. The primary responses are unaffected, but the total responses are reduced to about the same size as the primary only responses. Inset, shows examples of primary and secondary responses to non‐nutritive sweeteners. Inset, left: subdivision of the phases of a response to RebA (applied during black bar) into a primary (sweet receptor‐mediated, blue) and secondary response (ATP receptor‐mediated, red). Inset, right: an example where two tanycytes in the same slice individually exhibited only a primary and only a secondary response to RebA (applied during black bar). The arrows indicate onset of secondary responses. Note that in both cases the primary response has a slower onset than the secondary and that the secondary response can considerably outlast the period of application of tastant (black bar). (b) Left panel, MRS2500 (100 nM) almost completely blocks the responses to sucralose (ROI measurements from individual tanycytes in one slice). Right panel, summary histogram showing effect of MRS2500 on sucralose response from seven slices. (c) Left panel, MRS2500 (100 nM) has no effect of the tanycyte responses to AceK in mouse (ROI measurements from individual tanycytes in a single slice). Right panel, summary histogram, showing data from 6 slices for mouse and 3 slices for rat. All statistical comparisons made with Friedman 2 way ANOVA
Figure 9
Figure 9
The responses to non‐nutritive sweeteners require extracellular Ca2+. (a, Left panel) Response to AceK in rat is almost completely abolished by removal of extracellular Ca2+ (ROI measurements from individual tanycytes in a single slice). (a, Right panel) Summary histogram showing data from 9 slices. (b, Left panel) Total response to RebA is greatly reduced by when extracellular Ca2+ is removed (ROI measurements from individual tanycytes in a single slice). (b, Right panel) Summary histogram showing data from 7 slices. The primary‐only responses (n = 4 slices) show the same trend, but this effect is not significant. (c, Left panel) Combination of emptying internal stores (CPA) and removal of extracellular Ca2+ gives a greater reduction of the total response to RebA than removal of extracellular CPA alone (ROI measurements from individual tanycytes in a single slice). (c, Right panel) Summary histogram from eight slices. All statistical comparisons made with Friedman 2 way ANOVA
Figure 10
Figure 10
RT‐PCR data for Tas1r2 and Tas1r3 expression in the tanycyte layer and the hypothalamus. Primers for Tas1r2 and Tas1r3 gave PCR products of the expected size. The identities of the amplicons were confirmed by sequencing
Figure 11
Figure 11
Characterization of Tas1r2 null mice. (a,b) Genomic Southern Blot analysis of Tas1r2 +/+ and Tas1r2 +/d mice. EcoRI‐digested genomic DNAs extracted from wild type or heterozygous animals were subjected to Southern Blot analysis with 5′‐flanking probe I (a) that distinguishes wild type and knock in alleles for Tas1r2 or internal probe II (b) verifying the self‐excision of the ACN cassette by Cre‐recombinase. Probes I and II indicated in Figure 1. (c) Genotype analysis of Tas1r2 mice. PCR products identifying genotype of Tas1r2 mouse line based on specific oligonucleotides. (d) RNA isolated from lingual papillae (here vallate papillae, CV) were subjected to cDNA synthesis in or without presence of reverse transcriptase. PCR product specific for Tas1r2 was only detected in wild type animals, whereas opsin mws was exclusively detected in Tas1r2 null mice in gustatory tissue. (e) In situ hybridization analysis of tissue sections of Tas1r2 animals. Tissue sections of vallate papillae of C57BL/6 wild type and homozygous Tas1r2 null mice were hybridized with digoxigenin‐labelled riboprobes, recognizing Tas1r2 and opsin mws. Tissue sections of C57BL/6 mice showed robust labeling when hybridized with Tas1r2 antisense riboprobe (as). However, no signal was detected after hybridization with opsin mws as probe. In comparison to that, in tissue sections of homozygous Tas1r2 null mice no labelling was detected when hybridized with Tas1r2 as riboprobes, whereas hybridization with opsin mws as riboprobes resulted in the labelling of a comparable number of cells, indicating the successful knock in of mws and knock out of Tas1r2. Tissue sections hybridized with corresponding sense riboprobes did not show any labeling
Figure 12
Figure 12
The sweet taste receptor mediates glucosensing in hypothalamic tanycytes. (a) Proportion of glucosensitive tanycytes is greatly reduced in Tas1r2 null mice compared with wild type mice. (b) The magnitude of glucose responses in tanycytes that still respond in the Tas1r2 null mice are the same as those in wild type mice. (c) When glucosensitivity of all tanycytes is computed (i.e., including those that do not respond as well as those that do) the overall response magnitude is greatly reduced. *** p < .0001 χ 2 test; in (b and c) each dot represents the mean tanycyte response amplitude to glucose for a single mouse. Box and whisker plots show the median, upper, and lower quartiles and range

Similar articles

Cited by

References

    1. Balland, E. , Dam, J. , Langlet, F. , Caron, E. , Steculorum, S. , Messina, A. , … Prévot, V . (2014). Hypothalamic tanycytes are an ERK‐gated conduit for leptin into the brain. Cell Metabolism, 19, 293–301. - PMC - PubMed
    1. Bolborea, M. , & Dale, N. (2013). Hypothalamic tanycytes: Potential roles in the control of feeding and energy balance. Trends in Neuroscience, 36, 91–100. - PMC - PubMed
    1. Chaudhari, N. , & Roper, S. D. (2010). The cell biology of taste. The Journal of Cell Biology, 190, 285–296. - PMC - PubMed
    1. Curran‐Everett, D. (2000). Multiple comparisons: Philosophies and illustrations. American Journal of Physiology. Regulatory, Integrative and Comparative Physiology, 279, R1–8. - PubMed
    1. Dale, N. (2011). Purinergic signaling in hypothalamic tanycytes: Potential roles in chemosensing. Seminars in Cell & Developmental Biology, 22, 237–244. - PubMed

Publication types

LinkOut - more resources