

Spectrum of disease associated with partial lipodystrophy: lessons from a trial cohort
- PMID: 28199729
- PMCID: PMC5395301
- DOI: 10.1111/cen.13311
Spectrum of disease associated with partial lipodystrophy: lessons from a trial cohort
Abstract
Context: Partial lipodystrophy (PL) is associated with metabolic co-morbidities but may go undiagnosed as the disease spectrum is not fully described.
Objective: The objective of the study was to define disease spectrum in PL using genetic, clinical (historical, morphometric) and laboratory characteristics.
Design: Cross-sectional evaluation.
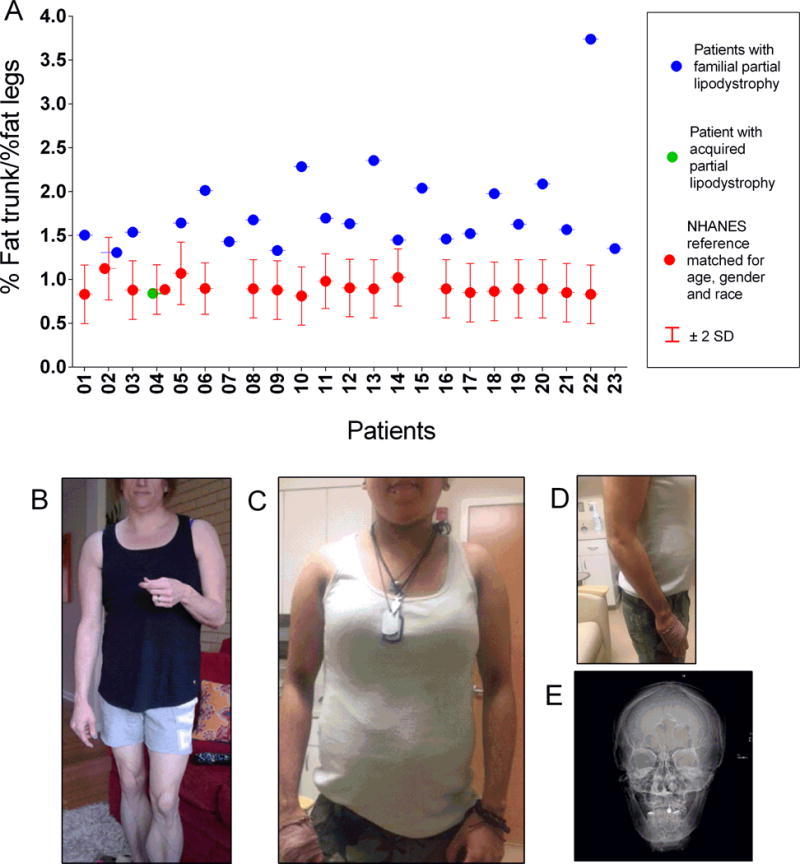
Participants: Twenty-three patients (22 with familial, one acquired, 78·3% female, aged 12-64 years) with PL and non-alcoholic fatty liver disease (NAFLD).
Measurements: Genetic, clinical and laboratory characteristics, body composition indices, liver fat content by magnetic resonance imaging (MRI), histopathological and immunofluorescence examinations of liver biopsies.
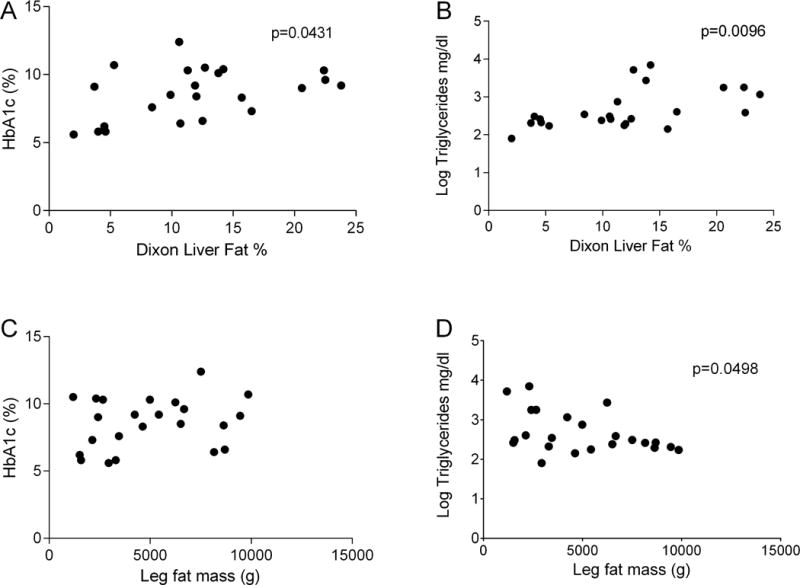
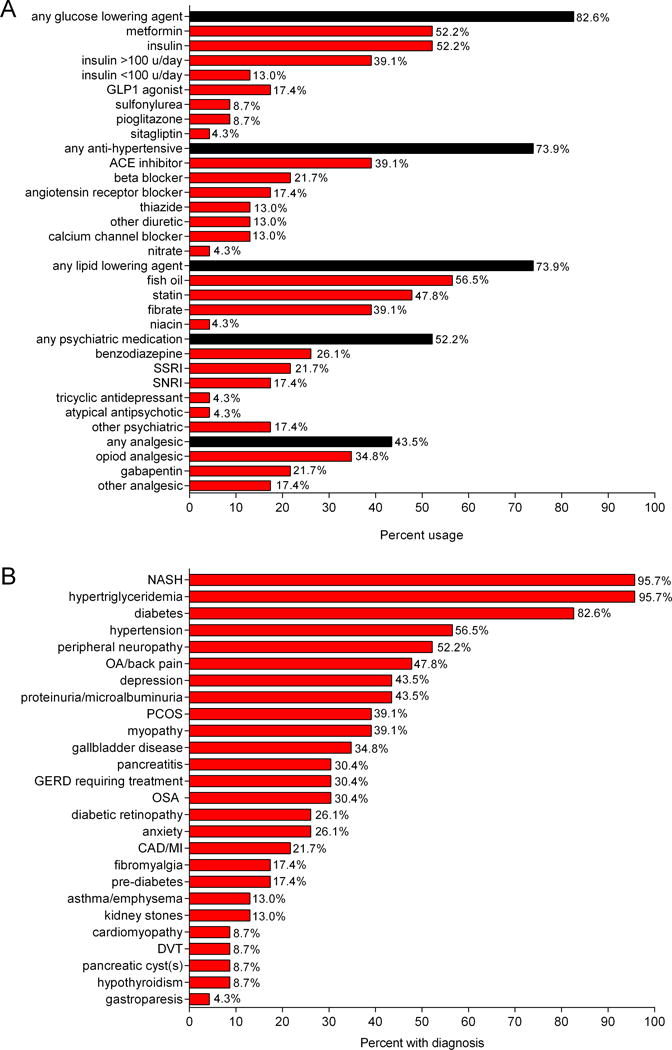
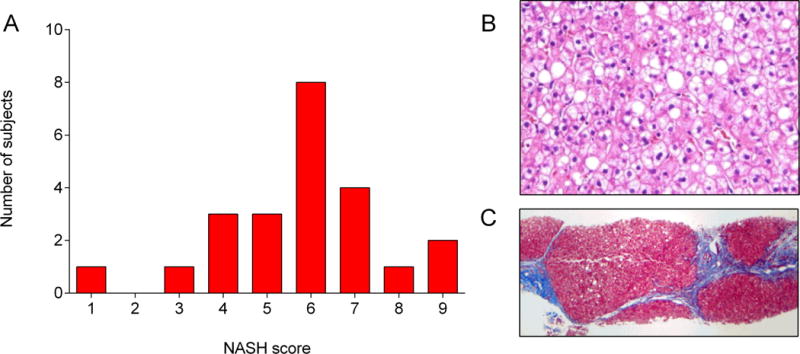
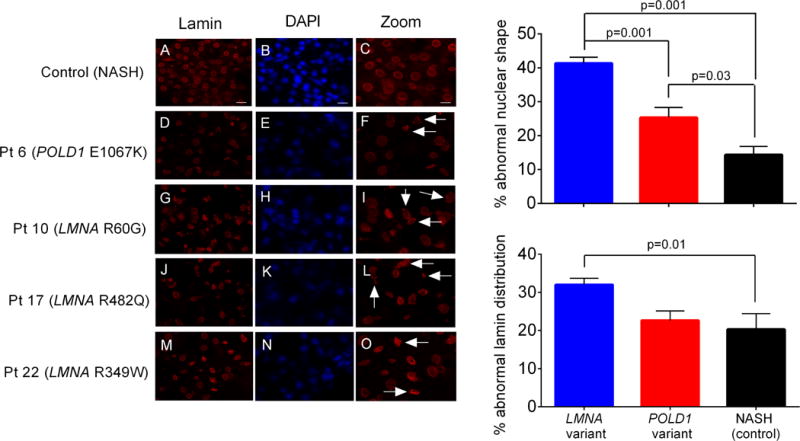
Results: Seven patients displayed heterozygous pathogenic variants in LMNA. Two related patients had a heterozygous, likely pathogenic novel variant of POLD1 (NM002691·3: c.3199 G>A; p.E1067K). Most patients had high ratios (>1·5) of percentage fat trunk to percentage fat legs (FMR) when compared to reference normals. Liver fat quantified using MR Dixon method was high (11·3 ± 6·3%) and correlated positively with haemoglobin A1c and triglycerides while leg fat by dual-energy X-ray absorptiometry (DEXA) correlated negatively with triglycerides. In addition to known metabolic comorbidities; chronic pain (78·3%), hypertension (56·5%) and mood disorders (52·2%) were highly prevalent. Mean NAFLD Activity Score (NAS) was 5 ± 1 and 78·3% had fibrosis. LMNA-immunofluorescence staining from select patients (including one with the novel POLD1 variant) showed a high degree of nuclear atypia and disorganization.
Conclusions: Partial lipodystrophy is a complex multi-system disorder. Metabolic parameters correlate negatively with extremity fat and positively with liver fat. DEXA-based FMR may prove useful as a diagnostic tool. Nuclear disorganization and atypia may be a common biomarker even in the absence of pathogenic variants in LMNA.
© 2017 The Authors. Clinical Endocrinology Published by John Wiley & Sons Ltd.
Figures
Similar articles
-
Regional Body Fat Changes and Metabolic Complications in Children With Dunnigan Lipodystrophy-Causing LMNA Variants.J Clin Endocrinol Metab. 2019 Apr 1;104(4):1099-1108. doi: 10.1210/jc.2018-01922. J Clin Endocrinol Metab. 2019. PMID: 30418556 Free PMC article.
-
Clinical Characteristics, Phenotype of Lipodystrophy and a Genetic Analysis of Six Diabetic Japanese Women with Familial Partial Lipodystrophy in a Diabetic Outpatient Clinic.Intern Med. 2018 Aug 15;57(16):2301-2313. doi: 10.2169/internalmedicine.0225-17. Epub 2018 Mar 30. Intern Med. 2018. PMID: 29607946 Free PMC article.
-
Diagnostic Value of Anthropometric Measurements for Familial Partial Lipodystrophy, Dunnigan Variety.J Clin Endocrinol Metab. 2020 Jul 1;105(7):2132-41. doi: 10.1210/clinem/dgaa137. J Clin Endocrinol Metab. 2020. PMID: 32193531 Free PMC article.
-
Lipodystrophy for the Diabetologist-What to Look For.Curr Diab Rep. 2022 Sep;22(9):461-470. doi: 10.1007/s11892-022-01485-w. Epub 2022 Jul 11. Curr Diab Rep. 2022. PMID: 35821558 Free PMC article. Review.
-
Clinical Spectrum of LMNA-Associated Type 2 Familial Partial Lipodystrophy: A Systematic Review.Cells. 2023 Feb 24;12(5):725. doi: 10.3390/cells12050725. Cells. 2023. PMID: 36899861 Free PMC article. Review.
Cited by
-
Lamins and Lamin-Associated Proteins in Gastrointestinal Health and Disease.Gastroenterology. 2018 May;154(6):1602-1619.e1. doi: 10.1053/j.gastro.2018.03.026. Epub 2018 Mar 13. Gastroenterology. 2018. PMID: 29549040 Free PMC article. Review.
-
Comorbidities and Survival in Patients With Lipodystrophy: An International Chart Review Study.J Clin Endocrinol Metab. 2019 Nov 1;104(11):5120-5135. doi: 10.1210/jc.2018-02730. J Clin Endocrinol Metab. 2019. PMID: 31314093 Free PMC article.
-
Waist circumference is independently associated with liver steatosis and fibrosis in LMNA-related and unrelated Familial Partial Lipodystrophy women.Diabetol Metab Syndr. 2023 Sep 7;15(1):182. doi: 10.1186/s13098-023-01156-0. Diabetol Metab Syndr. 2023. PMID: 37679847 Free PMC article.
-
Efficacy and Safety of Glucagon-Like Peptide 1 Agonists in a Retrospective Study of Patients With Familial Partial Lipodystrophy.Diabetes Care. 2024 Apr 1;47(4):653-659. doi: 10.2337/dc23-1614. Diabetes Care. 2024. PMID: 38300898 Free PMC article.
-
Approach to the Patient With Lipodystrophy.J Clin Endocrinol Metab. 2022 May 17;107(6):1714-1726. doi: 10.1210/clinem/dgac079. J Clin Endocrinol Metab. 2022. PMID: 35137140 Free PMC article.
References
-
- Chan JL, Oral EA. Clinical classification and treatment of congenital and acquired lipodystrophy. Endocr Pract. 2010;16(2):310–23. - PubMed
-
- Vigouroux C, Caron-Debarle M, Le Dour C, et al. Molecular mechanisms of human lipodystrophies: from adipocyte lipid droplet to oxidative stress and lipotoxicity. Int J Biochem Cell Biol. 2011;43(6):862–76. - PubMed
-
- Farhan SM, Robinson JF, McIntyre AD, et al. A novel LIPE nonsense mutation found using exome sequencing in siblings with late-onset familial partial lipodystrophy. Can J Cardiol. 2014;30(12):1649–54. - PubMed
MeSH terms
Supplementary concepts
Grants and funding
LinkOut - more resources
Full Text Sources
Other Literature Sources
Miscellaneous
